-
Paper Information
- Next Paper
- Previous Paper
- Paper Submission
-
Journal Information
- About This Journal
- Editorial Board
- Current Issue
- Archive
- Author Guidelines
- Contact Us
International Journal of Food Science and Nutrition Engineering
p-ISSN: 2166-5168 e-ISSN: 2166-5192
2013; 3(5): 95-100
doi:10.5923/j.food.20130305.04
Free Amino Acids and Fatty Acids Composition of the Jibna–Beida Collected from Some Sudanese Markets
Zakaria A. Salih1, Abdel Moneim E. Sulieman2, Elamin A. Elkhalifa1, Ali O. Ali1
1Department of Food Science and Technology, Faculty of Engineering and Technology, University of Gezira, Wad-Medani, Sudan
2Department of Biology, Faculty of Science, University of Hail, Kingdom of Saudi Arabia
Correspondence to: Abdel Moneim E. Sulieman, Department of Biology, Faculty of Science, University of Hail, Kingdom of Saudi Arabia.
| Email: |  |
Copyright © 2012 Scientific & Academic Publishing. All Rights Reserved.
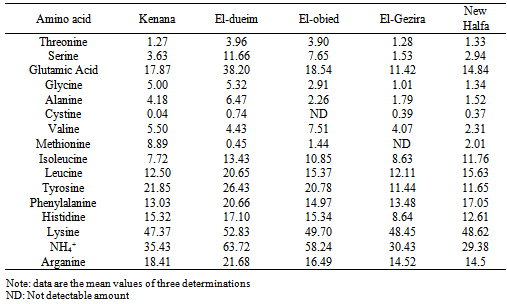
This study aimed to determine the free amino acids and fatty acids content in Jibna–beida found in Sudanese local markets (Kenana, Eldueim, Elobeid, ELgezira and New Halfa). All samples contained appreciable amounts of the amino acids. The content of essential amino acids such as Threonine, valine, methionine, isolucine, leucine, phenylalnine and lysine varied in various cheese samples. The highest contents of threonine (3.96 mg/100g), isoleucine (13.43 mg /100g), pheyalalanine (20.66 mg /100g) and lysine (52.83 mg / 100g), The highest amount of non essential amino acid was recorded for the cheese samples from Eldeium as follows; serine: 11.6 mg/100g glutamic acid: 38.20 mg/100g, glycine: 5.32 mg/100g, alanine: 6.47 mg/100g, cystine: 0.74 mg/100g, tyrosine: 26.43 mg/100g, histidine: 17.10 mg/100g, NH4: 63.72 mg/100g and arganine 21.68 mg/100g. On the other hand, the lowest non essential amino acids contents were found in El-Gezira and New Halfa cheese samples. For the saturated fatty acids, the most abundant were plamitic, stearic, and myristic which ranged between 28.00 and 31.38g/100g, 11.77 and18.03 g/100g and 9.04 and 10.07g/100g, respectively. In addition, low proportions of unsaturated fatty acids were found with the exception of oleic acid which had a high content in the collected cheeses.
Keywords: Cheese, Amino acids, Fatty acids
Cite this paper: Zakaria A. Salih, Abdel Moneim E. Sulieman, Elamin A. Elkhalifa, Ali O. Ali, Free Amino Acids and Fatty Acids Composition of the Jibna–Beida Collected from Some Sudanese Markets, International Journal of Food Science and Nutrition Engineering, Vol. 3 No. 5, 2013, pp. 95-100. doi: 10.5923/j.food.20130305.04.
Article Outline
1. Introduction
- White cheese (jibna-beida) is the most common kind of cheese on the Sudanese market available to the public[1]. Cheese production in the Sudan has been started by foreign families migrated to the Sudan and settled mainly in Ed Dueim, in Blue Nile Provine. Sudanese Gibna Bayda is unique among cheese varieties in that high concentration of table salt is added to the milk before processing[2]. It is manufactured from raw or heated milk[3]. Cheese making is a major milk preservation method in Sudan[2]. There are two main types of cheeses in Sudan white cheese (Jibna beida) and braided semi hard cheese (Mudaffarra) other types of cheese provided recently by Sudanese industries are Mozzarella and Gouda cheese. The amounts of free amino acids in cheeses are depending on many factors. These comprise the quantities of proteins in the raw materials used for production, activity of proteolytic enzymes in the dairy procedures, and microorganisms involved in this process[4]. Proteolysis in cheese during ripening plays a vital role in the development of texture as well as flavor and has been the subject of several reviews[5][6]Proteolysis contributes to the textural changes of the cheese matrix, due to the breakdown of the protein network, decrease at aw through water binding by the liberated carboxyl and amino groups, and increase in pH, which facilitates the release of sapid compounds during mastication. The determination of free amino acids plays an important role in assessing the nutritional quality of foods[7][8]). In addition, amino acids determination also gives an indication of possible adulteration and transformation occurring during the processing and storage procedure.Fatty acids mostly originate from the biolysis of the milk fat. The lipase responsible for their production probably originates from the milk itself, since milk fat must be partially hydrolyzed before the starter culture lipases become effective[9].Positive cheese flavor is a result of the balance between different flavor compounds produced during ripening. Two important classes of compounds that contribute to flavor are volatile sulfur compounds and fatty acids. Free fatty acids more than likely contribute to flavor and odor of cheese[10]. The objective of the present study was to determine the free amino acids and fatty acids composition of Jibna–beida found in Sudanese local markets.
2. Materials and Methods
2.1. Sampling
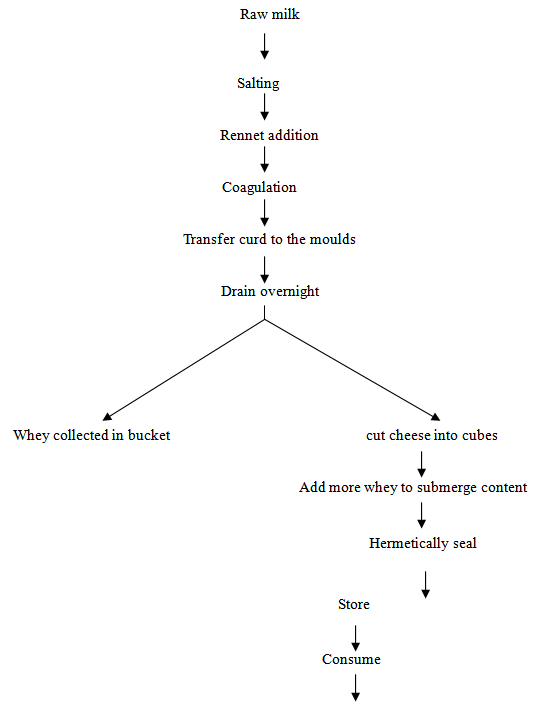
- Cheese samples were collected in clean dry and sterilized plastic containers from local markets in Kenana, Eldueim, Elobeid, ELgezira and New Halfa, during September (2007). All collected samples were then placed in an insolated box containing ice crystals to suppress microbial growth during transportation to laboratory. The samples were kept at 4o and transported to the department of Food Science and Technology, University of Gezira, while some of the sample were transported to the of Food Technology Research Institute-Egypt. Jibna-beida in these sites had been manufactured as illustrated in Fig. (1).
2.2. Methods
2.2.1. Determination of Free Amino Acids Composition
2.2.1.1. Preparation of the Calibration Standard
- For the preparation, the calibration standard was combined with An internal standard –40 µl Amino Acid Hydrolysate + 40 µl internal standard stock solution (6.45 mg a-aminobutyric acid to 25 ml 0.1M HCl) + 920 µl Milli-Q water.
2.2.1.2. Derivatising the Calibration Standard
- The derivatisation procedure involved preheating of the heating block to 55°C and tube mixing of 10 µl of the calibration standard + 70 µl AccQ•Fluor Borate Buffer in a tube, then mixeing the mixture with Vortex briefly, the addition of 20 µl, reconstituted AccQ•Fluor Reagent, and mixing immediately for several seconds with Vortex. The content was then transferred to the bottom of an autosampler vial which was heated in the heating block or an oven at 55°C for 10 minutes. A 10 µl injection of the derivatised standard contained 50 pmol of each amino acid derivative (except cystine, at 25 pmol).
2.2.1.3. Preparing Cheese Samples
- The extraction and deproteination were carried out de by first dispersing 1.0 g of grated cheese in 100.0 ml 0.1 mol/l hydrochloric acid solution containing 0.4 µmol/ml a-amino butyric acid as an internal standard in a 250 ml centrifuge tube. The dispersion was homogenised on Ultra-Turrax (IKA Werke, Germany) at 20 000 rpm and kept in a covered tube (Para-Film) for a maximum of 30 min in an ultrasonic bath. The sample was then centrifuged at 3000 g and 4°C for 10 min, and 5 ml of the supernatant was added to 5 ml of 400 g/l trichlo roacetic acid solution. The suspension was mixed on a Vortex mixer, kept in an ice bath for 10 min, and centrifuged at 20000 g for 10 min[11] (Butikofer & Ardö 1999). From this solution 10 µl was taken for the derivatisation procedure.
2.2.1.4. Derivatisation of Samples
- Ten µl of the treated sample + 70 µl AccQ•Fluor Borate Buffer weremixed in a sample tube and briefly homogenised with Vortex, 20 µl reconstituted AccQ•Fluor Reagent was added and the mixture was mixed immediately for several seconds with Vortex. The content was then transferred to the bottom of an autosampler vial, and the vial was heated in the heating block at 55°C for 10 minutes.
2.2.1.5. HPLC
- A Waters Alliance 2695 HPLC system with a 2475 Multi λ Fluorescence detector (Waters, Milford, Massachusetts, USA) was used for the HPLC analyses (excitation at 250 nm and emission at 395 nm). AccQ•Tag amino acid column Nova-Pak C, 4 µm (150 × 3.9 mm) from Waters was used. The column was thermostated at 37°C. 10 µl was the injection volume (concentration of amino acids 5–200 pmol). 18 A gradient mobile phase was used for chromatography. The mobile phase consisted of eluent A (prepared from Waters AccQ•Tag Eluent A concentrate, by adding 200 ml of concentrate to 2 l of Milli-Q water and mixing), eluent B (aceto- nitrile, HPLC grade) and eluent C (Milli-Q water)
2.2.2. Determination of Fatty Acids Composition
- Fatty acid composition of different samples was analyzed by gas liquid chromatography (GLC) using capillary columns. Fatty acids methyl esters were analyzed using GC (Thermo Quest) equipped with flame ionization detector (FID), and fitted with a fused silica capillary column (SP2380, 30 m, 0.25 mm, Supelco Inc., Bellefonte, PA). Injector and detector temperature was 250°C as internal standard. The initial oven temperature was 40°C for 1.0 min, and then increased to 240°C at 5°C/min. The final temperature was maintained for 10 min. Nonanoic acid was used A standard fatty acid mixture containing 37 fatty acids (Sigma-Aldrich Chemicals 189-19) was used to provide standard retention times. Fatty acids were identified by comparing their retention times with those of fatty acids in standard samples. An autosystem Thermoquest GC-MS, equipped with flame ionization detector (FID) was used to analyse FFAs of cheese samples. The carrier gas was helium at 2 ml min-1. Inj ection of 1 µL sample was applied with a split ratio of 1:30 into the inj ector. Identification of chromatographic peaks was carried out by comparison of their retention times using appropriate standards of fatty acid methyl esters (Merk, Sigma). The values reported for fatty acid composition were the average of three determinations.
3. Results and Discussion
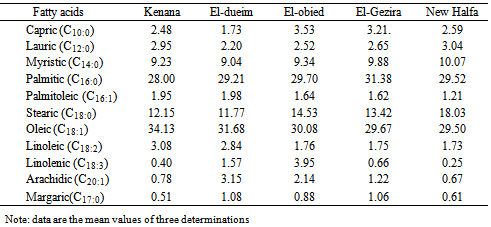
- The amount of free amino acids in cheese are depending on many factors. These comprise the quantities of proteins in the raw materials used for production, activity of proteolytic enzymes in the dairy procedures, and microorganisms involved in this process Proteolysis in cheese during ripening plays a vital role in the development of texture as well as flavour and has been the subject of several reviews. The determination of free amino acids play an important role in assessing the nutritional quality of foods[12].Table (1) shows the free amino acid content of cheese samples collected from different areas expressed as mg amino acid /100g sample. The content of essential amino acids "threonin, valine, methionine, isolucine, leucine, phenylalnine and lysine" varied in various cheese samples. The highest contents of threonine (3.96mg /100g), isoleucine (13.43 mg /100g), pheyalalanine (20.66 mg/100g) and lysine (52.83 mg/100g), whereas found in cheese sample from El-dueim, whereas the lowest values of these amino acids was found in cheese samples from Kenana (1.27 mg /100g). However, highest valine and mothionine values were found in cheese samples from El-obied and Kenana. The obtained values of essential amino acids in cheese samples were lower than those reported by Morcos and Esteban[13] for Blue and cheddar cheese and Izco et al.[14] for Roncal cheese. The content of non essential amino acids "serine, glutamic acid, glysine, alanine, cystine, tyrosine, histidine, NH4 and arginine" also varied in different cheese samples; in some samples the difference was small while in others the difference was big. The highest amount of non essential amino acid was recorded for the cheese samples from Eldeium as follows; serine: 11.6mg/100g glutamic acid: 38.20mg/100g, glycine: 5.32mg/100g, alanine: 6.47mg/100g, cystine: 0.74 mg/100g, tyrosine: 26.43 mg/100g, histidine: 17.10mg/100g, NH4: 63.72mg/100g and arganine 21.68 mg/100g. On the other hand, the lowest non-essential amino acids content was found in cheese samples from El-Gezira, and New Halfa. The content of serine of cheese samples from Kenana, ElGezira and New Halfa have lower than that reported by Ohaj (2009)[12] for Gouda cheese who found a value of 4.07 mg/100g.The content of other non essential amino acids such as glutamic acid, tyrosine, histidine and arganine of all collected cheese samples were higher than that reported by Ohaj[12] who found that glutamic acids tyrosine histidine and arganine contents were 6.45mg/100g, 3.39 mg/100g, 2.27 mg/100g and 2.26 mg/100g, respectively in Gouda cheese. Also, these values are lower than those reported by Kabelova et al.[15] who found that the content of serine was (9.8 g/kg), glutamic acid (1.8 g/kg), glycine (29.6 g/kg), histidine (1.9 g/kg), arganine 2.3 g/kg), alanine (29.0 g/kg), tyrosine (1.5 g/kg), valin (7.1 g/kg), phenylealanine (9.7 g/kg), and leucine (14.1 g/kg). However, the results did not agree with Sulieman[16] for Sudanese traditional fermented milk products "Rob” who found that the average content of theronine, valine, me,’.thionine, leucine, tyrosine, serine, glutamic acid, histieline, leucine, and arganine, were 1.8mg/100g, 1.07 mg/100g, 0.12 mg/100g 2.3 mg/100g, 4.6 mg/100g, 2.3 mg/100g, 3.0 mg/100g. 0.12 mg/100g 2.3 mg/100g and 0.2 mg/100g, respectively.Generally, the data in Table (1) show that cheese samples from different areas are rich in most of amino acids. No general difference occurred the various cheeses from the various sites in most of their contents of free amino acids. However, among individual amino acids, six amino acids were more concentrated in all cheese samples, these are lysine, tyrosine, glutamic acid, histidine, phenylalanine and leucine in consequence.Fatty acids mostly originate from the biolysis of the milk fat. The lipase responsible for their production probably originates from the milk itself, since milk fat must be partially hydrolyzed before the starter culture lipases become effective[9].Positive cheese flavor is a result of the balance between different flavor compounds produced during ripening. Two important classes of compounds that contribute to flavor are volatile sulfur compounds and fatty acids[17][18]. Low concentrations of fatty acids in cheese indicate a young, unripened cheese. Hovewer, extensive lipolysis is considered to be undesirable for some cheese types. Especially short chain FFAs may directly affect flavor development. Excessive concentrations of some FFAs are reported to be perceived as off-flavors.Results of fatty acid composition of collected cheese samples are presented in Table (2) as g/100g total fatty acids. The fatty acid composition of all samples varied. For the saturated fatty acids, the most abundant in the cheese samples investigated were plamitic (C16:0), stearic (C18:0), and myristic (C14:0) which ranged between 28.00 and 31.38 g/100g, 11.77 and18.03 g/100g and 9.04 and 10.07 g/100g, respectively. Palmitic acid was found to have of the highest level saturated fatty acids in all cheese samples. Palmitic acid is one of the major saturated fatty acids, it raises serum cholesterol, while stearic acid dos not[19]. On the other hand, capric acid (C10:0) and lauric acid (C12:0) were found to have the lowest level among the saturated fatty acids in cheese samples. Also there were low proportions of unsaturated fatty acids with the exception of oleic acid (C18:1) which had a high content, the finding is in agreement with that reported by Sulieman[16] for Sudanese traditional fermented milk "Rob".As seen in Table (2) Palmitic acid and oleic acid were predominante fatty acids, also oleic acid was found in a higher concentration (29.5– 34.13g/100g) in all cheese samples. Sagdic et al.[20], and Molkentin[21] have reported similar values (20 – 24g/100g) for Turkish and German dairy products.
|
|
- However, collected cheese samples contained low values of some fatty acids like capric (C10:0), lauric (C12:0) margaric (C17:0), linoleic (C:18:2), linolenic (C18:3) and arachidic (C20:0) whichaveraged 2.70 ± 0.69 g/100g, 2.66 ± 0.31 g/100g, 0.92 ± 0.24 g/100g, 2.23 ± 0.67g/100g, 1.37 ± 1.53 g/100g and 1.58 ± 1.06 g/100g, respectively. These values were higher when compared to those reported by Ohaj[12] for laboratory – made Gouda chesses, he found that the content of capric, lauric, margaric, linoleic, linlolenic and arachidic acids were 1.88%, 0.08g/100g, 0.60%, 0.14%, 0.10% and 0.58, respectively, whereas the level of capric acid and l lauric acid were lower than those reported by Kinik et al.[22 for Turkish white cheese, who reported a range of 2.24 – 13.11 g/100g and 7.31 – 12.00g/100g, respectively. On the other hand, the concentration of long chain fatty acids margaric (C17:0) and arachidic (C20:0) of cheese samples were higher that that reported by Kinik et al.[22], for fresh Kashar, Turkish cheese, who found a range of 0.45 to 0.71g/100g and 0.20 – 0.27g/100g, respectively.
4. Conclusions
- The chemical analysis indicated that cheese samples collected from the various sites contained appreciable amounts of essential and non-essential amino acids as well as fatty acids, however, most of the amino acids and fatty acids composition in cheese samples from different areas were in close agreements to those of literature values with slight variations.
ACKNOWLEDGEMENTS
- The paper is a part of PhD thesis submitted by the first author to Gezira University. The authors express their thanks for Ministry of Higher Education of Sudan which funded this research.
 Abstract
 Reference
 Full-Text PDF
 Full-text HTML

