Abdel Moneim E. Sulieman1, Enas A. Sinada2, Ali O. Ali2
1Department of Biology, Faculty of Science, University of Hail, Hail, Kingdom of Saudi Arabia
2Department of Food Science and Technology, Faculty and Engineering and Technology, University of Gezira, Wad-Medani, Sudan
Correspondence to: Abdel Moneim E. Sulieman, Department of Biology, Faculty of Science, University of Hail, Hail, Kingdom of Saudi Arabia.
| Email: |  |
Copyright © 2012 Scientific & Academic Publishing. All Rights Reserved.
Abstract
The objectives of this study was to supplement wheat flour (WF ) with various levels of chickpea flour (WCF) for production of bread, to determined the nutritional value of bread supplemented with chickpea flour, to asses consumer acceptability for the production bread and to study rheological characteristics of the wheat flour supplemented with chickpea flour. The results show that the total amino acids were higher in supplemented bread (WCB) than wheat bread (WB). Lysine content increased from 296.8 to 534.8, 670.7, and 937 mg/ 100 gm in wheat flour, 5, 10 and 15% levels of chickpea flour, respectively. Water absorption of dough prepared from wheat flour and wheat flour supplemented with various levels of chickpea flour ranged between 59.5- 60.3%, dough stability was 1.8-1.1 min, dough development time for wheat flour which was 1.8, decreased to 1.4 with addition of chickpea flour. Wheat flour supplemented with 5, 10 and 15% chickpea flour showed energy increases at 5% level, then decreased gradually at 10 and 15% levels of chickpea flour. The study recommended supplementation of bread with 5% chickpea flour to upgrade its nutritional value and quality.
Keywords:
Composite Flour, Bread, Gluten Quality, Dough
Cite this paper: Abdel Moneim E. Sulieman, Enas A. Sinada, Ali O. Ali, Quality Characteristics of Wheat Bread Supplemented with Chickpea (Cicer arietinum) Flour, International Journal of Food Science and Nutrition Engineering, Vol. 3 No. 5, 2013, pp. 85-90. doi: 10.5923/j.food.20130305.02.
1. Introduction
Composite flour in bread making took place during recent years in order to improve the nutritional value of diet such as improving the balance of essential amino acid and carbohydrate contents. Supplementation of cereal flour with legume flours has great potential in developing countries for improving nutritional value of different baked product[1]. Supplementation with legumes is one way to meet the need of protein foods, particularly baked food. Grain legumes occupy an important place in human nutrition.Food crops have occupied an important place in human nutrition as they remain the major sources of calories and protein for a large proportion of the world’s population, particularly in developing countries. For economic and social reasons, many millions of people in Asia and African countries depend on vegetable products of cereals and legumes sources. According to the FAO available data, about 80% of the protein consumed by the humans in developing countries is supplied by the plants. Pulses, including beans and chickpea are one of the most important crops in the world because of their nutritional quality. They are rich sources of complex carbohydrates, protein, vitamins and minerals[2][3].Chickpea are edible legumes belonging to the family (Fabaceae) with slightly longer in size than the normal peas. They are also known by the name of (Garbanzo beans), and have a nut like taste with a high protein content in them. The plant of chickpeas grows between 20 - 25 cm and has a feathery leaves on both side of the stem. Chickpea can grow well only in subtropical and tropical climates requiring an annual rainfall of more than 400mm.Chickpea proteins are considered suitable source of dietary protein due to excellent balance of essential amino acid composition[4]. Chickpea is a popular food item in many countries, and the value of these legumes as nutritional supplement has been previously demonstrated.Bread making is an ancient industry, but its improvement was going slowly till the nineteenth century when science and technology made it possible to control its different operations[5]. The objectives of this study were to supplement wheat flour with various levels of chickpea flour for production of bread and to determine the nutritional value of bread supplemented with chickpea flour.
2. Materials and Methods
Chickpea samples were obtained from Khartoum local market. The sample were cleaned carefully and then milled with a laboratory mill (model 120 No 69444) into fine powder.Wheat flour sample was obtained from the local market too whereas the other materials were obtained from Food Research Centre, Khartoum, Sudan. Wheat and wheat composite flour formulations included: wheat flour (WF); wheat flour supplemented with 5%, 10% and 15% chickpea flour (WCF).
2.1. Gluten Quality and Quantity
Gluten quality and quantity were carried on wheat flour and wheat-chickpea flour according to standard ICC method[6]. In which, 10 g sample were mixed into dough with 5ml distilled water in a test chamber with bottom sieve, then the dough was washed with 2% sodium chloride solution. Gluten ball obtained was centrifuged and quickly weighed. The percentage of wet gluten remaining in the sieve after centrifugation is defined as the gluten index. The total wet gluten was dried in a heater to give the dry gluten. The weight of gluten was multiplied by ten to give the percentage of wet or dry gluten.
2.2. Determination of Falling Number
Falling Number test measures the α-amylase activity. Alpha-amylase is an inherent enzyme of wheat which converts starch into simple sugars. Falling Number value is critical for final product because there is direct relationship between α-amylase activity and finished product attributes e.g. bread crumb quality and loaf volume. Proper amount of α-amylase (FN=250) in the flour is desirable for proper baking to occur.Alpha amylase activity was carried on pure wheat flour and wheat flour with added chickpea flour at 5, 10 and 15 percentages. The wheat flour with or without chickpea flour were weighed, and transferred into the falling number tube and 25±0.2 ml distilled water were added, the stopper was flitted into the top of the viscometer, and shaken well for 25 times until formation of a homogenous suspension. The viscometer tube was placed in the boiling water bath, and locked into position. The sample was stirred for 60 second, and then the viscometer stirrer was stopped in up position, released through the uniform gelatinized suspension. The time in seconds for the stirrer to fall through the suspension was recorded as the falling number (seconds).
2.3. Determination of Rheological Characteristics of the Dough
The physical characteristics of the different dough samples were determined using Farinograph and Extensograph.Brabender Farinograph was used according to AACC[7]. A sample of 300 gram was weighed and transferred into a cleaned mixer. The Farinograph was switched on 63 rpm for one minute and then the distilled water was added from especial burette. When the consistency was constant the instrument was switched off and the water drawn from the burette indicates water absorption of the flour in percentage.Extensograph method was used according to AACC (2000)[7]. The dough for Extensograph was prepared as for the Farinograph. Three pieces of dough (150 gm of each) were weighed molded on balling unit, rolled with dough roller into cylindrical test pieces, fixed in the dough holder and stored in the rest cabinet for 45 min. The dough pieces was placed on the balance arm of Extensograph and stretched by stretching hook until it behavior of the dough was recorded on a curve via Extensograph this test was performed at 45, 90 and 135 min.
2.4. Amino Acid Profile
The amino acid composition of all samples was determined according to the official method using Sykam HPLC system. The samples were prepared by adding 200 mg of each sample in hydrolysis tube. Then 5ml of 6 NHCl were added to each tube and the tube was closed. Each tube was incubated at 100°C for 24 hours. After that the solution was filtered using 125 mm filter paper. A 200 ml of the filtrates were evaporated at 140°C for an hour. Diluted buffer was added to the dried sample and then the samples were ready for analysis. The HPLC system was calibrated with a standard amino acid kit solution and then the sample hydrolysate was injected into HPLC analyzer system with an auto injector.
2.5. Bread Making
Bread was made with or without chickpea flour at 5, 10 and 15 percentage. Dry ingredients flour(250g), dry yeast (25g), salt (1.5g) and sugar (3g) were mixed for one min. Water was added (based on the Farinograph optimum absorption) and mixed for three min at medium speed. After mixing the dough was allowed to rest for ten min at room temperature, then scaled to three portions for 120g each, molded into round balls and allow rest for another 10 min. Then put in pans and transferred into the fermentation cabinet for 45 min. The fermentation dough's were then baked in Simon Rotary baking oven at 250°C for 15 min.
2.6. Bread Physical Properties
The weight of the loaf bread was taken using a digital balance. The loaf bread volume was determined by the seeds displacement method according to Pyler[8]. The loaf was placed in container of known volume into which small seeds (millet seeds) were run until the container was full. The volume of seeds displaced by the loaf was considered as the loaf bread volume. The specific volume of loaf was calculated according to AACC method[7] by dividing volume by weight.
2.7. Sensory Evaluation of the Loaf Bread
The bread samples were sliced with electric knife and prepared for sensory evaluation in same day. The sensory attributes (aroma, taste, crumb texture, crumb color, crumb uniformity, general acceptability) was carried out by ten semi trained panelists. The surrounding conditions were kept the same all through the panel test. The performance of judges towards these products was tested using hedonic scale, whereby ten panelists were selected and the tests were conducted in the Quality Control Laboratory of the Food Science and Technology Department, Faculty of Engineering and Technology, University of Gezira. The samples were presented so that each sample had an equal chance to be tested first, second or last. The result obtained by the panelists was converted to scores ranging from like extremely (9) to dislike extremely (1)[9]. The surrounding conditions were kept the same all through the panel test.
2.8. Statistical Analysis
The analysis of variance was performed to examine the significant effect in sensory attributes assessed. Duncan Multiple Range Test was used to separate the means.
3. Results and Discussion
3.1. Gluten Quality and Quantity
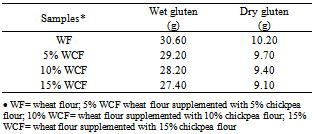
Gluten quality of dough prepared from wheat flour and that supplemented with chickpea flour is presented in Table (1).Table (1). Gluten test of wheat flour and wheat flour supplemented with chickpea flour
 |
| |
|
The wet gluten content of wheat flour was found to be 30.60%, the incorporation with 5, 10, and 15% chickpea flour resulted in decreasing the amount of wet gluten gradually to 29.20, 28.20 and 27.40%, respectively. These results were in agreement with those of Kulkarni et. al.[10] who reported that the percentage of wet gluten ranged between 25.9-42%. There were significant differences (P≤0.05) in wet gluten. The dry gluten in wheat flour was 10.20%, the increase at levels of chickpea flour resulted in significant decrease (P≤0.05) in dry gluten to 9.70, 9.40 and 9.10% in the replacement of 5, 10 and 15% chickpea flour. There were significant differences in dry gluten content among the different samples. The gluten index for wheat flour gave the lowest result, while the incorporation at 10% gave the highest one; the gluten index was 94.80, 95.57, 98.07 and 97.80% in wheat flour and wheat flour supplemented with 5, 10 and 15%, respectively.
3.2. Falling Number
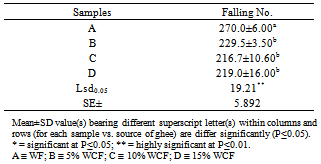
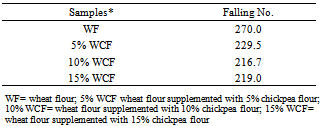
The falling number of wheat flour and wheat flour supplemented with chickpea flour is shown in Table (2).Wheat flour falling number had the highest value (270.00). The addition of chickpea flour at different levels to wheat flour decreased the falling number gradually and caused reduction to 229.5, 216.7 and 215.00 sec at 5, 10 and 15% level of supplementation, respectively. A significant difference (P≤ 0.05) was found among different samples.Table (2). Falling number of wheat flour and wheat flour supplemented with chickpea flour
 |
| |
|
3.3. Rheological Characteristics
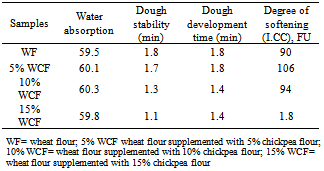
The rheological behavior of individual composite flour samples was evaluated by using Farinograph and Extensograph apparatus and the results are shown in Tables 3 and 4, respectively. The water absorption of dough prepared from wheat flour and with added various levels of chickpea flour ranged between 59.5-60.3%, from the current results there was a slight increase in water absorption in all supplemented samples compared with wheat flour, this increase may be refer to the higher water-holding capacity of chickpea flour. Dough stability decreased gradually with increasing the levels of chickpea flour from 1.8-1.1 min. Dough stability decreased gradually with increasing the levels of chickpea flour from 1.8-1.1 min, these results were in agreement with Singh et al.[11] who reported that, the dough stability decreased with blending chickpea flour.Table (3). Falling number of wheat flour and wheat flour supplemented with chickpea flour samples
 |
| |
|
Table (4). Farinograph parameters of wheat flour and wheat flour supplemented with chickpea flour
 |
| |
|
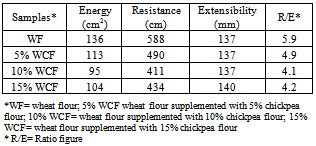
Dough development time of wheat flour was 1.8 decreased to 1.4 minutes. The degree of softening of wheat flour was 90 minutes. The supplementation with 5% chickpea flour resulted in the highest value of softening.Table (5). Extensograph parameters of wheat flour and wheat flour supplemented with chickpea flour
 |
| |
|
Extenograph results are shown in Table (5). The energy increased at 5% level of supplementation, then decreased gradually at 15% level compared with wheat flour. Resistance at 10% level increased at 135 min and decreased at 5 and 15% levels. Extensibility increased at 15% level of supplementation at 45, 90 and 135min. Resistance / extensibility ratio decreased at 5 and 15% levels at 45 min and at 10% level at 135 min. which similar to that of wheat flour.
3.4. Amino Acids Composition
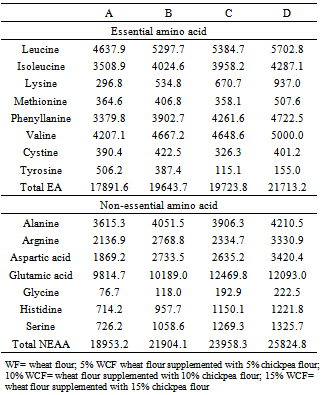
Table (6). Amino acids composition of different bread types
 |
| |
|
The amino acids composition of wheat flour with and without chickpea flour is shown in Table (6). From the results, it can be observed that, almost total amino acids were higher in supplemented bread than wheat flour bread. These results came in agreement with FAO/WHO[12] reference. Chickpea were rich in essential amino acids (Isoleucine, Lysine and Tryptophan) compared with the reference pattern while cereals such as wheat are low in it as stated by Patel and Rao[13]. Lysine acid noticed increased form 296.8 in wheat flour bread to 534.8, 670.7 and 937 mg/ 100gm in wheat flour supplemented with 5, 10 and 15%, respectively. Leucine increased from 4637.9 in wheat flour to 5297.7, 5384.7 and 5702.8 to wheat flour supplemented with chickpea flour of 5, 10 and 15% chickpea flour in wheat flour. These results are within the range reported by William et al.[14]. However, non essential amino acids also increased with added chickpea flour to wheat flour, for example Glutamic acid increased from 9814.7, 10189, 12469.8 and 12092 for wheat flour, 5, 10 and 15% chickpea flour, respectively.
3.5. Loaf Bread Specific Volume
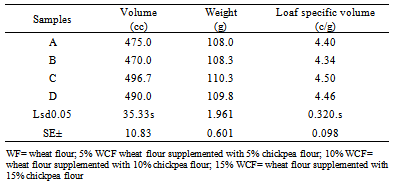
Specific volume of bread made from wheat flour with and without chickpea flour is shown in Table (7). Loaf bread volume ranged was 475.00, 470.00, 496.00 and 490.00 cm3 in control wheat flour bread and bread supplemented with 5, 10 and 15% levels of chickpea flour, respectively. The results showed that there was no significant difference among all samples. Loaf bread weight increased significantly with the addition of chickpea flour from 108.00 in control wheat bread to 108.3, 110.3 and 109.8 g in bread supplemented with chickpea flour, respectively. Specific volume of bread made from wheat flour was 4.40 and bread supplemented with chickpea flour was 4.34, 4.50 and 4.46. 5% level of chickpea flour had the lowest value whereas 10% level had the highest value. From the results obtained there was no significant difference (P≤0.05) are shown between wheat flour and wheat flour supplemented with chickpea flour.
3.6. Sensory Evaluation of Loaf Bread
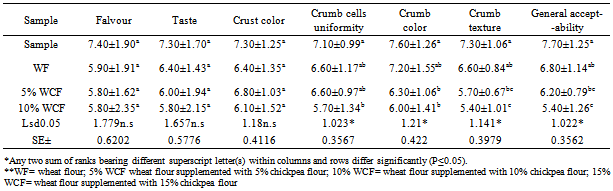
The sensory characteristics of bread samples are shown in Table (8). The aroma scores were 7.40, 5.90, 5.80 and 5.80 in control wheat bread, 5, 10 and 15% levels of chickpea, respectively. The control wheat bread had the highest scores, while 10% had the lowest scores. The results showed that no significant differences (P≤ 0.05) between all tested samples.The taste scores of bread were 7.30, 6.40, 6.00 and 5.80 in control wheat bead and 5, 10 and 15% bread supplemented with chickpea flour, it is clear that no significant differences (P≤ 0.05) was noticed among the samples were presented. The crust color scores of bread were 7.30, 6.40, 6.80 and 6.10 in control wheat bread, 5, 10 and 15% bread supplemented with chickpea flour, respectively. From the results presented it is clearly shown that the crust color scores decreased with the increase of levels of chickpea flour, and there were no significant differences (P≤ 0.05) among all samples.Table (7). Physical properties of loaf bread
 |
| |
|
Table (8). Sensory evaluation* of different bread samples**
 |
| |
|
The scores of bread crumb cell uniformity were found to be 7.10, 6.60, 6.60 and 5.70 in control bread and 5, 10 and 15% bread supplemented with chickpea flour, respectively. The lowest scores were obtained by 15% chickpea flour, while control bead gave the highest scores. No significant differences (P≤ 0.05) were found among the different samples. The scores of bread crumb color are found to be 7.60, 7.20, 6.30 and 6.00 in control bread and bread supplemented with 5, 10 and 15% chickpea flour, respectively. A higher crumb color scores were shown by bread made from wheat flour, 5% bread supplemented with chickpea flour at the highest scores compared with other samples. From these results there was no significant difference (P≤ 0.05) among the samples.The scores of crumb texture decreased significantly from 7.30 in control bread to 6.60, 5.70 and 5.40 for 5, 10 and 15% in bread supplemented with chickpea flour, respectively. From the results there was significant difference (P≤ 0.05) between all the samples.The scores of general acceptability are found to be 7.70, 7.80, 6.20 and 5.40 in control bread and bread supplemented with 5, 10 and 15% chickpea flour. 5% level had the highest scores compared with other samples. The results showed significant difference (P≤ 0.05) between the samples.
4. Conclusions
From present results, it could be conducted that: The addition of chickpea flour to wheat flour improved the nutritional value of bread produced. Deficiencies of essential amino acid particularly (Lysine) in wheat bread have been supplemented and their scores were increase in the bread. Bread with 5% chickpea flour was found to be more acceptable in sensory evaluation compared with wheat bread. More study should be done in the uses of chickpea flour in different products specially that food consumed by children because the chickpea has high protein and amino acid. Supplementation with 5% chickpea flour could be adopted in wheat bread making without affecting quality adversely.
ACKNOWLEDGEMENTS
This work forms part of a research carried out at the Department of Food Science and Technology, Gezira University, Sudan. The authors express their sincere thanks to all staff members, technicians and the colleagues for their assistance.
References
| [1] | Tsen. R.C. & Hoover, W.J. (1997). High protein bread from wheat fortified with full-fat soy flour. Cereal Chem., 50: |
| [2] | Coasta, G.E.; Queinz-Monici, K.; Reis, S. & Oliveira, A.C. (2006). Chemical composition dietary fiber and resistant starch contents of raw and cooked pea, common bean, chickpea and lentil legumes. Food Chem., 94:327-330. |
| [3] | Wang, N. Hatcher, D.W.; Tyler; R.T.; Toews, R. & Gawalko, E.J. (2010). Effect of cooking on the composition of beans (Phaseolus vulgaris L.) and chickpea (Cicer arietinum L.). Fd. Res. Int., 43:589-594. |
| [4] | Zhang, T.; Jiang, B. & Wang, Z. (2007). Gelation properties of chickpea protein isolate. Food Hydrocolloids, 21:280-286. |
| [5] | Sultan, W.J. (1976). Wheat and wheat products. In: Practical Baking. Avi Publishing Co., Westport, Connecticut, USA. Pp. 14-36. |
| [6] | I.C.C (1968). International Assoc. Cereal Chem. No. 114/1 Vienna, Austria. |
| [7] | A.A.C.C (2000). Approved Methods of American Association of Cereal Chemistry, 10th ed., St. Paul, MN., USA. |
| [8] | Pyler, E.J. (1973). Baking Science and Technology. Vol. 2. Siebel Publishing Company. Chicago, ILL |
| [9] | Larmond, E. (1982). Laboratory Methods for Sensory Evaluation of Food. Research Branch, Canada Department of Agriculture, Publication 1936 Ottawa, Canada. |
| [10] | Kulkarni, R.G.; J.G. & Kilp, K. (1987). Significance of gluten content as an index of flour quality. Cereal Chem., 64:1-3. |
| [11] | Singh, N, K. Harinder, K.S.; Sekhon, Bhupinder Kapur (1991). Study on the improvement of functional and baking properties of wheat-chickpea flour blends. Department of Food Science and Technology. Punjab Agriculture University, Ludhiana, India. |
| [12] | FAO/WHO/UNU (1985). Energy and protein requirement. Report of a Joint FAO/WHO/UNU Expert Consultation. WHO Tec. Rep. Ser. No. 724. Geneva, WHO |
| [13] | Patel, M., M. & G.V. Rao, (1995). Effect of untreated Roasted and Germinated Blcak Gram (Phaseolus mungo) Flours on the Physicochemical and Biscuits (Cookie) Making Characteristics of Soft Wheat Flour. J. Cereal. Sci., 22:285-291 |
| [14] | Williams, P.C. & Singh, U. (1987). The chickpea nutritional quality and the evaluation of quality in bread programs. Pages 329-356 in the chickpea (Saxena, M.C. and Singh, K.B. Eds.). |
 Abstract
 Reference
 Full-Text PDF
 Full-text HTML