-
Paper Information
- Previous Paper
- Paper Submission
-
Journal Information
- About This Journal
- Editorial Board
- Current Issue
- Archive
- Author Guidelines
- Contact Us
International Journal of Food Science and Nutrition Engineering
p-ISSN: 2166-5168 e-ISSN: 2166-5192
2013; 3(1): 7-11
doi:10.5923/j.food.20130301.02
Physicochemical and Sensory Properties of Traditionally and Laboratory Made Ghee (Samin) of the Sudan
 Abstract
 Reference
 Full-Text PDF
 Full-text HTML
Abdel Moneim E. Sulieman1, Mashear B. Mohammed2, Ali O. Ali2
1Department of Biology, Faculty of Science, University of Hail, Kingdom of Saudi Arabia
2Department of Food Science and Technology, Faculty of Engineering and Technology, University of Gezira , Wad Medani, Sudan
Correspondence to: Abdel Moneim E. Sulieman, Department of Biology, Faculty of Science, University of Hail, Kingdom of Saudi Arabia.
| Email: |  |
Copyright © 2012 Scientific & Academic Publishing. All Rights Reserved.
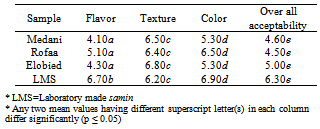
Samin is traditional cooking oil produced using the butter made from the milk of sheep , cow or goats.The objectives of the study was the determination of the physical, chemical and sensory characteristics of samin samples collected from local market, preparation of Samin at the laboratory level and evaluation its quality. The moisture content, acid value (mgKOH/g) , free fatty acids and peroxide value ranged 0.03 ±0.05% - 0.34+0.05%, 0.56 ± 0.0, - 1.94±0.17 (mgKOH/g), 0.28, -0.97±0.09%, 9.93 ± 0.23 - 2.60 ± 0.40 (mEq/kg) in the various samin samples. However, the saponification value, density, viscosity, melting point and refractive index of the different samin samples ranged 165.50-172.23(mgKOH/g), 0.925-913 g/cm³,0.519×10−3-0.335×10−3±0.02 pa.s, 38-37 Ċ and 1.4600-1.4582, respectively. The sensory evaluation revealed there was no-significant difference in texture, color, and overall acceptability of the samples, but there was significant difference (p ≤ 0.05) in flavour, between LMS sample and the other samples. It is highly recommended to improve production of samin under controlled hygienic conditions.
Keywords: Quality, Peroxide Value, Viscosity, Density, Refractive Index, Flavor
Cite this paper: Abdel Moneim E. Sulieman, Mashear B. Mohammed, Ali O. Ali, Physicochemical and Sensory Properties of Traditionally and Laboratory Made Ghee (Samin) of the Sudan, International Journal of Food Science and Nutrition Engineering, Vol. 3 No. 1, 2013, pp. 7-11. doi: 10.5923/j.food.20130301.02.
Article Outline
1. Introduction
- The health benefits of milk can be achieved from milk directly or its products such as cheese, butter, curd, clarified butter or ghee, dairy whitener, ice cream, cottage cheese or paneer, flavored milk, milk sweets etc. The US Department of Agriculture (USDA) has clearly mentioned in its Dietary Guidelines to include milk and milk products in the diet[1]. Milk fat is the major source of energy, since prehistoric times, man has satisfied his need for fat by eating foods from a variety of animal and vegetable sources. Among these foods milk from animals has been a prime source of nutrients. Traditionally milk fat has always had the highest economic value of any of the milk constituents, placing it at an economic disadvantage to other edible fats and oils products[2]. Samin is a traditional cooking oil most common in North African and Middle Eastern countries. It is produced using the butter made from the milk of sheep, cow or goats. Also called Ghee in Indian cuisine. Ghee is clarified butter that has been cooked longer to remove all the moisture, and the milk solids are browned (caramelized) in the fat and then strained out. This gives a rich nutty taste. Ghee has a longer shelf life, both refrigerated and at room temperature[3]. The people in Sudan use milk to make Samin but some of them use butter to make it. The production of Samin is found in many parts of Sudan and they use many ways of making it, some people put the fermented milk in a container and jerk it hard for a long time until they find Samin in the face of the container. Others put the milk on the fire and after that put it in a cool place, and they take the thick part from the top of the milk for some days after some days boiling it to obtain Samin. Samin is a nutritious food product that holds great cultural significance, particularly as an indicator of familial wealth in Sudan. The major use of Samin among those who produce it, namely the nomads, is as a topping for mulah , however many of these people simply drink Samin as it is, in small quantities such as a coffee cupful every morning. Samin is also given to children either pure or mixed with some food, sometimes pure Samin is used as a relish or sauce in the Northern and Nile Provinces, also the practice of topping coffee and tea with floating Samin is well known in the Sudan. Samin is even given to highly valued pet animals, such as horses. The objectives of the study include the determination of the physical, chemical and sensory characteristics of Samin samples collected from local market and to produce, preparation of samin at the laboratory level and evaluation of its quality.
2. Materials and Methods
2.1. Materials
- Thirty Samin samples were obtained from local markets in Medani, Elobied and Rofaa cities in Sudan (10 sample from each) during the period January – February 2011, and another sample was prepared at laboratory level. All of these samples were transferred to laboratories of the Department of Food Science and Technology, Faculty of Engineering and Technology, University of Gezira for analysis.
2.2. Preparation of samin at Laboratory Level
- For preparation of samin at laboratory level, a Robe inoculum (starter culture) was added to fresh cow milk and the fermentation process was allowed to proceed for overnight to produce fermented milk (Robe). Then the butter was separated by centrifugation. The collected butter was then boiled to remove excess water to obtain the laboratory made samin (LMS).
2.3. Physicochemical Properties of Samin
- The moisture content of various samples was determined according to the AACC methods[4]. The free fatty acids of the samples were determined according to the AOAC methods[5]. Five grams of Samin weighed into conical flask added 25 ml diethyl ether, 25 ml alcohol (ethanol) and 1 ml of phenolphthalein solution (1 percent) and carefully neutralize with 0.1 M sodium hydroxide shaking constantly until a pink colour is obtained. The acid value was calculated from the following equation:
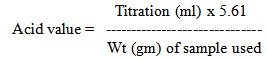 The Peroxide value and saponification number of the different samples were determined according to AOAC[6] methods, while the density, viscosity were determined according to Dardiri[7]. On the other hand, the melting point was determined according to AOCS[8] method. The Refractive index of the samples was determined by Refractometer.6
2.4. Fatty Acid Composition
- Fatty acid composition of the different samin samples was analyzed by gas liquid chromatography (GLC) using capillary column.Five drops from each sample was dissolved using 5 ml hexane and shaken, then 1 ml of esterification solution was added. The analyses were performed using a gas chromatography model GC 3380 with ADCB detector and coupled to a 3396 H-p integrator and a 50-m fused silica capillary column of 0.25 mm internal diameter, coated with cyanopopyl- polysiloxane as stationary phase. Cp-Sil 88 of (Chromopack) was used. The majority of analyses were performed operating under isothermal conditions. The chromatographic conditions were:
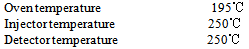
 Identification of chromatographic peaks was carried out by comparison of their retention times using appropriate standards of fatty acid methyl esters.
 2.5. Sensory Analysis
- Samin samples were subjected to sensory evaluation (Hedonic scale) using 15 panelists. The panelists were asked to assess each sample for texture, flavor, color and overall acceptability using a questionnaire designed by the Department of Food Science and Technology. All analysis took place in a room free from distributing noises, with uniform intensity levels of lighting; fresh air was provided with water for rinsing. All those conditions were equally used for all tests. The order of presentation of samples was randomized and the samples were given codes before being tested, the results were recorded and analyzed.
2.6. Hedonic Test
- Ten judges were selected to express their preference of Samin sample. The samples were presented so that each sample had equal chance to be tasted first or second. The results obtained by the panelists were converted to MSTAT [9]. The scores were subjected to statistical analysis.
2.7. Statistical Analysis
- The scores obtained by the panelists in hedonic test were subjected to analysis of variance at 5% level according to MSTAT[9], to determine whether there were significant different means for each variable; (F-test) was used.
3. Results and Discussion
3.1. Physicochemical Properties of Samin Samples
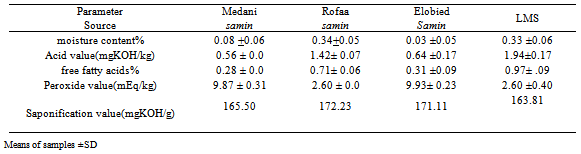
- The physicochemical properties of samin samples is presented in Table (1). The moisture contents of Medani, Rofaa, Elobied and laboratory made samin (LMS) samples were 0.08+0.06%, 0.34+0.05%, 0.03±0.05% and 0.33 ±0.06%, respectively. These values are within the recommended Codex Standards for ghee (0.3%), however, Bille and Ngwira[10] also found that the moisture content of traditional ghee in Namibia ranged between 0.2 – 0.46% .Acid value of Medani, Rofaa, Elobied and LMS samples was 0.56 ± 0.0, 1.42 ± 0.07, 0.64 ± 0.17 and 1.94±0.17, respectively. The highest value was found in LMS sample, while the lowest value was reported in Medani’s samples. The value of acid of samin could be increased as a result of contamination during its preparation or handling. The presence of lipase and oxygen naturally found in the milk may have already attacked and hydrolized the butter fat butterfat globules in the milk of all species. It can be separated to make butter. The nutritional value and the price of milk are judged on, among other things, the butterfat content of the milk. into free fatty acids (rancid) and oxidized flavours (cardboard flavour) before butter was boiled into ghee (Bille and Ngwira, 2001). The free fatty acids of Medani, Rofaa, Elobied and LMS samples were 0.28 ± 0.0, 0.71 ± 0.06, 0.31 ±0.09 and 0.97± .09 respectively. The Peroxide values were 9.87 ± 0.31, 2.60 ± 0.0, 9.93 ± 0.23 and 2.60 ± 0.40 for Medani, Rofaa, Elobied and LMS samples, respectively. Okullo[11] found that the peroxide values of ghea butter in Pader ,Lira, Katakwi and Arua districts were 2.25±0.35, 2.20±0.42 ,2.10±0.14 and 2.50±0.71, respectively. The peroxide value in Medani and Elobied sample was very high according to these results. The increase in peroxide value could be attributed to the oxidation of fatty acids due to several factors like high temperature, packing in containers impermeable to light and loose lock in addition to poor storage and poor handling[12].The saponification value has been useful screening test for quality control and characterizing types of fats and oils. The Saponification values of Medani, Rofaa, Elobied and LMS samples were 165.50, 172.23, 171.11 and 163.81, respectively. The obtained values were lower than that reported by ƠBrien[2], who found that the saponification value of milk fat ranged from 210 to 250. It is known that fats containing short-chain fatty acids have higher saponification value than those with longer chain fatty acids., according to their physical properties obtained, samin can be classified as a semi solid fat.
3.2. Fatty Acid Composition
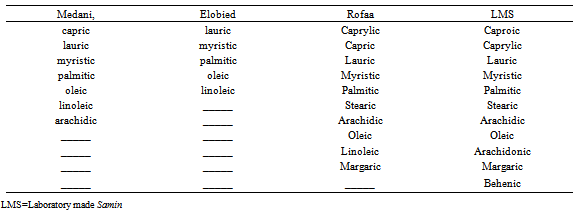
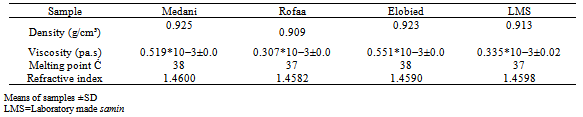
- Fatty acids mostly originate from the hydrolysis of the milk fat. The lipase responsible for their production probably originates from the milk itself[13]. Results of fatty acids composition of collected sample are presented in Table 2. The fatty acids composition of all samples varied but the common fatty acids found in samples were lauric (C12:0), myristic (C14:0), oleic (C18:1) and palmitic acid (C16:0). Palmitic acid is one of the major saturated fatty acids it raises serum cholesterol, while stearic acid dos not. The saturated fatty acids found in Medani sample were capric, lauric, myristic, palmitic and arachidic while unsaturated fatty acids were oleic and linoleic, while saturated fatty acids found in Elobied sample were lauric, myristic and palmitic and unsaturated fatty acids were oleic and linoleic. The saturated fatty acids found in Rofaa sample were caprylic, capric, lauric, myristic, palmitic, stearic, arachidic and margaric but unsaturated fatty acids were oleic and linoleic, also the unsaturated fatty acids found in LMS sample were oleic and arachidonic while the saturated fatty acids found in the sample was caproic, caprylic, lauric, myristic , palmitic, stearic, arachidic, margaric and behenic. The fatty acids composition can be influenced to a limited extent by the fodder of the animals. Milk fats contain remarkable amount of short chain fatty acids ranging from C4 to C10[13]The results of density, viscosity, melting point and refractive index of the various samin samples are presented in Table (3). The density of Medani, Rofaa, Elobied and LMS samples were 0.925, 0.909, 0.923 and 0.913, respectively. The obtained results are in close agreement to those reported by Erickson[14] for the density value of edible animal fat (lard) which ranged from 0.896 to 0.904.
|
|
|
3.3. Sensory Evaluation
|
4. Conclusions
- The research was carried out to assess the chemical and physical characteristics of samin samples obtained from selected markets in the Sudan and to compare them with those of laboratory made samin (LMS). The results of the chemical composition of different samin samples indicated that most of the chemical components of the samples were relatively lower when compared with those of laboratory made samin (LMS) sample. On the other hand, the physical characteristics of different samin samples were similar to those found in the laboratory made samin (LMS) sample; and also these physical characteristics of samples were within the range of the study carried out. The sensory analysis indicates that all types of samin were accepted by panelists. Most panelists preferred the samin due to its color, appearance and texture not due to flavor. The study indicates that samin which is semi solid product has a high nutritive value.It is highly recommended to improve the technology of samin preparation under hygienic conditions and using good manufacturing practices..