-
Paper Information
- Next Paper
- Paper Submission
-
Journal Information
- About This Journal
- Editorial Board
- Current Issue
- Archive
- Author Guidelines
- Contact Us
International Journal of Food Science and Nutrition Engineering
p-ISSN: 2166-5168 e-ISSN: 2166-5192
2013; 3(1): 1-6
doi:10.5923/j.food.20130301.01
Flavonol Rates of gosseberry Fruits Physalis peruviana Determined by HPLC Through the Optimization and Validation of the Analytic Method
 Abstract
 Reference
 Full-Text PDF
 Full-text HTML
Silvana Licodiedoff1, Luciano Andre D. Koslowski2, Rosemary H. Ribani1
1Department of Food Engineering, Universidade Federal do Paraná, Curitiba PR Brazil, POB 19011
2Department of Chemical Engineering, Universidade da Região de Joinville, Joinville SC Brazil, POB 246
Correspondence to: Silvana Licodiedoff, Department of Food Engineering, Universidade Federal do Paraná, Curitiba PR Brazil, POB 19011.
| Email: |  |
Copyright © 2012 Scientific & Academic Publishing. All Rights Reserved.
Vitamins and flavonols occur naturally in foods consumed daily and highly common in diets, including fruit of Physalis peruviana. The aim of this study was to analyze the levels of flavonoids determined by HPLC through the optimization and validation of analytical methodology using central composite rotational design (DCCR) to extract observing the effects of HCl concentration and hydrolysis time at three levels. The concentration of 8 mol. L-1 HCl for 90 minutes corresponds to the best condition extraction and hydrolysis of rutin, myricetin and kaempferol, with a content of 78.64 and 4.67, 2.38 μ g. 100 g-1, to the fruit Physalis peruviana-RS and 22.36, 0.99, 1.35 μ g. 100 g-1 to Physalis peruviana-PR, respectively.
Keywords: Flavonols, Optimization, Validation, Fruit
Cite this paper: Silvana Licodiedoff, Luciano Andre D. Koslowski, Rosemary H. Ribani, Flavonol Rates of gosseberry Fruits Physalis peruviana Determined by HPLC Through the Optimization and Validation of the Analytic Method, International Journal of Food Science and Nutrition Engineering, Vol. 3 No. 1, 2013, pp. 1-6. doi: 10.5923/j.food.20130301.01.
Article Outline
1. Introduction
- Physalis peruviana is a small round fruit with pulp, color dark orange, within a calyx, featuring a set of vitamins and flavonols ([1],[2],[3]).Flavonoids comprise the largest group of phenolic pigments in fruits, vegetables and grain used by the chemical, pharmaceutical and food industries[4-13]. Identified flavonoids have anti-oxidant, anti-allergic, anti-inflammatory, antiviral, vase-protecting and anti-hepatotoxic activities ([5],[6],[7],[8],[9]) related to oxidation processes that vary according to the matrix´s phenolic contents ([10],[23],[8],[30]).The above-mentioned compounds occur in fruit in the form of glycosides or aglycons, characterized as diphenylpropane with 15 carbon atoms arranged in two benzenic rings, linked to a pyran ring and divided into classes according to their chemical qualities ([11],[12]). Several combinations may be formed with hydroxyls and methoxyls on such structures. The following main classifications may be mentioned: flavones, flavanones, flavanols, anthocyanidins, isoflavones and flavonols.The latter has been mainly analyzed with regard to quercetin, myricetin and kaempferol as natural anti-oxidants found in fruits and vegetable ([13],[14],[15]).Owing to the high number of glycosides in each compound, the glycosylated form (linked to sugar molecules) makes difficult the determination of quantity. Hydrolysis is the most practical method for the release of aglycons whose glycosides are normally hydrolyzed with acidified methanol in HCl or ethanol, acetone or their mixture or combinations ([16],[17],[18]).Time, temperature, extraction method, acid concentration, sample size, processing conditions, the presence ofinterfering compounds such as wax, fat, chlorophyll, are factors that affect and differentiate themselves for each phenolic compound of the plant (diversified vegetal materials that interact among themselves) which trigger the formation of insoluble complexes ([19],[18],[20],[21],[4], [22]). High efficient liquid chromatography is the technique used to detect flavonols, coupled to the optimization and validation of analytic methods due to differences in the flavonoids matrix. The importance of optimization coupled to the Response Surface Methodology is highlighted ([23],[24]). It aid determine the effects among factors and interactions through the relationship between response and variables for the optimization of products or processes ([25],[26],[27], [28]).The goal of this study aimed at establishing the best chromatographic conditions for the separation and determination of flavonol rates by optimization, validation and extraction by hydrolysis, with regard to the fruit of Physalis peruviana.
2. Raw Materials
2.1. Samples
- Calyx-enveloped fruit from the region of Vacaria/RS Brazil (Italbraz®) and Ponta Grossa/PR Brazil were transported and kept at 7.0 ± 0.5℃ until analysis. Selected color dark orange and big-sized fruits were separated from the calyx and extracted with organic solvent to compare data and analyze the effects of climate, soil and planting on flavonol contents.
2.2. Reagents and Standards for Chromatography
- Rutin, myricetin, quercetin and kaempferol standards in current assays were obtained from Sigma Chemicals Co.® (St. Louis, USA). Standard stock solutions were prepared by dissolving each flavonoid in methanol at chromatography degree at a concentration of approximately 200 μg. mL-1, at –18℃, and protected from light. Stock solutions had a higher than two months stability under the above conditions.Chromatograph degrees methanol and analytic degree formic acid were obtained from Merck (Darmstadt, Germany). Water for samples and movable phases was purified in Milli-Q, Millipore system (Bedford, USA), filtered with polytetrafluoroethylene filters (PTFE), from Millipore®, with 0.45 μm diameter pores.
2.3. Chromatographic Parameters
- Liquid chromatograph Agilent 1200 Series, G1311A, controlled by Software EZChrom Elite, with automatic liquid sampler (ALS), diode arrangement detector (DAD), quaternary pump, Zorbax Eclipse XDB-C18 column (4.6 x 150 mm, 3 μm) was employed for the separation of compounds.Spectra were obtained at 200-600 nm in DAD with regard to the respective retention times of injected standards. Identification of phenolic compounds occurred at 370 nm by external standardization. Discharge of the movable phase was 0.2 mL. min-1 with an injection volume of 5 μL.A mixture of rutin, myricetin and kaempferol standards, dissolved in methanol, provided the best separation condition of flavonols for the Physalis fruit by employing different gradients of movable aqueous phases in the tests, coupled to solvent organic methanol acidified with 0.3% acetic or formic acid. The best separation condition for standards was adjusted until the flavonols´ chromatogram resolution in the matrix under analysis was obtained by hydrolyzed extracts of samples with or without the addition of standards.
2.4. Flavonol Extraction Conditions
2.4.1. Extraction with Organic Solvent
- Since Physalis may contain flavonol glycosides, either coupled or polymerized, extraction efficiency of these compounds was verified with acetone or methanol by employing 15.0 g of the homogenized fruit with 0.02 g of anti-oxidant ascorbic acid, fragmented in a pestle till disintegration, with different percentages of the aqueous solutions of organic solvents in ultrasound for 60 minutes. Extract was filtered in a 50 mL volumetrick flask and filtered a second time in Millipore filter 0.45 μm diameter (PTFE) for later injection in the chromatograph.
2.4.2. Flavonol Extraction by Hydrolysis
- Rotational center composite design (RCCD) was used to find the best extraction and hydrolysis condition without producing the degradation of flavonoids in Physalis. Extraction started with the disintegration of 15.0 g of the fruit by 0.02 g ascorbic acid in the preparation of the sample with the addition of 10 mL of HCl in molar concentrations at three codified levels (-1, 0 and 1) and 25 mL with methanol. The resulting solution formed different final molar concentrations of HCl in an aqueous solution at 50% methanol (v/v). Extracts were reflowed at 90℃ during three codified periods (-1, 0 and 1), cooled and volume completed to 50 mL with methanol. Each sample was filtered with paper filter and then in Millipore Filter 0.45 μm diameter, prior to injection in chromatograph.
2.4.3. Planning of Experiment
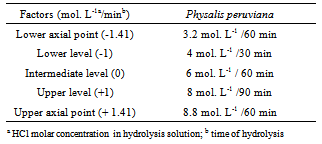
- RCCD comprising 12 randomly performed experiments was employed to establish the best experimental condition for the optimization of flavonols´ extraction and hydrolysis. Table 1 shows the factors used.
|
2.4.4. Validation of Method
- Standard solutions and analytic curves were performed in triplicate with five different concentrations[29], foregrounded on bands calculated from the fruit rates.Method preciseness was prepared with sample triplicates within extraction and hydrolysis conditions of flavonols for three strength levels from stock solutions of standards 70 μg. mL-1 (myricetin and kaempferol), 150 μg. mL-1 (rutin) and 200 μg. mL-1 (quercetin), homogenized and filtered in Millipore filter 0.45 μm diameter, prior to injection in the chromatograph.Preciseness was achieved by repeating the seven samples according to the best conditions established for the methodology.The linearity of the method under analysis was verified by the coefficients of determination of analytic curves of each flavonols standard. Detection (DL=3.3 SD/S) and quantification (QL = 3 DL) limits were defined in which SD was the standard deviation of control and S the analytic curve inclination corroborated by the injection of solutions prepared according to the data calculated above.
3. Results and Discussion
3.1. Chromatographic Conditions
- Chromatographic separation started with column Zorbax Eclipse XDB-C18 (4.6 x 150 mm, 5 μm), injection volume 20 μL, discharge 1.0 mL min-1 and several compounds of the movable phase water:methanol, acidified with 0.3% acetic acid, which was only slight efficacious to separate quercetin from kaempferol, as described in the reference literature[21]. The movable phase was acidified up to 0.45% of acetic acid to improve chromatograph conditions, even though result failed to separate the component elements. Acidification at 0.45% occurred when formic acid was introduced and the separation of flavonols was performed, albeit with asymmetry of peaks. Gradient started with 80:20 (water: methanol) and maintained for 5 min; it reached 58:42 at 7 min; it was kept until 25 min and returned to 80:20 at 26 min, remaining thus until 36 min, at linear gradient.Efficacious separation occurred when a new column Zorbax Eclipse XDB-C18 (4.6 x 150 mm, 3 μm diameter of the particle) was used, with injection volume of 5 μL and discharge at 0.2 mL min-1, for gradient water:methanol (acidified with 0.45 % formic acid). Start proportion was 80:20 maintained for 5 min and reached 48:52 at 6 min; it was maintained thus till 29 min and changed for 28:72 at 30 min up to 40 min; proportion returned to 80:20 at 43 min and remained thus till 60 min for the re-equilibrium of the column prior to the next injection. The elution of the flavonols rutin, myricetin, quercetin and kaempferol occurred respectively at 30.05; 38.40; 44.90 and 49.20 min.
3.2. Extraction and Hydrolysis of Flavonols
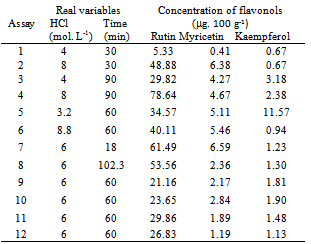
- Samples were prepared with different concentrations of water solution and different types of methanol and acetone organic solvent so that extraction and hydrolysis could be defined. Table 2 shows the results of the experiments.
|

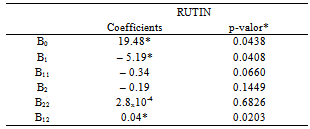
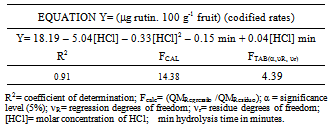
3.3. Optimization of Flavonols´ Extraction and Hydrolysis
- Optimization conditions for extraction and hydrolysis of flavonol rates in Physalis peruviana-RS ranged between 5.33 and 78.64 μg. 100 g-1 for rutin; between 0.41 and 6.59 μg. 100 g-1 for myricetin; between 0.67 and 11.57 μg. 100 g-1 for kaempferol, as shown in Table 3.
|
|
|
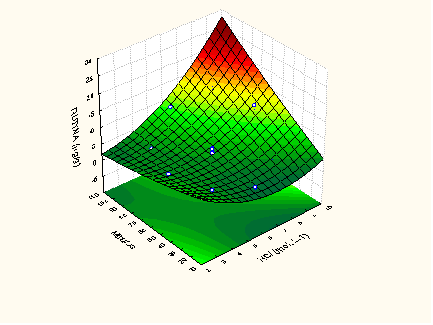 | Figure 1. Response surface to determine rutin in Physalis peruviana-RS |
3.4. Validation of Methodology
- So that methodology could be validated, analytic curves passed through the starting point and showed linearity for the concentration bands under analysis (Table 6), according to coefficients of determination which were higher than 0.987.Detection limits (DL) for rutin, myricetin, quercetin and kaempferol were 3.69; 0.56; 0.35 and 0.62 μg. 100 g-1, respectively.
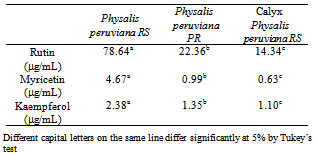
3.5. Flavonol Contents in the Fruit of Physalis peruviana-RS by Validated Methodology
- The best condition for extraction/hydrolysis comprises the use of HCl 8 mol. L-1 for 90 minutes for the ideal chromatograph separation, for the fruit variety Physalis peruviana-RS and its calyx and for Physalis peruviana-PR, whose rutin, myricetin and kaempferol rates are described in Table 7.
|
4. Conclusions
- Highest flavonol rates in Physalis peruviana-RS occurred with column Zorbax Eclipse XDB-C18 (3 μm), with movable phase flow 0.2 mL. min-1 and injection volume 5 μL.The best chromatograph separation occurred when acidified water and methanol movable phase was employed with formic acid 0.45% (v/v) with linear gradient in the movable phase proportion starting with 80:20 (water: methanol), maintained for 5 minutes, until 48:52 at 6 minutes and remaining thus up to 29 minutes. Proportion 28:72 was reached at 30 minutes and maintained until 40 minutes, returned to 80:20 at 43 minutes; and conserved until 60 minutes for the recondition of the column.Optimization of flavonol extraction and hydrolysis indicated molar concentration HCl 8 mol. L-1 and hydrolysis time of 90 min as the best condition for the flavonol rutin. The best separation condition provided rates of the flavonols rutin, myricetin and kaempferol 78.64; 4.67 and 2.38 μg. 100 g-1, respectively for the fruit of Physalis peruviana-RS, and rates 22.36; 0.99 and 1.35 μg. 100 g-1 for Physalis peruviana-PR from the region of the Paraná, Brazil.Physalis calyx was only employed for the sample´s pre-vious assessment. The best chromatograph condition for extraction and hydrolysis (of the fruit of Physalis peruviana) resulted in concentrations 14.34; 0.63 and 1.10 μg. 100 g-1, respectively for rutin, myricetin and kaempferol in the Physalis calyx.
ACKNOWLEDGEMENTS
- The authors would like to thank the Coordination for the Upgrading of Personnel in Higher Education (Capes) and ITALBRAZ® for providing the fruits.
References
| [1] | Velasquez, H.J.C., Giraldo, O.H.B. Arango, S.S.P. (2007). Estudio preliminar de la resistencia mecánica a la fractura y fuerza de firmeza para fruta de uchuva (Physalis peruviana L.) Revista Facultad Nacional de Agronomía, 60, 3785 - 3796. |
| [2] | Rodrigues, E., Rockenbach, I.I., Cataneo, C., Gonzaga, L.V., Chaves, E.S., Fett, R. (2009). Minerals and essential fatty acids of the exotic fruit Physalis peruviana L. Ciência e Tecnologia de Alimentos, 29, 642 - 645. |
| [3] | Muniz, J., Kretzschmar, A.A., Rufato, L., Pelizza, T.R., Marchi, T., Duarte, A.E., Lima, A.P.F., Garanhani, F. (2011). Sistemas de condução para o cultivo de Physalis no planalto catarinense. Revista Brasileira de Fruticultura, 33, 830-838. |
| [4] | Sobrinho, T.J.S.P., Gomes, T.L.B., Cardoso, K.C.M., Amorim, E.L.C. (2010). Otimização de metodologia analítica para o doseamento de flavonoides de Bauhinia cheilantha (Bongard) Steudel. Química Nova, vol. 33, pp. 288-291. |
| [5] | Heim, K.E., Tagliaferro, A.R., Bobilya, D.J. (2002). Flavonoid antioxidants: chemistry, metabolism and structure-activity realtionships. Journal of Nutritional Biochemistry, 13, 572-584. |
| [6] | Yao, L.H.; Jiang, Y.M.; Shi, J.; Tomás-Barberán, F.A.; Datta, N.; Singanusong, R.; CHEN, S.S. (2004). Flavonoids in food and their health benefits. Plant Foods for Human Nutrition, 59, 113-122. |
| [7] | Veitch, N.C.; Grayer, R.J. (2008). Flavonoids and their glycosides, including anthocyanins. Natural Product Reports, 25, 555-611. |
| [8] | Campos, F.M.; Martino, H.S.D.; Sabarense, C.M.; Pinheiro-Sant’ana, H.M. (2008). Estabilidade de compostos antioxidantes em hortaliças processadas: uma revisão. Alimentos e Nutrição, 19, 481-490. |
| [9] | Jáuregui, A.M M.; Ramos-Escudero, D.F.; Alvarado-Ortiz, C.U.; Castañeda, B.C. (2007). Evaluación de la capacidad antioxidante y contenido de compuestos fenólicos en recursos vegetales promisorios. Revista de la Sociedad Química del Perú, 73, 142-149. |
| [10] | Scalzo, J.; Politi, A.; Pellegrini, N.; Mezzetti, B.; Battino, M. (2005). Plant genotype affects total antioxidant capacity and phenolic contents in fruit. Nutrition, 21, 207–213. |
| [11] | Angelo, P.M.; Jorge, N. (2007). Compostos fenólicos em alimentos – Uma breve revisão. Revista Instituto Adolfo Lutz, 66, 232-240. |
| [12] | Ignat, I.; Volf, I.; Popa, I.V. (2011). A critical review of methods for characterisation of polyphenolic compounds in fruits and vegetables. Food Chemistry, 126, 1821-1835. |
| [13] | Karakaya, S. (2004). Bioavailability of Phenolic Compounds. Critical Reviews in Food Science and Nutrition, 44, 453-64. |
| [14] | Moon, Y.J.; Wang, X.; Morris, M.E. (2006). Dietary flavonóides: Effects on xenobiotic and carcinogen metabolism. Toxicology in vitro, 20, 187-210. |
| [15] | Broinizi, P.R.B.; Andrade-Wartha, E.R.S.; Silva, A.M.O.; Novoa, A.J.V.; Torres, R.P.; Azeredo, H.M.C.; Alves, R.E.; Mancini-Filho, J. (2007). Avaliação da atividade antioxidante dos compostos fenólicos naturalmente presentes em subprodutos do pseudofruto de caju (Anacardium occidentale L.). Ciência e Tecnologia de Alimentos, 27, 902-908. |
| [16] | Antolovich, M.; Prenzler, P.; Robards, K.; Ryan, D. (2000). Sample preparation in the determination of phenolic compounds in fruits. Analyst, 125, 989–1009. |
| [17] | Zadernowski, R., Naczk, M., Nesterowicz, J. (2005). Phenolic acid profiles in some small berries. Journal of Agriculture and Food Chemistry, 53, 2118–2124. |
| [18] | Naczk, M.; Shahidi, F. (2006). Phenolics in cereals, fruits and vegetables: Occurrence, extraction and analysis. Journal of Pharmaceutical and Biomedical Analysis, 41, 1523–1542. |
| [19] | Kallithraka, S.; Garcia Viguera, C.; Bridle, P.; Bakker, J. ( 1995). Survey of solvents for the extraction of grape seed phenolics. Phytochemical Analysis, 6, 265-267. |
| [20] | Romanik, G.; Gilgenast, E.; Przyjazny, A., Kaminski, M. (2007). Techniques of preparing plant material for chromatographic separation and analysis. Journal of Biochemical and Biophysical Methods, 70, 253 – 261. |
| [21] | Hoffmann-Ribani, R; Rodriguez-Amaya, D.B. (2008). Otimização de método para determinação de flavonóis e flavonas em frutas por cromatografia líquida de alta eficiência utilizando delineamento estatístico e análise de superfície de resposta. Química Nova, 31, 1378-1384. |
| [22] | Biesaga, M. (2011). Influence of extraction methods on stability of flavonoids. Journal of Chromatography A, 18, 2505–2512. |
| [23] | Alasundram, N., Sundram, K., Samman, S. (2006). Phenolics compounds in plants and agri-industrial by-products: antioxidant activity, occurrence, and potential uses. Food Chemistry, 99, 191-203. |
| [24] | Huber, L.S., Rodriguez-Amaya, D.B., Rodrigues, M.I. (2007). Otimização e validação de metodologia analítica para determinação de flavonóis e flavonas por CLAE em hortaliças. Revista Instituto Adolfo Lutz, 66, 143- 152. |
| [25] | Rodrigues, M.I., Iemma, A.F. Planejamento de Experimentos e Otimização de Processos. 2nd ed., Cárita Editora, Campinas, 2009. |
| [26] | Bas, D., Boyaci, I.H. (2007). Modeling and optimization I: usability of response surface methodology. Journal of Food Engineering, 78, 836-845. |
| [27] | Yang, B., Liu, X., Gao, Y. (2009). Extraction optimization of bioactive compounds (crocin, geniposide and total phenolic compounds) from Gardenia (Gardenia jasminoides Ellis) fruits with response surface methodology. Innovative Food Science and Emerging Technologies, 10, 610–615. |
| [28] | Bayod, L.F., Salazar, R.F.S., Alcântara, M.A.K., Nascimento, L.F.C.; Izário, H.J., Silva, M.B. (2012). Methodological Validation for the Determination of Ca, Cr, Mg and Mn in Umbilical Cord and Maternal Blood (City of Vale do Paraíba, São Paulo, Brazil). International Journal of Food Science and Nutrition engineering, 4, 44-53. |
| [29] | Ribani, M., Bottoli, C.B.G., Collins, C. H., Jardim, I. C. S. F., Melo, L.F.C. (2004). Validação em métodos cromatográficos e eletroforéticos. Química Nova, 27, 771- 780. |
| [30] | Rockenbach, I.I., Rodrigues, E., Cataneo, C., Gonzaga, L.V., Lima, A., Mancini-Filho, J., Fett, R. (2008). Ácidos fenólicos e atividade antioxidante em fruto de Physalis peruviana L. Revista Alimentos e Nutriução, 19, 271-276. |
| [31] | Vázquez, G., Fontenla, E., Santos, J., Freire, M.S., González-Álvarez, J., Antorrena, G. (2008). Antioxidant activity and phenolic content of chestnut (Castanea sativa ) shell and eucalyptus (Eucalyptus globulus) bark extracts. In-dustrial Crops and Products, 28, 279-285. |
| [32] | Calabro, M.L., Galtieri, V., Cutroneo, P., Tommasini, S., Ficarra, P., Ficarra, R. (2004). Study of the extraction procedure by experimental design and validation of a LC method for determination of flavonoids in Citrus bergamia juice. Journal of Pharmaceutical and Biomedical Analysis, 35, 349 – 363. |