-
Paper Information
- Next Paper
- Paper Submission
-
Journal Information
- About This Journal
- Editorial Board
- Current Issue
- Archive
- Author Guidelines
- Contact Us
International Journal of Food Science and Nutrition Engineering
p-ISSN: 2166-5168 e-ISSN: 2166-5192
2012; 2(6): 101-107
doi: 10.5923/j.food.20120206.01
Rheological and Functional Properties of Soy-Poundo Yam Flour
 Abstract
 Reference
 Full-Text PDF
 Full-Text HTML
Malomo Olu, Ogunmoyela O. A. B., Adekoyeni O. O., Jimoh O., Oluwajoba S.O, Sobanwa M. O.
College of Food Sciences Bells University of Technology, Ota P.M.B. 1015, OTA Ogun State, Nigeria
Correspondence to: Malomo Olu, College of Food Sciences Bells University of Technology, Ota P.M.B. 1015, OTA Ogun State, Nigeria.
| Email: |  |
Copyright © 2012 Scientific & Academic Publishing. All Rights Reserved.
The nutrition of the people of developing countries is a major public health issue which has challenged breeders to enhance the nutritional quality of preferred and staple crops such as yam. This project therefore aimed at evaluating the effect of soy flour enrichment on the rheological properties of poundo yam flour. The yam flour was substituted with soy flour at varying proportions (100:0; 90:10; 80:20; 70:30) with the aim of producing a more nutritionally balanced product (poundo yam). Reconstituted poundo yam dough was prepared from all the flour samples and was evaluated for consumer acceptability. Data obtained showed that the functional properties i.e. swelling power (2.70-3.34%) and solubility (16.16-20.23%) increased significantly (P≤0.05) with increasing substitution levels of soybean with a corresponding decrease in the bulk density (0.84-0.71) and dispersibility (60.50-52.50) and water absorption capacity (267.76-260.62%) as the substitution levels of soybean increases. The substitution of soy flour into yam flour affected the rheological properties of yam flour; the rate of water absorption of the yam flour decreased as soy flour substitution levels increased. Also, the dough stability time of the enriched flours was higher than that of the yam flour. The 30% enrichment level had the highest dough consistency (283FU). The extensibility of the enriched flour blends increased upon increasing levels of soy flour substitution. The 20% flour blend had the highest resistance to highest resistance to extension. Soybean flour substitution also increased the amino acid profile of the poundo yam. The poundo yam made from this flour blends also varied in texture, aroma, taste and colour. Apart from adding value and varieties to poundo yammeal due to its colour and textural improvement, enriching yam flour with soybean flour at 10% level would also reduce the problem of food security especially among children in the sub Sahara region of Africa where malnutrition due to protein deficiency is prevalent.
Keywords: Poundo Yam, Soybean Flour, Farinograph, Extensograph, Bulk Density, Swelling Power, Dispersability, Substitution, Enrichment
Cite this paper: Malomo Olu, Ogunmoyela O. A. B., Adekoyeni O. O., Jimoh O., Oluwajoba S.O, Sobanwa M. O., "Rheological and Functional Properties of Soy-Poundo Yam Flour", International Journal of Food Science and Nutrition Engineering, Vol. 2 No. 6, 2012, pp. 101-107. doi: 10.5923/j.food.20120206.01.
Article Outline
1. Introduction
- In Nigeria, there have been several attempts at overcoming the nutritional of cassava based diets by fortifying with soya bean, which has high protein content of good quality[1], ;[2]. The use of defatted, full fat soy flours and cowpea flour to increase the protein contents of yam have been explored[3];[4];[5];[6]. In addition,[7] have fortified yam flour with plantain and cassava flour in order to improve its viscosity and texture of yam flour paste. Various species of yam tubers among them are Dioscorea rotundata, Dioscorea alata and Dioscorea cayenensis have been processed into yam flour[8];[9];[10]; [11];[12];[13] and results showed that they are good raw materials for yam flour production. Results of previous studies on fortification of yam, cassava and plantain flours using soybean has shown that fortification improves nutritional quality of resulting meals, including Amala[7].However, fortification may also affect the functional and pasting characteristics of flour oriented foods[7];[14];[15]. Soybean has been recognized to be an ideal grain for meeting protein and energy requirement of both man and animal. Soybean is probably the world’s most valuable crop, used as feed by billions of livestock, as a source of dietary protein and oil by millions of people, and in the industrial manufacture of thousands of products. Soybean is such an extremely rich source of protein and fat, and such a good source of energy, vitamins and minerals[16]. Soybeans have great potential in overcoming protein-calorie malnutrition. Although soybean is not indigenous to Africa, it has received tremendous popularity as a cheap protein source in Nigeria[17].
2. Materials and Methods
2.1. Materials
- The yam tuber variety (Dioscorea rotundata) locally known as white yam and the soybean seeds (Glycine max) used were purchased from an open market source located in Ota Ogun state.
2.1.1. Equipment and Instruments Used
- 1. Oven 2. Weighing balance 3. Hammer mill. 4. Warring blender
2.2. Methods
2.2.1. Preparation of Yam Flour
- Yam flour was produced following the method described by[18]. The yam tubers were washed to remove sand, dirt and other adhering materials. The yam tubers were peeled sliced to 0.02mm thickness, after slicing they were deeped in water containing sodium metabisulphite so as to arrest the browning reaction and placed in a sieve to remove excess water after which they were cooked for 10mins at 100℃. The cooked yam were dried in an oven at 70℃ for 10hrs which was followed by milling using a hammer mill and the yam flour w was sieved, packaged in a Ziploc bag and stored in the freezer prior to analysis.[18]
2.2.2. Preparation of Soybean Flour
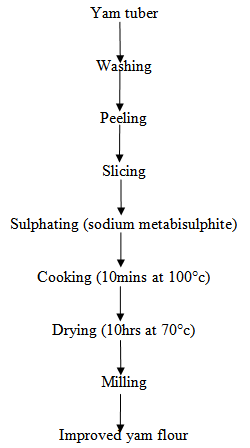 | Figure 1. Flowchart for the production of yam flour[18] |
2.2.3. Blend Formulation
- The yam flour and soybean flour were blended together using a warring blender at different ratios of 90:10, 80:20, and 70:30% of yam flour and soybean flour respectively. The flour blends were labelled as follows;YF (100% yam flour), YFSF1: (90% yam flour: 10% soybean flour),YFSF2: (80% yam flour: 20% soybean flour), YFSF3: (70% yam flour: 30% soybean flour
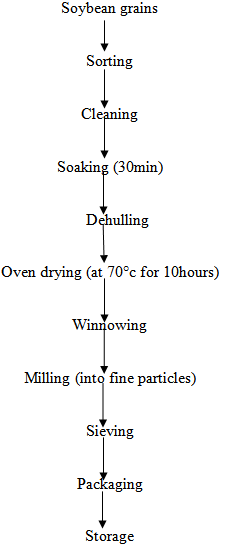 | Figure 2. Flow diagram for the production of soybean flour[19] |
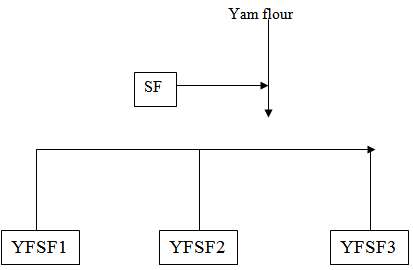 | Figure 3. Flow diagram for blend formulation |
2.2.4. Storage of Samples
- All flour samples were stored in Ziploc bags in a deep freezer prior to analysis.
2.3. Dough Making
- The poundo yam dough was prepared in the laboratory using the manual method of processing.
2.3.1. Dough Preparation
- The yam flour and soybean flour were sorted and milled to fine powder separately, the fine powders were sieved, and the various blends were made. The water was boiled in a pot on a gas cooker. A quantity of the flour blend i.e. 90-10%, 80-20% and 70-30% was poured in the boiling water and stirred continuously till it gelatinizes into thick dough. A little quantity of water was added to allow the flour cook properly; the paste was stirred till semi dough was obtained.
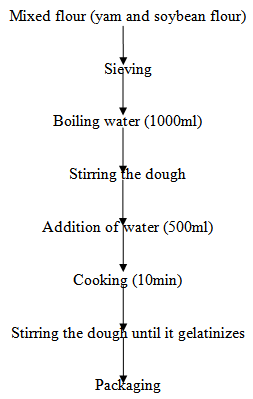 | Figure 4. Flow diagram for pounded yam dough processing |
2.4. Proximate Analysis
- Each flour sample was analyzed for moisture content which was determined according to method 964.22[19]; crude protein was determined using the Kjeldahl method[19]; crude fat extracted in a Soxhlet extractor with hexane and quantified gravimetrically; ash according to method 923.03[19]. Crude fibre was determined using the method described by AOAC[19]. Carbohydrate was calculated by difference.
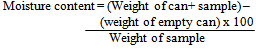
2.4.1. Determination of Moisture Content
- The Moisture Content was determined using procedure described byAOAC[19]. The moisture content of each sample was determined by weighing 5g of the sample into an aluminium moisture can. The sample was then dried to constant weight at 105±2C.
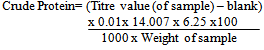
2.4.2. Determination of Crude Protein
- The Protein Content was determined using a Foss Tescator protein digestor and KJECTEC 2200 distillation apparatus (Kjeldahl method) according to the procedure of AOAC,[19]. Concentrated H2SO4 (12ml) and 2 tablets of catalyst were put into a Kjeldahl digestion flask containing 1g of the sample. The flask was placed in the digestor in a fume cupboard and switched on and digestion was done for 45 minutes to obtain a clear colorless solution. The digest was distilled with 4% boric acid, 20% Sodium hydroxide solutions were automatically metered into it in the KJECTEC 2200 distillation equipment until distillation was completed. The distillate was then titrated with 0.1M HCl until a violet color formation indicating the end point. A blank was run under the same condition as with the sample. Total nitrogen content was then calculated according to the formula:
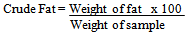
2.4.3. Determination of Crude Fat Content
- Crude fat was extracted in a Soxhlet extractor with hexane and quantified gravimetrically. 1g of sample was weighed into an extraction thimble and then stopped with grease-free cotton. Before extraction commenced the round bottom cans was dried, cooled and weighed. The thimble was placed in extraction chamber and 80ml hexane was added to extract the fat. The extraction was carried out at 1350C lasted for 1hour 40minutes after which the fat collected in the bottom cans were cooled in a dessicators.
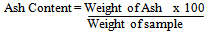
2.4.4. Determination of Ash Content
- 2g of samples were weighed into well incinerated crucibles and then ashed in a muffle furnace at 6000C for 3 hours. The ash content was calculated as
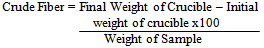
2.4.5. Determination of Crude Fiber
- 2g of the sample was transferred into 1 litre conical flask litre. 100ml of sulphuric acid (12.5M) was heated to boiling and then introduced into the conical flask containing the sample. The contents were then boiled for 30 minutes and ensuring that the level of the acid was maintained by addition of distilled water. After 30 minutes, the contents were then filtered through a muslin cloth held in a funnel. The residue was rinsed thoroughly until its washing was no longer acidic to litmus. The residue was then transferred into a conical flask. 100ml of sodium hydroxide (12.5M) was then brought to boil and then introduced into the conical flask containing the sample. The contents were then boiled for 30 minutes and ensuring that the level of the acid was maintained by addition of distilled water. After 30 minutes, the contents were then filtered through a muslin cloth held in a funnel. The residue was rinsed thoroughly until its washing was no longer alkali. The residue was then introduced into an already dried crucible and ashed at 600℃ ±200℃.
2.5. Functional Properties
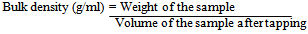
2.5.1. Determination of Bulk Density
- The bulk density was determined by the method of[20]. 5g of the sample was weighed into 50ml graduated measuring cylinder. The samples were packed by gently tapping the cylinder on the bench top 10 times from height of 5cm. The volume of the sample was recorded.
2.5.2. Determination of Swelling Power
- Swelling power was determined by the method described by[21]. It involves weighing 1g of flour sample into 5ml centrifuge tube; 10ml of distilled water was added and mixed gently. The slurry was heated in a water bath at a temperature of 100℃ for 15 minutes. During heating, the slurry is stirred gently to prevent clumping of the flour. On completion of 15 minutes, the tube containing the paste is centrifuged at 3000rpm for 10 minutes. The supernatant will be decanted immediately after centrifuging. The weight of the sediment is then taken and recorded. The moisture content of the sediment gel was used to determine the dry matter content of the gel.

2.5.3. Determination of Dispersability
- Dispersibility was determined using the method described by[22]. Ten grams of the flour sample was weighed into 100ml measuring cylinder, water was added to each volume of 100ml. The set up stirred vigorously and allowed to stand for three hours. The volume of settled particles was recorded and subtracted from 100. The differences reported as percentage Dispersibility.% Dispersibility = 100 - volume of settled particle
2.5.4. Determination of Water Absorption and Water Solubility Index
- Water absorption and water solubility index were determined using a method described by[23]. The crucibles and centrifuge tubes were dried in the oven at 105℃ for 20mins and allowed to cool in a dessicator, after cooling, the crucible and the centrifuge tubes were weighed. 1g each of the sample was weighed into the tube and 10mls of distill water was added and stirred gently with a stirring rod for 30mins. The tube containing the paste is centrifuged at 4000rpm for 15mins, on completion of the 15mins; the supernatants were decanted into crucibles and dried in the oven at 105°c until the supernatant is dried off. The residue remaining in the tubes were weighed and the crucible after drying with the supernatant. Water absorption index was calculated as;
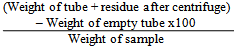 Water solubility index was calculated as;
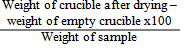
2.6. Dough Rheological Testing
2.6.1. Farinograph Testing
- Farinograph Testing was carried out on control (yam flour) and enriched flour blends (0%, 10%,20%, 30%) with the use of a Brabender - Farinograph®-E ( AACC 54-21 / ICC 115/1 /ISO 5530-1)[24]. The dough development time (DDT) is the time for the dough to reach maximum consistency (peak); stability was the time that the top portion of the curve is above the 500 BU line; mixing tolerance index (MTI) is the drop in BU from the top of the curve at DDT to the top of the curve 5 minutes after DDT.
2.6.2. Extensograph Testing
- Extensograph Testing was carried out on control (yam flour) and enriched flour blends (0%, 10%,20%,30%) with the use of a Brabender- Extensograph®-E (AACC 54-10 / ISO 5530-2 /ICC 114/1)[24]. A Brabender - Farinograph-E was used to mix the dough for 6 minutes after which the dough was subjected to proving at for 45 minutes after which the dough was stretched until rupture in the Extensograph®-E. This procedure was repeated twice after which a graph was plotted showing the exerted force as a function of the stretching length (time). The following parameters were determined from the graph;1. Water absorption (%).2. Energy (Area under the curve) (cm3).3. Resistance to Extension (BU). 4. Extensibility (mm).5. Maximum (BU) 6. Ratio number. 7. Ratio number (Max.).
2.7. Statistical Analysis
- The flour samples data were statistically analyzed using SPSS (Statistical Package for the Social Sciences) Version 16 for PC Windows. All data were subjected to Analysis of Variance (ANOVA) and means were separated using Duncan’s Multiple Range Test (DMRT). Data was presented as mean ± standard error. Differences were considered significant if Probability is less than 5% (P ≤0.05) for both sets of data.
3. Results and Discussion
3.1. Functional Properties Yam Flour and Soy Enriched Yam Flour
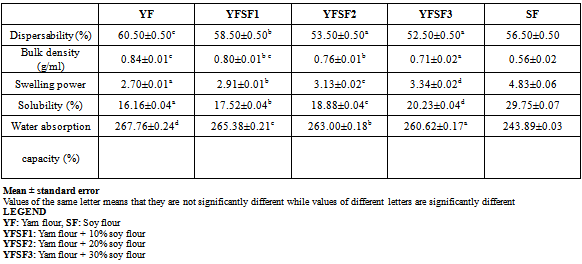
- The effect of soy flour enrichment on the functional properties parameters of yam flour is showed in Table 2. There were significant differences in the functional properties (P≤0.05) of the enriched flour blends. The result obtained for water absorption capacity ranged btw 267.76-260.62% Water absorption capacity is the ability of flour to absorb water and swell for improved consistency in food. It is desirable in food systems to improve yield and consistency and give body to the food[25].The water absorption capacity of yam flour reduced as the proportion of soy flour increased in the mixture. This effect was probably due to loose association of amylose and amylopectin in the native granules of starch and weaker associative forces maintaining the granules structure[26]. The water absorption index measures the extent of water retention in yam flour this affects the ability of the yam flour to form paste.The result of the bulk density showed that there was no significant difference between the 100% yam flour, 90:10 blend and 80:20 blend but there was significant difference (P≤0.05) between 80:20 blend and 70:30 blend. The bulk density of the enriched yam flour blends were considerably low in comparison to the bulk density of the control ( 100%yam flour) which had the highest value of 0.84g/ml, which means that yam flour was denser than the soybean flour. The bulk density is influenced by particle size and the density of the flour and is important in determining the packaging requirement and material handling[27].[28] reported that bulk density is influenced by the structure of the starch polymers and loose structure of the starch polymers could result in low bulk density.The swelling power and solubility index of the flour blends increased significantly (P≤0.05) as the proportion of soy flour increased, ranged from 2.70-3.34 and 16.16- 20.23% with the 70: 30 blend having the highest value in comparison with the control (100% yam flour) having a swelling power of 2.70 and solubility of 16.16%. The swelling power is an indication of presence of amylase which influences the quantity of amylose and amylopectin present in the yam flour.[29] reported that the swelling power of flour granules is an indication of the extent of associative forces within the granule. Swelling power is also related to the water absorption index of the starch-based flour during heating[30]. Therefore, the higher the swelling power, the higher the associate forces[31]. The variation in the swelling power indicates the degree of exposure of the internal structure of the starch present in the flour to the action of water[31].The dispersability of the flour from the three blends showed that there were significant difference (P≤0.05) between the 100% yam and 90:10 blend and there was no significant difference between the 80:20 blend and 70:30 blend. The dispersability of the 100% yam flour was higher than that of the enriched flour blends and this may be due to the fact that yam flour has higher water absorption than the soy flour and it can reconstitute in water better than the soy flour. However, the values of dispersability were relatively high for all the flour blends hence, they will easily reconstitute to give fine consistency dough during mixing[14].
|
 r
r3.2. Effect of Soybean Substitution on Farinograph Parameters for Yam Flour and Soy Enriched Flour Blends
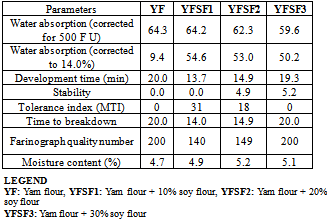
- The effect of soybean enrichment on the rheological properties of yam flour is summarized in Table 3. The Farinograph water absorption, dough stability time, dough development time and time to breakdown for the used yam flour (control) were 64.3.%, 0.0 min, 20.0 min and 20.0 min respectively. In Comparism with the control, water absorption decreased by addition of soy flour as a function of increasing protein content in the dough. Therefore, the lower water absorption of the blends could be related to the poor water absorption of the protein in soybean. The decrease observed might be as a result of the reduction in the level of gluten in soybeans. The lowest value was found in flour blends with 70:30 blend which was 59.6%. Dough Stability (DS) is given by the time from when the Farinograph trace touches the 500 BU line up to the break time. The dough stability time recorded increased with higher levels of soy substitution; increasing from 0% with yam flour to 5.2%. The dough development time (DDT) increased with increased levels of soy flour, with 100% yam flour the development time was 20.0 minutes, for the 90:10 substitution levels a development time of 13.7 minutes was obtained, at 80:20 substitution levels a development time of 14.9 minutes was obtained and at 70:30 substitution levels dough development time of 19.3 minutes was obtained. The 70: 30blend had the highest Farinograph quality number (200).
|
3.3. Effect of Soybean Substitution on Extensograph Parameters of Yam Flour and Soy Enriched Flour Blends
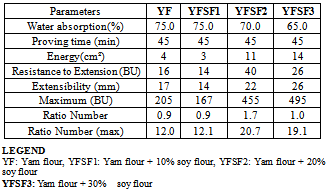
- The Extensograph energy, resistance to extension, extensibility, maximum, ratio number, ratio number maximum for the yam flour (control) and enriched flours were summarized in Table 4. It was discovered that at a proving time of 45minutes, the energy of the soy enriched dough had increased compared to that of the yam flour dough similarly the energies of the soy enriched dough increased with increasing levels of soybean flour substitution. The extensibility of the yam enriched doughs was higher than that of the yam flour dough, could be as a result of the absence of gluten in yam. The resistance to extension of the 70% yam flour + 30% soy flour was higher than the rest of the samples. The reason could be adduced to reason why the extensibility of the enriched poundo yam was higher than the control. Also, with higher substitution levels of soybean flour water absorption levels reduced and this is due to the fact that protein has poor water retention ability[32]
|
4. Conclusions
- Results from this study suggested that enriching yam flour with soybean flour at 10% would not only produce a more nutritionally balance and acceptable products. The results indicated that the soybean used in enriching the yam flour was able to increase the protein content as well as all other proximate composition except carbohydrate in the various combinations. Also, the amino acid profile of poundo yam increased with increasing enrichment levels. However the rheological characteristics of poundo yam doughs were affected as water absorption rate decreased with increasing enrichment levels. The increased in protein level with substitution improved textural property and extension property.In conclusion, substitution of yam flour with soy flour at levels of 10 to 30 % resulted in notable increase in protein content, which could be nutritionally advantageous to Nigeria, where many people can hardly afford high proteinous foods because of the costs. Since soybean is cheaper and readily available, soybean enrichment of yam flour would have little or no effect on the price of the product. Enrichment of yam flour with soybean can also reduce the problem of malnutrition in places where yam is consumed as a staple food.
References
| [1] | Sanni MO. and Sobamiwa AO, 1994. Processing and characteristics of soybean fortified gari. World Journal of microbiology and Biotechnology 10: 28-270. soy and cholesterol reduction: clinical experience. J. Nutr. 125: 5988- 605s. |
| [2] | Kolapo A.L,. and Sanni M.O., (2005). Processing and characteristics of soybean – fortified Tapioca. Journal of Women in Technical Education 4:59 – 66. |
| [3] | Akingbala J.O., Oguntimien, T.B., and Sobande, A.O., (1995). Physico-chemical properties and acceptability of yam flour substituted with soy flour. Plant food for Human Nutrition. 48: 73-80. |
| [4] | Achi OK, 1999. Quality attributes of fermented yam flour supplemented with processed soy flour. Plant Foods for Human Nutrition 54 (2): 151 –158. |
| [5] | Ashaye OA, Fasoyiro SB, Lawal RO, 2001. The effect of fortification on the composition and sensory attributes of cowpea – amala. Journal of Nutrition and Food Science 31(2): 88 – 91. |
| [6] | Jimoh, K.O. and Olatidoye O.P., (2009). Evaluation of physicochemical and rheological characteristics of soybean fortified yam flour. Journal of Applied Biosciences 13:703-706. |
| [7] | Abulude FO. and Ojediran VA, 2006. Development and quality evaluation of fortified ‘amala’. Acta Sci. Pol., Technol Aliment 5 (2): 127 - 134. |
| [8] | Akissoe N, Joseph H, Christian M, Nago N, 2003. Effect of tuber storage and pre- and post blanching treatments on the physicochemical and pasting properties of dry yam flour. Food Chemistry 85: 1414 - 1419. |
| [9] | Iwuoha CI, (2004). Comparative evaluation of physicochemical qualities of flours from steam processed yam tubers. Journal of Food Chemistry 85: 541-551. |
| [10] | Ekwu FC, Ozo NO, Ikegwu OJ, (2005). Quality of fufu flour from white yam varieties (Dioscorea spp). Nigerian Food Journal 23: 107-113. |
| [11] | Babajide JM, Henshaw FO, Oyewole OB, 2007. Effect of yam varieties on the pasting properties and sensory attributes of traditional dry-yam and its products. Journal of Food Quality 31 (3): 295-305. |
| [12] | Ukpabi U.J. and Omodamiro RM, 2008. Assessment of hybrid white yam (Dioscorea rotundata) genotypes for the preparation of amala. Nigerian Food Journal 26(1): 111-118. disintegrates in drugs formulation” journal of science food Agric, 20: 165 -171. |
| [13] | Akinwande BA, Abiodun OA, Adeyemi IA, Akanbi CT, 2008. Effect of steaming methods and time on the physical and chemical properties of flour from yam tubers. Nigerian Food Journal 26 (2): 97-105. |
| [14] | Adebowale AA, Sanni LO, Fadaunsi EL, 2008. Functional Properties of Cassava – Sweet Potato Starch Blend. Proceeding of the 32nd Annual Conference of Nigerian Institute of Food Science and Technology. Pg. 304 - 305. |
| [15] | Akanbi CT. and Oladeji BS, 2008. Pasting Performance of Composite flour from Yam, Cocoyam, Breadfruit and Plantain blends. Proceeding of the 32nd Annual Conference of Nigerian Institute of Food Science and Technology. Pg. 312 - 313. |
| [16] | Nwokolo, E., 1996. Soybean[Glycine max (L.) Merr.]. In: Legume and Oilseeds in Nutrition. S E. Nwokolo. |
| [17] | Nwabueze T. U. (2007) Effect of process variables on trypsin inhibitor activity (TIA), phytic acid and tannin content of extruded African breadfruit-corn-soy mixtures: A response surface analysis. LWT -Food Science and Technology, 40: 21-29. |
| [18] | FIIRO. (2005). Federal Institute of Industrial Research, Oshodi, Nigeria. Instant pounded Yam flour production technology. Available at:fiiro-ng.org/Instant-pouded-yam.htm. Accessed 6 May 2011. |
| [19] | A.O.A.C. (1990). Official methods of analysis. Association of Analytical Chemists, Washington, D.C. |
| [20] | Wang, J.C. and Kinsella, J.E (1976).Functional property of Novel Protein Alfafa protein Journal of Food Science 4:286-296. |
| [21] | Takashi, S. and Sieb, P.A. (1988). Paste and gel properties of prime corn and wheat starches with and without native lipids. Cereals chemistry 65; 47. |
| [22] | Kulkarni K.O., Kulkarni, D.N. and Ingle, U.M (1991): Sorghum malt based weaning food formulation preparation, functional properties and Nutritive Value. Food and Nutrition Bulletin. 13. (14): 322-327. |
| [23] | Solusulski, F.W. 1962. The centrifuge method for determining flour absorptivity in hard red spring wheat’s. Cereal chemistry 39: 344 |
| [24] | A.A.C.C. (2000). American Association of Cereal Chemists. Approved methods of the AACC (10th ed.) Methods 10-09, 39-11, 39-06, 54-21, and 74-09. St. Paul, MN: AACC. |
| [25] | Osundahunsi OF, Fagbemi TN, Kesselman E, Shimoni E (2003). Comparison of the physicochemical properties and pasting characteristics of flour and starch from red and white sweet potato cultivars. J. Agric. Food Chem., 51: 2232-2236. |
| [26] | Lorenz, K. and Collins F, 1990. Quinoa (Chenopodium quinoa), starch physicochemical properties and functional characteristics. Starch/starke 42 (3): 81 - 86. |
| [27] | Karuna D, Noel G, Dilip K (1996). Food and Nutrition Bulletin, 17: 2,United Nation University. |
| [28] | Plaami, S.P (1997). Content of dietary Fiber in Foods and its physiological effects, Food Rev. Internl. 13:27-76. |
| [29] | Moorthy, S.N. and T. Ramanujam, 1986. Variation in properties of starch in cassava Varieties in relation to age of the crop. Starch tarke, 38: 58-61. |
| [30] | Loss, P .J., Hood,L.F. and Graham, A.J., (1981). Isolation and characterization of starch From breadfruit. Cereal Chem., 58: 282-286 |
| [31] | Ruales, J., Valencia, S and Nair, B (1993).Effect of processing on the physiochemical characteristics of guinea flour. (Chenopodium guinea Wild) starch 46 ( 1): 13-19. |
| [32] | Malomo O., Ogunmoyela O.A.B., Oluwajoba S.O and Kukoyi Iretimipo. (2012)., Effect of germinated and ungerminated soybean flour on the rheological properties of wheat bread dough. British journal of Science. January, vol 3(1) : 28 |