-
Paper Information
- Next Paper
- Paper Submission
-
Journal Information
- About This Journal
- Editorial Board
- Current Issue
- Archive
- Author Guidelines
- Contact Us
International Journal of Food Science and Nutrition Engineering
2012; 2(4): 44-53
doi: 10.5923/j.food.20120204.01
Methodological Validation for the Determination of Ca, Cr, Mg and Mn in Umbilical Cord and Maternal Blood (City of Vale do Paraíba, São Paulo, Brazil)
 Abstract
 Reference
 Full-Text PDF
 Full-Text HTML
Luiz F. Bayod Filho 1, Rodrigo F. S. Salazar 2, Marco A. K. Alcântara 3, Luiz F. C. Nascimento 4, Hélcio J. Izário Filho 1, Messias B. Silva 1
1Department of Chemical Engineering, Escola de Engenharia de Lorena, Universidade de São Paulo, Lorena, 12602-810, Brazil
2Department of Chemistry, Universidade Federal de São Carlos, São Carlos, 13565-905, Brazil
3Department of Biotechnology, Escola de Engenharia de Lorena,. Universidade de São Paulo, Lorena, 12602-810, Brazil
4Departament of Medicine, Universidade de Taubaté, Taubaté, 12030-180, Brazil
Correspondence to: Marco A. K. Alcântara , Department of Biotechnology, Escola de Engenharia de Lorena,. Universidade de São Paulo, Lorena, 12602-810, Brazil.
| Email: |  |
Copyright © 2012 Scientific & Academic Publishing. All Rights Reserved.
This investigation focused on the validation of the methodology used in determining the presence of specific elements in human blood. Concentrations of macro- and micronutrients in umbilical blood (UCB) samples from 37 lactating volunteers who gave birth in the city of Taubaté, State of São Paulo, Brazil. The determinations of Ca and Mg were carried out in a flame atomic absorption spectrometer (FAAS) and those of Cr and Mn in a graphite furnace atomic absorption spectrometer (GFAAS). A procedure for preparing samples was optimized and evaluated. Standard addition methods and determinations by ICP OES were used to validate the analytical procedures. An acetylene/air mixture was optimized at 2.0/17.0 L min-1 (Ca and Mg). Pyrolysis and atomization temperatures for Cr were at 1400℃ and 2100℃, respectively, and for Mn at 1300℃ and 1700℃, respectively. The most efficient chemical modifier was a solution containing 5 g of Pd + 3 g of Mg(NO3)2. Characteristic masses for Cr and Mn were 2.6 and 2.7 pg, respectively. The methods presented high analytical efficiency in the determination of Ca, Cr, Mg and Mn (recovery from 98.68% to 108.22 %). Minimal data variations in repeatability and reproducibility indicated significient precision and accuracy for the proposed methodology. The placenta did not block transport of elements from mother to fetus. The contents of the elements analyzed in the UCB were compared to those detected in maternal blood (MB). Most of the children exhibited normal weight (from 2.5 to 3.0 kg) as per the Brazilian Ministry of Health standards. Such results indicate that the levels of concentrations of the elements found in the UCB did not affect the weights of the neonates.
Keywords: FAAS, GFAAS, Umbilical Cord Blood, Micro- , Macroelements, Infant Nutrition
Article Outline
1. Introduction
- The determination and study of micro- and macroelements in umbilical blood, essential or toxic, is of great interest to public health. Various studies in the literature deal with the biological importance, essential nature, toxicity, deficiency and possible sources of different macro and microelements including: calcium[1-7]; magnesium[2,4,6,7];manganese[7-9] and chromium[7,10-12]. Children, especially neonates, exhibit high rates of bodily growth. Contrasted with adults, the rapid growth rate is attributed to an elevated metabolism and differences in body composition (total body water), fluid pH, and reflects an elevated energy requirement per body mass unit. Renal activity is also reduced[8,13,14]. These characteristics in neonates facilitate a higher potential for the absorption of elements in contrast with adults.This greater absorption capacity is also applicable for various toxic elements[15]. A clear understanding of the levels of toxic-element transfer during pregnancy is exceptionally important for pediatricians in the prevention and advance treatment of diseases affecting fetal health. Prior studies exist relating the levels of elements in maternal blood to those found in the umbilical blood. As examples, we can cite evaluations of Hg, Pb, Cd as well as essential elements (Cu, Zn and Se) concentrations in this matrix[16]. Other studies conducted in Saudi Arabia[17] and Pakistan[18] noted relationships between maternal contamination by Pb and subsequent transfer of this element to the umbilical cord. Japanese studies[19] documented the transfer of Hg, Pb, As and Cd found in maternal blood to the umbilical cord.Unfortunately, studies of metallic elements in maternal and neonate blood are largely lacking for Brazil. Rare exceptions from Brazil are those studies that focused on Fe[20],[21] and Pb[22]. Validating a methodology for chemical analysis involves parameters of precision, selectivity, bias/recovery, ruggedness, sensitivity/linearity/working range, detection limit and quantification limit[23]. The validation process also necessitates a definition of parameters with the greatest importance. Determining metallic elements in biological matrices, among other aspects, both quantification and sensitivity allowing the detection of macro- and micro concentrations. In routine uses, reliability and cost savings are also important factors. Among various spectrophotometric technologies available, flame atomic absorption spectrometry (FAAS) and electrothermal heating in a graphite furnace atomic absorption spectrometer (GFAAS) possess superior analytic capacities for biological samples. White & Sabbione showed that atomic absorption spectrometry (AAS) presented similar results to more sophisticated techniques, such as inductively coupled argon plasma mass spectrometry (ICP-MS) and neutron activation analysis (NAA)[24].The primary goal of this study was the validation of methodology for determination of elements in blood by GFAAS and FAAS. Specific evaluation objectives for the validation were: (i) sensitivity; (ii) accuracy in analyte recovery; (iii) precision in comparison with established techniques, and (iv) verification of the transfer of metallic elements from maternal to neonate blood using statistical models.
2. Material and Methods
2.1. Glassware, Reagents and Analytical Standard Solutions Used
- Requisite TeflonTM materials and glassware for the preparation of standard solutions and samples were conditioned in an HNO3 solution at 10% (v v-1) for 24 hours. A Simplicity bench-top deionizer from MiliporeTM was used to obtain deionized water at a resistance of 18.2 MΩ cm-1. All decontamination procedures for hardware and preparation of samples were carried out with water obtained from this system.Analytical-grade (PA) acid solutions of HNO3 65% (m m-1), HCl 37% (m m-1) and HF 40% (v v-1) from MerckTM were utilized.Standard analytical solutions used for addition and recovery tests, external calibration, and as a matrix modifier in GFAAS were uniformly prepared with dilutions of SpecSolTM containing 1,000 mg g-1 of the target element, as per NIST standards.
2.2. Description of the Spectrometer and Operating Conditions
- Determinations of the elements in the blood samples were performed in an Atomic Absorption Spectrometer, PerkinElmer brand, model Aanalyst 800. This equipment has integrated system components for both flame and graphite furnace operations in a single instrument allowing for an automated atomization technique selection. This device also has a dual-band optical system (single-band for graphite furnace operations), optical components coated with anticorrosive and protective materials, motorized Littrow-type monochromator for automatic wavelength selection, and alignment adjustment. The device has a working range between 185 to 870 nm with an 1800-line nm-1 diffraction grating and solid state detector, as well as correction for flame-background and structured background (i.e., molecular absorption) for GFAAS by deuterium lamp.The graphite furnace used had transversal heating providing a uniform temperature profile with longitudinal Zeeman-effect structured background correction. Other functions include automatic software controls facilitated by an analytic program with up to 12 steps of programmable parameters such as temperature (up to 2600℃ with 10℃ intervals) and heating ramp time (programmable from 1 to 99 seconds). All the experiments utilized the graphite furnace atomic absorption instrument under STPF (Stabilized Temperature Platform Furnace) conditions with specific chemical modifiers.
2.3. Selection of the Lactating Women
- Invitations were distributed to women under prenatal care and who gave birth between November, 2004 and January, 2006 at the Taubaté University Hospital (Hospital Universitário de Taubaté), located in the city of Taubaté, Vale do Paraíba Region, State of São Paulo, Brazil. Participants were selected through the SUS (Sistema Único de Saúde) records of the Brazilian health care system. Those participating in the study did so as signatories of an informed-consent form which provided information about the project. The form was previously approved by the Ethics Commission of the Taubaté University Hospital (protocol CEP/UNITAU number 192/04).
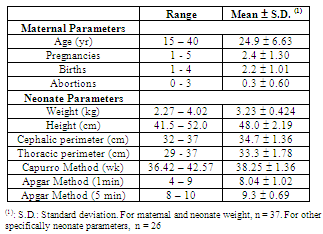
2.4. Maternal and Neonate Parameters
- Selected parameters related to mothers and children are presented in Table 1. The maternal parameters showed a great range of categorical values. Ages ranged from teenager from adult (15 to 40 years, mean = 24.9 ± 6.63). Previous pregnancies varied from 1 to 5 (mean = 2.4 ± 1.30). Abortions varied from 0 to 3 (calculated individually as the difference in pregnancies and births). The breadth of range in these parameters suggests a generalized population profile is represented. Other parameters relevant to the health of pregnant women were: tabagism (8%), occasional smoking (40%), alcohol consumption (19%), known medical pathology (4%), known pregnancy pathology (50%), the proximity of metals industries (17%), and the use of hair dyes (0%). The consumption of medications and vitamins were factored as were education and occupation (data was not published).
|
2.5. Collection and Storage of Blood Samples
- The 37 pairs of samples, containing approximately 5 mL of both umbilical cord blood (UCB) and maternal blood (MB), were collected during hospitalization within 24 hours after birth using disposable syringes. The collected samples were then transferred to containers previously treated with HNO3 1:1 (v v-1) and deionized water. Collection containers were stored at -20℃ up to the time of analysis[32].
2.6. Digestion of the Blood Samples
- A determination of small concentrations of elements present in biological samples requires a pre-treatment which destroys the entire organic matrix without the loss of the target elements or contaminants. As in any analytic procedure, digestion must not introduce appreciable errors. Acid digestion is a commonly used procedure to destroy organic matter samples.To digest the blood samples in this study, 1.0 mL of the sample was combined (using micropipette) with 3.5 mL of an acid mixture containing HCl, HNO3 and HF in the proportion in volume of 4:2:1 in Teflon capsules of 15.0 mL capacity. The Teflon capsule was subsequently covered and inserted into an aluminum capsule. The loaded capsule was closed with a lid and kept sealed under pressure by a spring system. The sample was then placed within a stainless steel oven system that allowed examination under low pressure and controlled temperatures (decomposition pump). This entire assembly was heated with resistive heating maintained by a temperature controller. Figure 1 is a schematic diagram of the digestion pump used. This system provides a more effective decomposition through an optimal reflux of the acid mixture and corresponding isolation of the system with the medium in contrast with block digestion systems[33].
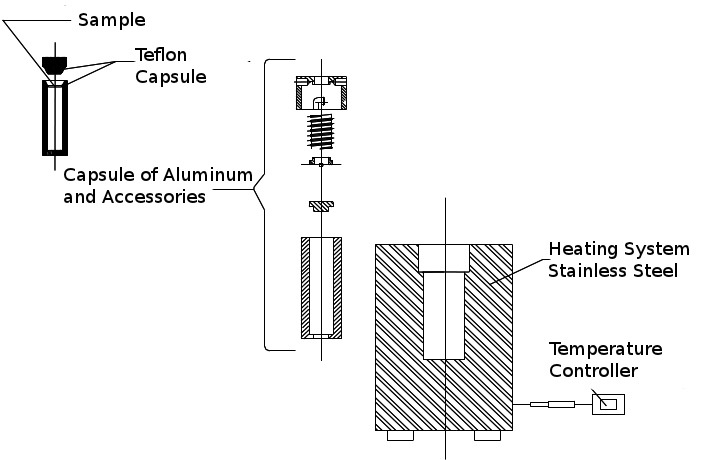 | Figure 1. Diagram of the decomposition pump used in the digestion of blood samples |
2.7. Analytical Methodology Validation
2.7.1. Optimization of the Pyrolysis , Atomization Parameters and Temperature Program
- Pyrolysis and atomization curves were prepared for Cr and Mn in the graphite furnace to ensure a symmetrical and representative atomization signal of the analyte mass. The temperature variation used was 100℃, both for pyrolysis and for atomization. Cr samples were used containing 26 pg of Cr and 10 L of digested blood diluted 25 times. The curves were prepared both in the presence and absence of a chemical modifier (15 g of Mg(NO3)2). Mn samples were used containing 26.25 pg of Cr and 10 L of digested blood diluted 250 times. A stable signal was established for each element (sample volume and a standard). The atomization temperature was subsequently established and the temperature of pyrolysis varied. The atomization temperature varied for each element under optimized the pyrolysis temperatures. The external calibration curves were prepared in the presence of a chemical modifier (5 g of Pd + 3 g of Mg(NO3)2). The external calibration curves prepared in the absence of the chemical modifier are not presented in this study. Temperature programs were prepared after optimization of the pyrolysis and atomization temperatures for Cr and Mn. For each stage of the heating program (drying, pyrolysis, atomization and cleaning), the temperature, duration, step (stance phase) and the internal discharge of air were defined.The analytical parameters for Ca and Mg determinations in FAAS (flame) were optimized for variable gas-flow in conjunction with the air/acetylene ratio to provide the optimal sensitivity in atomization.
2.7.2. Evaluation of the Analytic Sensitivity
- One parameter expressing the sensitivity of an analytic determination of characteristic mass (m0) is expressed in Equation 1 below[33]:
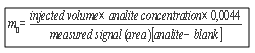 | (1) |
 | (2) |
2.7.3. Accuracy Assessment Method
- In the absence of both certified validation standards and reference materials approaching the complexity of the matrix sample, an alternative was used to evaluate the accuracy of the method where analyte addition/recovery tests (SAM) of the matrix were contrasted with inter-laboratory tests. In the addition method, the initial concentration of a known element in the matrix is quantified. A known concentration of the element is then added and the element concentration obtained is determined experimentally. In theory, the concentration obtained experimentally in these samples is given by the sum of the initial concentration together with the added known concentration[34,35]. Also, the precision of the methodology for recovering the analyte was evaluated, calculating the relative error (RE) by Equation 3 below:
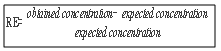 | (3) |
2.7.4. Precision Assessment Method
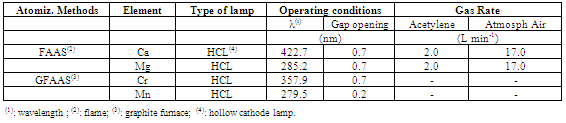
- The performance evaluation procedure for the method-in-question compared results from that method with result derived from a previously validated reference method. The objective was to contrast the degree of proximity between the results obtained from the two methods, that is, evaluate the accuracy of the method in the process of validation with that of reference[23]. In this study, the results of the methods under study (FAAS and GFAAS) were compared with those obtained by inductively coupled plasma optic emission spectrometry (ICP OES). A sequential spectrometer, Model 3410 from ARL, was used. Determinations were made in triplicate and the results of the two methods compared by Student’s t-test.The experimental parameters and operating conditions adopted in the technique of determination by ICP (used to evaluate precision with the method optimized here) are found in Tables 2 and 3, respectively.
|
2.7.5. Repeatability and Reproducibility assessment method
- Validation of the methodology for detecting metallic elements in blood used a statistical cross-correlated variable analysis measurement system. The validation used three analysts. Each analyst performed three measurements conducted on different days, for three values of predetermined concentrations (a total of 27 measurements). The standard deviation of the process was equal to 1 with 95% confidence. For this assay, we used only one sample (collected in large volume in comparison with the others). The selected sample was analyzed in natura and with two different dilutions of the sample (blood) and deionized water at 1:1 and 1:2 (v-v1). Collected data were analyzed by the Minitab 16TM software program.
2.8. Evaluation of the Interest Element Concentration Levels in Blood Samples
2.8.1. Transfer of the Maternal Blood Elements to the Neonate Umbilical Cord
- Forty pairs of blood samples from the umbilical cord of neonates (UCB) and from maternal blood (MB) were analyzed. The mean values between these two groups were compared using Student’s t-test for the possibility of placental transport blocking of metallic elements from mother to fetus.The presence of each selected element in neonate UCB was correlated with the respective MB samples. The aim was the determination of the direction of the flow of these metals as mother-to-fetus or fetus-to-mother. Also, the concentration of each element in the umbilical cord and the weight of the neonate were correlated. Evidently, neonate weight does not depend solely on the concentration of a determined metal, nor is it possible to affirm that there is a relationship of dependency between these two variables. What was investigated in this study was if possible variations in the concentration of the element in neonate blood would be sufficient to affect the weight of the child, either in a positive or negative way. Lastly, correlations between elements in UBC were analyzed with other neonate parameters: height, cephalic perimeter, thoracic perimeter, Capurro Method values, and 1 and 5 min Apgar values.
2.8.2. Statistical Treatment
- Student’s t-test was used to correlate the mean values of the analyte concentrations with neonate body mass. A 5% significance was adopted in these studies, that is, if the value of p found is less than 0.05, it indicates that the means are different at a 5% significance level (Type I error, when the initial hypothesis H0 : x2 = x1 is rejected and the alternative hypothesis Ha : x2 ≠ x1 is accepted). The data were analyzed by the software program Epi.Info 6.04 (for the WindowsTM platform).To evaluate the degree of association among variables, regression variance analysis was carried out, calculating the Pearson product-moment correlation coefficient. The significance of the F of this analysis (p) was then calculated. The p value represents the probability of obtaining results outside the region of conclusion by the regression variance analysis. For example, if p < 0.05, the correlation between the two variables is significant at 5%; if p < 0.01, it is significant at 1%. In this estimate, the computing application Gnumeric v.1.10.3 (for the Linux platform) was used.
3. Results and Discussion
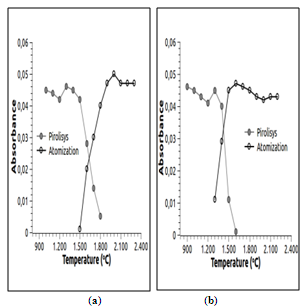 | Figure 2. Pyrolysis and atomization profile in the presence of chemical modifier: a) Cr and b) Mn |
|
| ||||||||||||||||||||||||||||||||||||||||||||||||||||||||||||||||||||
|
3.1. Instrumental Optimization for FAAS and GFAAS
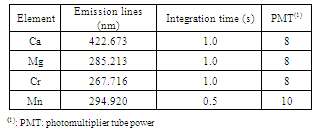
- Table 4 shows the analytical operating conditions used for determination of Cr and Mn by GFAAS and Ca and Mg by FAAS.The pyrolysis and atomization curves in the presence of the chemical modifier for Cr and Mn are found in Figure 2.Based on analysis of Figure 2, pyrolysis and atomization temperatures were established at 1400 and 2100℃ for Cr and at 1300 and 1700℃ for Mn respectively. Once these parameters were optimized, a temperature program was constructed for the elements of interest, as presented in Table 5.
3.2. Sensitivity Assessment Method
- Cr, in the presence of chemical modifier, showed an estimated characteristic mass of 2.6 pg and 2.7 pg for Mn. This indicates a heightened sensitivity of the method. Interference from chloride in an HCl solution used for digestion of the samples was possible in the atomization of the elements. Nevertheless, the final concentration of chloride found in the samples after dilution was less than that specified for an interferent chloride concentration[36].
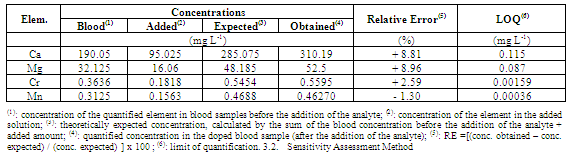
3.3. Accuracy Assessment Method in Analytic Recovery
- Table 6 shows the results of the analyte addition/recovery test, as well as the quantification limit for each element. Considering the calculated RE, the recovery values ranged from 98.68% to 108.22% in relation to those expected theoretically (100%). In other words, since the recovery margin was acceptable (less than 10%), the method is reliable in regards to this parameter of evaluation.
3.4. Precision Assessment Method
- According to the results obtained (Table 7), together with the paired Student’s t-test (p < 0.05) it was observed that there was no statistical difference of the results obtained using two distinct spectrometric techniques for the doped blood samples. Sample preparation procedures for determination of Ni in plant tissue samples by inter-laboratory analysis using FAAS, GFAAS and ICP OES were validated in a previous work[30].
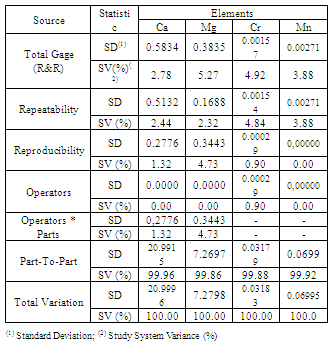
3.5. Repeatability and Reproducibility Method
- Table 8 shows the application of analytical techniques for measuring cross-variables for the determination of each element of interest in blood.
| |||||||||||||||||||||||
|
|
3.6. Transfer of the Maternal Blood Elements to the Neonate Umbilical Cord Blood
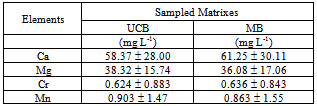
- Table 9 shows the mean values determined in UBC and MB samples as well as their standard deviations.
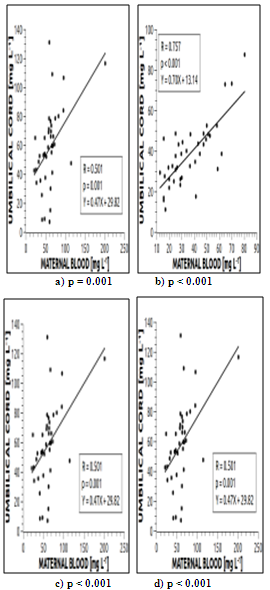 | Figure 3. Correlation between maternal blood (MB) and of the umbilical cord of the newborn (UCB) for the elements: a) Ca; b) Mg; c) Cr; d) Mn |
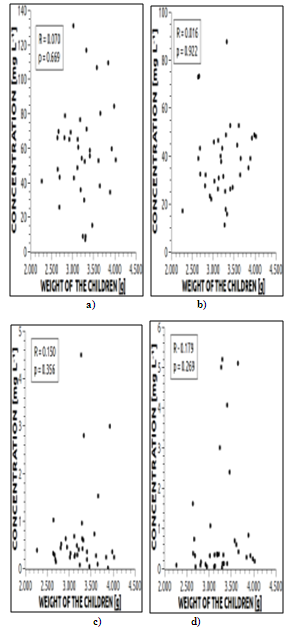 | Figure 4. Correlation between weight of the child and in umbilical cord blood for the elements: a) Ca; b) Mg; c) Cr and d) Mn |
| ||||||||||||||||||||||||||||||||||||||||||
4. Conclusions
- 1. The preparation and instrumental methods exhibited high analytical efficiency in the determination of Ca, Cr, Mg and Mn presenting recovery percentages from 98.68% and 108.22%. Low variation was evident in repeatability and reproducibility percentages, indicating the significant precision and accuracy of the proposed methodology.2. The placenta did not block transport of the elements from mother to the fetus since the concentrations of each element did not differ between the two age groups.3. The analyzed contents of neonate umbilical cord blood were positively related to those detected in the maternal blood. Therefore, the nutritional state of the neonate (in relation to Ca, Mg and Mn), or the presence of contamination (in relation to Cr), depends on the concentrations of these elements in the maternal blood.4. The levels of the elements in umbilical cord blood did not affect the weight of neonates.
ACKNOWLEDGEMENTS
- We gratefully acknowledge the generous support of the Research Support Foundation of the State of São Paulo (Fundação de Amparo à Pesquisa do Estado de São Paulo) in their financial grant for this study (Fapesp processes 1999/09864-9 and 2011/06710-4).
References
| [1] | NRC - National Research Council. Food and Nutrition Board. Recommended dietary allowances, 10th edn. National Academy Press, Washington, D.C. 1989. 302p. |
| [2] | Krachler M., Rossipal E., Micetik-Turk D. Trace element transfer from mother to the newborn-investigation on triplets of colostrum, maternal and umbilical cord serum. European Journal of Clinical Nutrition, vol.53, pp.486-494. 1999. |
| [3] | THOMSON HEALTHCARE. PDR for nutritional supplements. Medical Economics Company, Inc., Montvale, NJ. 2001. 575p. |
| [4] | Baião E.A.M., Perez J.R.O., Baião A.A.F., Geraseev L.C., Oliveira A.N., Teixeira J.C. Composição corporal e exigências nutricionais de cálcio e fósforo para ganho em peso de cordeiros. Ciência e Agrotecnologia, vol. 27, no.6, pp.1370-1379. 2003. |
| [5] | Zemel M.B., Miller S.L. Dietary calcium and dairy modulation of adiposity and obesity risk. Nutrition Reviews, vol.62, no.4, pp.125-131. 2004. |
| [6] | Longe J.L. The gale encyclopedia of alternative medicine, 3rd edn (rev.). 2008. 2000p. |
| [7] | Soares V.A., Kus M.M.M., Peixoto A.L.C., Carrocci J.S., Salazar R.F.S., Izário Filho H.J. Determination of nutritional and toxic elements in pasteurized bovine Milk from Vale do Paraíba region (Brazil), Food Chemistry, vol.1, pp.45–49. 2010. |
| [8] | Baum C.R., Shannon M.W. Lead in Breast Milk. Pediatrics, vol.97, pp.932-938. 1996. (Letter to the Editor). |
| [9] | Jacobs J. Gale Encyclopedia of Alternative Medicine. Boston, Journey Editions. 2006. 320p. |
| [10] | Alcântara M.A.K., Aquino Neto V.A., Camargo O.A. Comportamento do crômio no ambiente. PUC-SP Ciências Biológicas e Ambientais, vol.2, no.1, pp.83-125. 2000. |
| [11] | Gonçalves M.M. Cromo: Balanço mineral brasileiro. 2001. 28p. |
| [12] | Shils M.E., Shike M., Olson J., Ross C. Modern Nutrition in health and disease, 10th edn. 2005. 2146p. |
| [13] | Oskarsson A., Hallen I.P., Sundberg J., Petersson K. Risk assessment in relation to neonatal metal exposure. Analyst, vol.123, pp.19-23. 1998. |
| [14] | Landrigan P.J., Sonawane B., Mattison D., Mccally M., Garg A. Chemical contaminants in breast milk and their impacts on children's health: an overview. Environmental Health Perspectives, vol.110, no.6, pp.A313–A315. 2002. |
| [15] | Chandra R.K. Trace elements in nutrition of children. Raven Press, New York. 1984. 15p. |
| [16] | Walker J.B., Houseman J., Seddon L., McMullen E., Tofflemire K., Mills C., Corriveau A., Weber J-F., LeBlanc A., Walker M., Donaldson S.G., Oostdam, J.van. Maternal and umbilical cord blood levels of mercury, lead, cadmium, and essential trace elements in Arctic Canada. Environmental Research, vol.100, pp.295–318. 2006. |
| [17] | Al-Saleh I., Shinwari N., Nester, M., Mashhour A., Moncari L., Mohamed G.E.D., Rabah A. Longitudinal study of prenatal and postnatal lead exposure and early cognitive development in Al-Kharj, Saudi Arabia: A preliminary results of cord blood lead levels. Journal of Tropical Pediatrics, vol.54, no.5, pp.300-307. 2008. |
| [18] | Janjua N.Z., Delzell E., Larson R.R., Meleth, S., Kabagambe E.K., Kristensen S., Sathiakumar N. Maternal nutritional status during pregnancy and surma use determine cord lead levels in Karachi, Pakistan. Environmental Research, vol. 108, pp.69–79. 2008. |
| [19] | Sakamoto M., Murata K., Kubota M., Nakai K., Satoh H. Mercury and heavy metal profiles of maternal and umbilical cord RBCs in Japanese population. Ecotoxicology and Environmental Safety, vol.73, pp.1-6. 2010. |
| [20] | Silber M., Segre C.A.M., Goldenberg S., Casanova L.D. Determinação dos valores hematológicos e das concentrações séricas de ferro e ferritina em sangue de cordão umbilical de recém-nascidos de termo e pré-termo no Hospital Israelita Albert Einstein de São Paulo. Acta Cirúrgica Brasileira, vol.15, no.4, pp.00-00. 2000. http://www.scielo.br/scielo.php?script=sci_arttext&pid=S0102-86502000000400006&lng=en&nrm=iso. Accessed 23 June 2011. |
| [21] | Paiva A.A., Rondó P.H., Pagliusi R.A., Latorre M.R.D.O, Cardoso M.A.A., Gondim S.S.R. Relationship between the iron status of pregnant women and their newborns. Revista de Saúde Pública, vol.41, no.3, pp.321-327. 2007. |
| [22] | Santos E.O., Jesus I.M., Câmara V.M., Brabo E.S, Jesus M., Fayal K.F., Asmus C.I.R.F. Correlation between blood mercury levels in mothers and newborns in Itaituba, Pará State, Brazil. Cadernos de Saúde Pública, vol.23, suppl.4, pp.S622-S629. 2007. |
| [23] | INMETRO – Instituto Nacional de Metrologia, Normatização e Qualidade Industrial. Orientação sobre validação de métodos analíticos. Coordenação Geral de Acreditação, DOQ- CGRE-008 (3rd rev.). 2010. 20p. |
| [24] | White M.A., Sabbione E. Trace element reference values in tissues from inhabitants of the European Union. X: A study of 13 elements in blood and urine of a United Kingdom population. Science of the Total Environment, vol.216, pp.253-270. 1998. |
| [25] | Benemariya H., Robberecht H., Deelstra H. Copper, zinc and selenium concentrations in milk from middle-class woman in Burindi (Africa) throughout the first 10 months of lactation. Science of the Total Environment, vol.164, pp.161-174. 1995. |
| [26] | WHO – World Healt Organization. The world healt report 2006: working together for healt. World Health Organization, 2006. 237p. |
| [27] | BRASIL. Ministério da Saúde. Secretaria de Políticas de Saúde. Urgências e emergências maternas. Manual Técnico. 2nd ed. Brasília, Ministério da Saúde. 2000. 122p. |
| [28] | Capurro H., Konichezky S., Fonseca D., Caldeyro-Garcia A. A simplified method for diagnosis of gestational age in the newborn infants.The Journal of Pediatrics, vol.93, n.1, pp.120-122, 1978. |
| [29] | Engle W. A recommendation for the definition of late preterm (newborn) and the birth-weight – gestational age classification system. Seminars in Perinatology, vol.30, n.1, pp-2-7, 2006. |
| [30] | Apgar V. A proposal for a new method of evaluation of the newborn infant: current researches in anesthesis and analgesis. International Anesthesia Research Society, vol.32, n.4, pp.260-267, 1953. |
| [31] | Frkovic A., Medugorac B., Alebic-Juretic A. Zinc levels in human milk and umbilical cord blood. Science of the Total Environment, vol.192, pp.207-212, 1996. |
| [32] | Einster M., Wood M. The Apgar score has survived the test of time. Anesthesiology, vol.102, n.4, pp.855-857, 2005. |
| [33] | Flores É.M.M., Krug F.J., Barin J.S., Arruda M.A.Z. Decomposição de materiais orgânicos por via úmida. In: Krug FJ (ed) Métodos de preparo de amostras: fundamentos sobre preparo de amostras orgânicas e inorgânicas para análise elementar. Piracicaba, CENA/USP, pp.252-275. 2008. |
| [34] | Schlemmer G. Graphite furnace AAS for complex samples: Detection limits, precision, long-term stability. Atomic Spectroscopy, vol.17, pp.15-21. 1996. |
| [35] | Arellano M.W. Evaluations of ICP-AES performance. Anals of the 23th Pacific Conference on Chemistry and Spectroscopy. 1984. |
| [36] | Zylkiewicz B.G., Lesniewska B., Hulanicki A. The study of magnesium speciation in serum by liquid chromatography and graphite furnace atomic absorption techniques. Analytica Chimica Acta, vol.358, pp.185-193. 1998. |
| [37] | Salazar R.F.S., Alcântara M.A.K., Izário Filho H.J. Evaluation of sample preparation methods and optimization of nickel determination in vegetable tissues. Revista brasileira de Ciência do Solo, vol.35, pp.241-248. 2011. |