-
Paper Information
- Paper Submission
-
Journal Information
- About This Journal
- Editorial Board
- Current Issue
- Archive
- Author Guidelines
- Contact Us
Energy and Power
p-ISSN: 2163-159X e-ISSN: 2163-1603
2025; 14(2): 23-29
doi:10.5923/j.ep.20251402.01
Received: Oct. 24, 2025; Accepted: Nov. 19, 2025; Published: Nov. 25, 2025

Seasonal Analyses of 40 Years Records of Solar Radiation Data in Zawiya Region Northern West Part of Libya
 Abstract
 Reference
 Full-Text PDF
 Full-text HTML
Sarhan Hasan1, Aref M. Alkelani2, Ahmed Altaher Zuglem2, Abdelhamid Elgzil3, Osama Ali Elhenshiri4, Reda Elbahi5
1University of Denver, Colorado, USA
2Om Alrrabea Faculty of Sciences and Technology, Surman, Libya
3University of Colorado at Colorado Springs, USA
4Colorado Technical University, USA
5Rochester Institute of Technology, USA
Correspondence to: Sarhan Hasan, University of Denver, Colorado, USA.
| Email: |  |
Copyright © 2025 The Author(s). Published by Scientific & Academic Publishing.
This work is licensed under the Creative Commons Attribution International License (CC BY).
http://creativecommons.org/licenses/by/4.0/

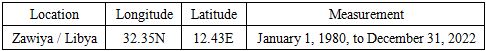
This study investigates the solar radiation field in Zawiya region the Northwest of Libya by analyzing hourly measurements of global and diffuse radiant fluxes recorded at the Zawia site (32.63563 N, 12.57801 E, 17 m above sea level) from January 1, 1980, to December 31, 2020. The collected data was utilized to examine the distribution of radiant fluxes on an hourly, daily, monthly, and seasonal scale. This analysis is crucial for optimizing building energy system design and accurately assessing indoor thermal environments. The findings indicate that the annual summer average of clearness and diffuse indexes are 0.709 and 0.291, respectively. While they are 0.599 and 0.399 respectively in winter season. Additionally, the monthly average daily global solar radiant flux varies seasonally, reaching a peak of (7710 Wh/m²) in summer and dropping to (3669 Wh/m²) in winter. As for diffuse radiant flux, its monthly average daily values are approximately (20121/m²) in summer. and (1405 Wh/m²) in winter.
Keywords: Solar radiation, Clearness index, Diffuse index, Global radiation, Diffuse radiation
Cite this paper: Sarhan Hasan, Aref M. Alkelani, Ahmed Altaher Zuglem, Abdelhamid Elgzil, Osama Ali Elhenshiri, Reda Elbahi, Seasonal Analyses of 40 Years Records of Solar Radiation Data in Zawiya Region Northern West Part of Libya, Energy and Power, Vol. 14 No. 2, 2025, pp. 23-29. doi: 10.5923/j.ep.20251402.01.
1. Introduction
- The Sun is the primary source of energy for Earth. It determines the planet’s surface temperature, shapes the atmosphere above, and drives a wide range of interconnected radiative, dynamic, and chemical processes. These processes lead to numerous interactions between the land, oceans, and atmosphere, which together create the conditions necessary for life on Earth. With the increasing focus on renewable energy, accurate measurement and analysis of solar radiation play a vital role in the design and optimization of solar power systems. Regions with high solar potential, such as those located in the solar belt, can significantly benefit from harnessing solar energy for sustainable development. Solar radiation is the primary energy source driving Earth's climate system and influencing various fields such as renewable energy, agriculture, and atmospheric science. The study of solar radiation includes its characteristics, influencing factors, measurement methods, and applications in solar energy systems. Understanding solar radiation is crucial for optimizing photovoltaic (PV) systems, climate modeling, and energy resource planning.The amount of solar radiation received at a particular location depends on various factors, including latitude, altitude, atmospheric conditions, and time of year. The clearness index is commonly used to assess the atmospheric influence on solar radiation by comparing the terrestrial global radiation to extraterrestrial radiation [1]. In addition to that, solar radiation is influenced by the natural variability of cloud cover, fluctuations in aerosol and greenhouse gas concentrations, including water vapor, and cloud-related feedback mechanisms. While greenhouse gases do absorb solar radiation, their overall energetic impact remains relatively minor [2]. Due to absorption and scattering processes, the Earth system reacts differently to the sun's energy across various regions of the electromagnetic spectrum. The atmosphere fully absorbs solar radiation at wavelengths below 295 nm; this ultraviolet energy plays a key role in both the formation and breakdown of ozone, significantly influencing the dynamics and temperature of the middle atmosphere [3]. Earth’s radiation budget is determined by the balance between incoming solar radiation—some of which is absorbed or reflected by the surface and atmospheric elements like clouds and gases—and the outgoing radiation emitted by the Earth–atmosphere system at infrared wavelengths [4]. Solar radiation data plays a fundamental role in designing efficient solar energy systems. Previous studies point to the significant impact of solar radiation on PV performance and stress the role of solar tracking technologies [5]. Solar energy is regarded as a safe, efficient, and cost-effective source of power, with the potential to become one of the primary energy resources in the near future. Solar radiation variability has significant implications for global climate patterns and energy production. Research has explored global dimming and brightening and found that variations in atmospheric pollutants and cloud cover can alter the levels of solar radiation reaching the Earth's surface [6]. The clearness index is a key parameter used to assess the impact of cloud cover on extraterrestrial radiation. It is a time-dependent and seasonal stochastic variable, meaning it changes unpredictably throughout the day and year. As such, it can be treated as a random variable whose future values can be forecasted within a certain range using statistical analysis of historical data [7]. By calculating the clearness index, which reflects the sky condition at a particular location, one can estimate the amount of solar radiation received on a horizontal surface [8]. As solar radiation passes through the Earth's atmosphere, some of its energy is scattered and some is absorbed. These processes significantly alter the spectral energy, thereby modifying the original extraterrestrial spectrum. The scattered radiation is called diffuse radiation. In numerous developing countries, including Libya, obtaining solar radiation measurements is challenging because of financial or technical limitations. This paper aims to seasonal analysis solar radiation measurements and weather indices, including the clearness and diffuse indices, to assist designers and engineers working in the solar energy sector in the Zawiya region of Libya.Solar DataThis study is based on data from a renewable-energy platform that enables simulations of hourly power output for solar plants anywhere in the world. The team behind the platform provides these datasets." The Renewables teams a collaboration between Stefan Pfenninger and Iain Staffell, who both research the effects of integrating renewable technologies into our energy systems. The data is available via Renewables. Ninja are licensed as Creative Commons Attribution-Noncommercial 4.0 International (CC BY-NC 4.0), meaning you are free to copy, redistribute and adapt them for non-commercial purposes.The National Oceanic and Atmospheric Administration (NOAA) Climate Data Record program defines a climate data record (CDR) as the sustained and routine generation of products using observational records. The ninja works by taking weather data from global reanalysis models and satellite observations. The two data sources are NASA MERRA reanalysis [9] and CM-SAF's SARAH dataset [10,11] Solar irradiance data is converted into power output using the GSEE model (Global Solar Energy Estimator) written by Stefan Pfenninger [12]. Figure 1 illustrates the location of Zawiya city on the map of Libya, which is the focus area of this study, while Table 1 presents the geographical coordinates of the city.
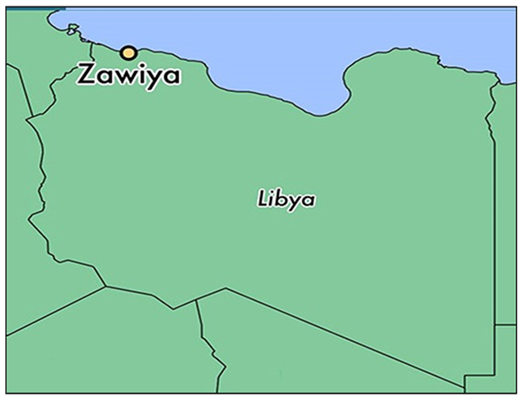 | Figure 1. The Zawiya region on Libyan map |
|
2. Methodology
- Extraterrestrial solar radiation:Daily extraterrestrial solar radiation
 refers to the amount of solar energy that reaches the top of Earth’s atmosphere on a given day, measured in watts per square meter (W/m²). This value is influenced by the Earth’s distance from the Sun, which changes slightly throughout the year due to the elliptical nature of Earth’s orbit. The extraterrestrial radiation is higher during perihelion where the closest point to the Sun and lower during aphelion where the farthest point. This radiation serves as the upper limit for solar energy reaching the Earth’s surface and plays a key role in determining the potential for solar energy generation, climate conditions, and overall energy balance. The amount of extraterrestrial solar radiation received on any particular day can be calculated based on the specific date, latitude, and the Earth-Sun distance, making it an important factor in meteorology, solar energy studies, and climate science.Global radiation:Global radiation (H) is the total solar energy received at the Earth's surface from the sun. It includes both direct sunlight, which reaches the ground without interference, and diffuse radiation, which is sunlight scattered by clouds, dust, and atmospheric gases. This radiation is a key component of the Earth’s energy balance and plays a vital role in various natural and human-made systems. It influences weather patterns, climate, and plant growth, and is especially important in the field of renewable energy, where it determines the potential for solar power generation. Global radiation is measured using instruments like pyranometers and is usually expressed in units such as watts per square meter (W/m²) or kilowatt-hours per square meter per day (kWh/m²/day). Accurate measurement and understanding of global radiation help in climate research, agricultural planning, and the development of efficient solar energy systems.Diffusion Radiation:The diffuse radiation
  is the portion of solar radiation that reaches the Earth's surface after being scattered by molecules and particles in the atmosphere. It is a component of global radiation, which is the total solar radiation received on a horizontal surface.
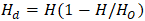 | (1) |
 = diffuse radiation
  • H = Daily global solar radiation received at the Earth's surface
  •
•  = Daily extraterrestrial solar radiation
  received at the top of the atmosphereThis study is seasonal study where the winter season extends from December 1st to February 2nd of the following year, while the summer season extends from July 22nd to September 20th of the same year in Libya.Clearness index
  The daily clearness index, utilized in this study to analyze variations in solar radiation over time, is the ratio of the daily global radiation received on a horizontal surface at ground level (W/m²) to the daily extraterrestrial radiation (W/m²) on the same surface. This index serves as a broad measure of the scattering and absorption processes occurring in the atmosphere due to aerosols, gases, and clouds, which influence the transmission of solar radiation. The ratio of the daily terrestrial global radiation (H) on a horizontal surface to the daily extraterrestrial radiation
  on the same surface is known as the clearness index
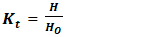 | (2) |
 •
•  = Daily extraterrestrial solar radiation
  received at the top of the atmosphereThe clearness index
  is a dimensionless quantity that represents the fraction of extraterrestrial radiation that reaches the surface after atmospheric attenuation due to clouds, aerosols, and gases.Typical Ranges of
  •
•  Very cloudy conditions or high atmospheric attenuation•
  : Partially clear to mostly clear skies•
  : Very clear sky conditions (minimal atmospheric attenuation)The diffuse fraction
  The daily diffuse fraction of global radiation
  is the ratio between the daily diffuse radiation
  and daily global radiation
  . The diffuse fraction is an indicator of the proportion of scattered light. It serves as a critical parameter in solar energy modeling, agriculture, climatology, and building design, as it reflects the proportion of scattered (diffuse) solar radiation versus direct beam radiation received at the Earth’s surface.
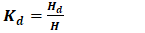 | (3) |
 = Daily diffuse solar radiation• H = Daily global solar radiationInterpretation:• A higher diffuse fraction (closer to 1) indicates cloudy or hazy conditions with less direct sunlight.• A lower diffuse fraction (closer to 0) indicates clear-sky conditions where most of the radiation is direct.Typical Ranges:• On clear days, the diffuse fraction is usually around 0.1 to 0.3.• On overcast days, it can exceed 0.8 or even approach 1.0, meaning almost all the light is scattered.This ratio is useful in solar energy modeling, photosynthesis studies, and climate monitoring, as the amount of diffuse light significantly affects how light penetrates environments like plant canopies or urban areas.
3. Results and Discussion
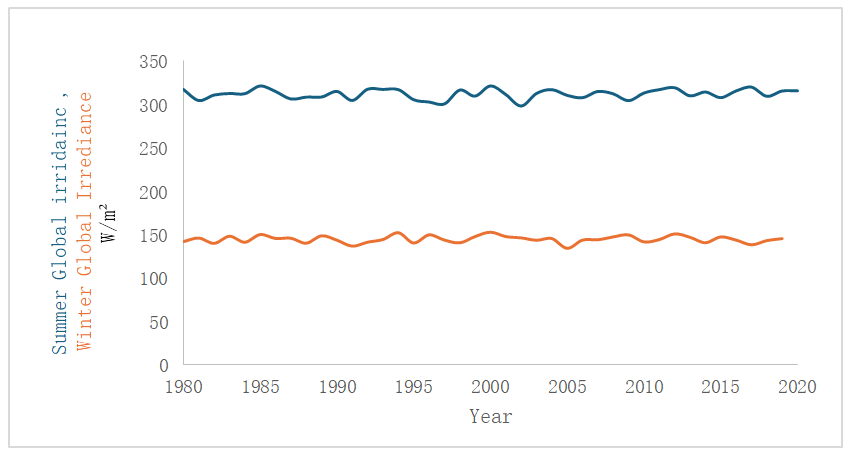
- Figure 2 illustrates the seasonal variation in global solar irradiance for both summer and winter in the Zawiya region. During summer, the region receives a high daily average irradiance of 312 W/m², with peak levels reaching up to 321 W/m². In winter, although solar input is lower, the daily average still reaches 145 W/m², with a peak of 153 W/m². Correspondingly, the total peak daily solar energy amounts to 7710 Wh/m² in summer and 3669 Wh/m² in winter. These consistent and appreciable irradiance values throughout the year demonstrate the region’s strong potential for solar energy production, making it a promising site for the efficient harnessing of solar power. Furthermore, Figure 3 presents the long-term variation in global solar irradiance energy in wh/m² for both summer and winter over a 40-year period, reinforcing the region’s reliability and viability for sustainable solar energy development.
 | Figure 2. Summer and winter global irradiance power variation season 1980-2020 |
 | Figure 3. Summer and winter global irradiance energy variation season 1980-2020 |
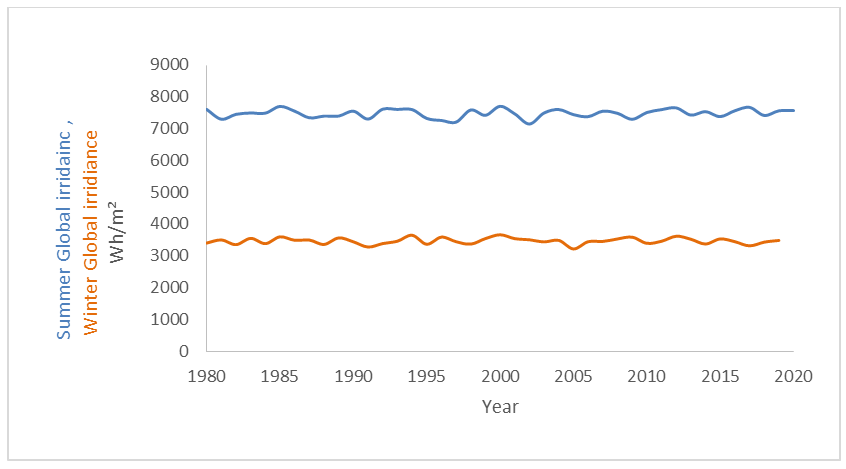
 | Figure 4. Summer and winter diffusion irradiance power variation season 1980-2020 |
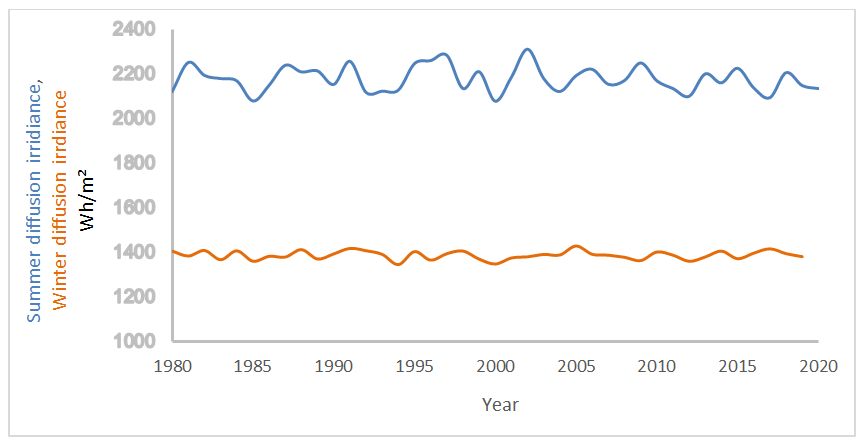 | Figure 5. Summer and winter diffusion irradiance energy variation season 1980-2020 |
 of 0.29 means that 29% of the total solar radiation reaching the surface is diffuse radiation—scattered by molecules, aerosols, and clouds in the atmosphere—rather than direct sunlight. This level of diffuse radiation is moderate and typically occurs under partially cloudy or slightly hazy conditions. While direct sunlight is stronger and more focused, diffuse radiation is important because it still contributes to the total solar energy received, even when the sun is not directly visible. A
  of 0.29 indicates a fairly clear atmosphere with some scattering, which can be beneficial for solar panels, especially those that can capture light from a wide range of angles, such as bifacial or tracking systems. Figures 6 and 7 illustrate the variations in both
  and
and  over the forty-year study period during the summer and winter seasons.
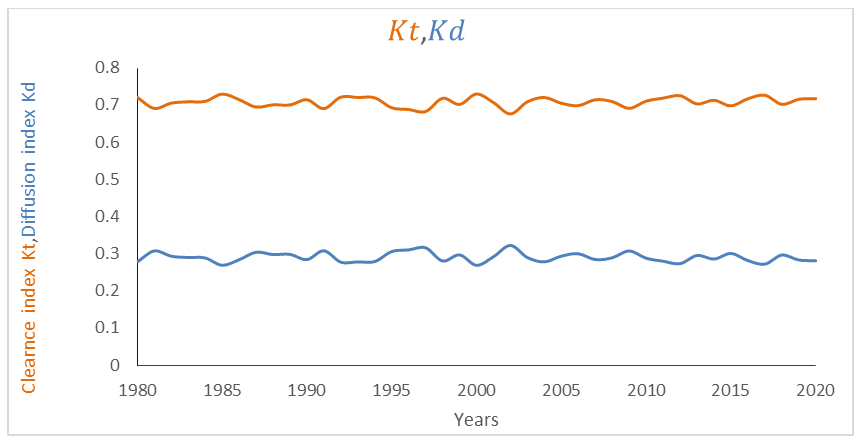 | Figure 6. Clearness index and Diffusion index in summer season 1980-2020 |
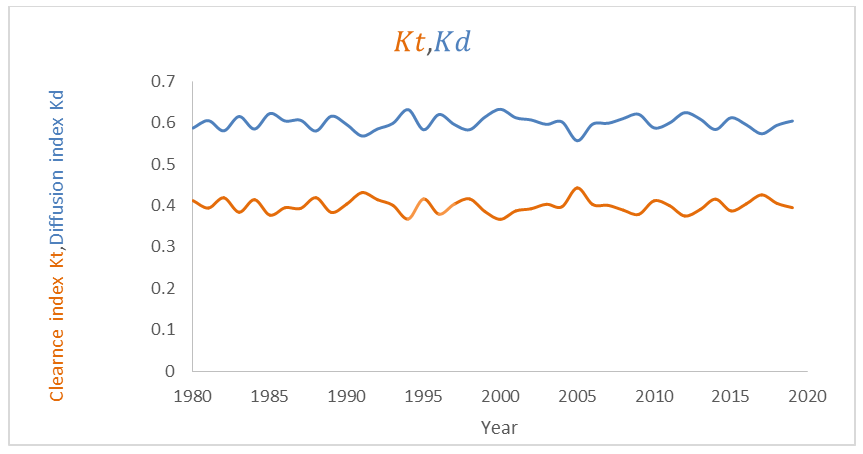 | Figure 7. Clearness index and Diffusion index in Winter season 1980-2020 |
 of 0.399 in the Zawiya region during winter means that approximately 39.9% of the total solar radiation reaching the ground is diffused, having been scattered by clouds, aerosols, and other atmospheric particles. This value suggests partly cloudy or hazy conditions, which are common in winter due to increased humidity and atmospheric instability. While diffuse radiation is less intense than direct sunlight, it still contributes significantly to the total solar energy available. For solar energy systems—especially those with fixed or tilted panels—this level of diffuse radiation can be beneficial, as it allows energy capture even when the sun is not directly visible. However, the presence of nearly 40% diffuse light also indicates that direct beam radiation is reduced, which may lower the overall efficiency of concentrated solar technologies. Overall, the
  value of 0.399 reflects a moderate level of atmospheric scattering, typical for winter conditions in the region.
4. Conclusions
- The goal of this analysis is to support both designers and users in assessing the solar energy potential of the Zawiya site. A comprehensive review of the findings reveals a clear seasonal variation in solar radiation levels across winter, spring, summer, and autumn. As a result, it is recommended that designers adopt a seasonal tracking strategy for solar systems, which can be more cost-effective than continuous real-time tracking. The Zawiya region shows strong potential for solar energy use. The study reports annual summer average clearness and diffuse indices of 0.709 and 0.291 respectively, indicating predominantly clear skies throughout the year. The highest average daily global solar radiation occurs in summer, reaching 7710 Wh/m², while the lowest is in winter at 3669 Wh/m². For diffuse radiation, the average daily values are approximately 2021 Wh/m² in summer and around 1405 Wh/m² in winter.