E. C. Merem 1, Y. Twumasi 2, J. Wesley 1, D. Olagbegi 1, M. Crisler 1, C. Romorno 1, M. Alsarari 1, P. Isokpehi 1, A. Hines 3, G. Hirse 3, G. S. Ochai 4, E. Nwagboso 5, S. Fageir 6, S. Leggett 7, J. Offiah 1, S. Emeakpor 8
1Department of Urban and Regional Planning, Jackson State University, 101 Capitol Center, Jackson, MS, USA
2Department of Urban Forestry and Natural Resources, Southern University, Baton Rouge, LA, USA
3Department of Public Policy and Administration, Jackson State University, 101 Capitol Center, Jackson, MS, USA
4African Development Bank, AfDB, 101 BP 1387 Avenue Joseph Anoma, Abidjan, AB, Ivory Coast
5Department of Political Science, Jackson State University, 1400 John R. Lynch Street, Jackson, MS, USA
6Department of Criminal Justice and Sociology, Jackson State University, 1400 John R. Lynch Street, Jackson, MS, USA
7Department of Behavioral and Environmental Health, Jackson State University, 350 Woodrow Wilson, Jackson, MS, USA
8Department of Environmental Science, Jackson State University, 1400 John R. Lynch Street, Jackson, MS, USA
Correspondence to: E. C. Merem , Department of Urban and Regional Planning, Jackson State University, 101 Capitol Center, Jackson, MS, USA.
| Email: |  |
Copyright © 2022 The Author(s). Published by Scientific & Academic Publishing.
This work is licensed under the Creative Commons Attribution International License (CC BY).
http://creativecommons.org/licenses/by/4.0/

Abstract
The essence of unhindered access to wind energy supply in the daily operations of most sectors of the economy from health to agriculture remains very indisputable. With the lethargic power flow in many African nations coupled with scarcity in supplies and the insecurity coming with limited access. The recourse to alternative energy continues to grow. Accordingly, South Africa has emerged as a new frontier of wind energy given the appeal and availability. Known for its low carbon footprint amidst the minimal exposures to the risks of environmental pollution now that nations are saddled with compliance to global protocols requiring the enforcement of mitigation measures in combatting climate change. The prospects of wind power integration into the large energy policy mix have garnered huge momentum in South Africa. Being the second largest economy in the continent with vast raw materials of untapped wind power in abundance in both inland and coast lines in the proximity of two oceans and desert environments. South Africa is better placed to harness the benefits of wind power to sustain its various sectors. Notwithstanding the primacy of conventional power supply, the potentials for wind energy remains widespread with the surge in new facilities coupled with its projections as the likely source of 14% of electricity by 2030 in the nation. Since this comes with ecological, physical, socio-economic impacts and some benefits, no serious efforts have been made to track the state of wind power potentials with a mix scale model. Accordingly, this study will fill that void by assessing the potentials with emphasis on the issues, trends, factors, efforts, and impacts using descriptive statistics and GIS. The results show strong capacities in wind power loads through the presence of new and existing amenities, and the dominance of the study area as a leader in wind assets in Africa. With GIS mappings pinpointing spatial concentration and the spread of wind power loads across states and provinces due to several indicators from economy to the environment. The paper proffered solutions anchored in regular monitoring, robust investment, the design of additional facilities, effective policy, and the development of a regional wind power information system and public education.
Keywords:
Wind energy, Potentials, Assets, South Africa, Africa, GIS, Change and Factors
Cite this paper: E. C. Merem , Y. Twumasi , J. Wesley , D. Olagbegi , M. Crisler , C. Romorno , M. Alsarari , P. Isokpehi , A. Hines , G. Hirse , G. S. Ochai , E. Nwagboso , S. Fageir , S. Leggett , J. Offiah , S. Emeakpor , The Evaluation of Wind Energy Potentials in South Africa, Energy and Power, Vol. 12 No. 1, 2022, pp. 9-25. doi: 10.5923/j.ep.20221201.02.
1. Introduction
The presence of wind assets all over South Africa have served as a vital power source over time. With the growing interests, it is getting widespread [1-3]. The use of wind assets in South Africa shares some similarity like in the other nations, where the resource is utilized as an operating grid network supplier of electrical power with limited environmental effects. Given the benefits, the need for an energy mix expansion prompted a wave in the distribution of renewable power supplies and the machineries worldwide [4-5]. Wind power as a non-conventional energy source, can be gathered from wind turbines and generators. Thus, in the past decades, the non-conventional power marketplace continues to flourish across Africa in a setting deeply endowed in vast renewable energy, with reserves from sun, water to wind. Drawing on Africa’s extensive network of shorelines bustling with outstanding possibilities in wind energy output. Over time, the steady drop in wind power costs enabled an atmosphere fuelled by aggressive investment operations unavailable in conventional fossil fuel power portfolios. In the process, many nations with the physical attributes and raw materials have so far capitalized on the prospects offered in the sector given the shift away from the fossil fuel energy production to major stakes in the emergent non renewables [6-8]. In that way, novel markets built out of the revival have surged in greater proportions that are leading to the influx of transnational firms onto the sector in the orbit of global capital. South Africa as a key frontier and major actor in contemporary wind sector development in Africa, fully anticipates the deployment of some 11,800 MW and 12,500 MW in wind power projects in 2030. Even though such prospects benefit the nation as it readies for the greening of its economy in lieu of the enormous renewable assets therein. Several issues rooted in policy, institutions and physical environment, infrastructure, job loss concerns by the labor unions over the transition to wind power and bureaucratic red tape barriers must be properly sorted out to harness the potentials [9-11].In those circumstances, the utility of clean renewables like wind cannot be overlooked in a nation where more than ¾ (77%) of South Africa’s energy requirements comes from coal utilization for power generation. More so, in the fiscal year, 2014, in which coal accounted for 232 Twh of electric power output nationwide and 2.3% of the globe’s production, South Africa still ranked 6th as a leading generator of power from coal fired plants [4]. Considering the negative ecological footprints of coal based on the risks posed to the environment and the yearly emission levels of 437.37 Mt of CO2 at 8.10 t CO2 per capita yearly [12-14]. South Africa’s Green House Gas discharges far exceeds those of other African nations. The affordable nature of wind energy accords it the added advantages of being sustainable, less pollution intensive, and a revenue generator for landowners in places where wind turbines operate on functional agricultural space [15,16]. This creates an enabling environment as South Africa taps into a dynamic renewable energy market driven by growing infusion of speculative capital into the industry [17]. Based on the upsides, the production environment remains subject to variation as many international actors are stepping up their involvements across Africa [18-23]. Yet, Southern Africa still suffers lethargic electricity supply in a continent with an unreliable power industry where limited access is a daily occurrence to the extent that in the Sub-Saharan Africa region, about 600 million citizens lack electricity [24]. In the case of South Africa, as the main continental leader in the wind industry, the quest for a turnaround in the energy sector resulted in the commencement of Renewable Energy Independent Power Producers Procurement Programme (REIPPPP) in 2011. The plan was initiated in accordance with the nationwide renewable energy goal to optimize the non-conventional industry. Aside from such ambitious scheme, during the first quarter of 2019, the country presided over a huge wind market, worth 2.1GW in operating volume. With the wind energy marketplace in South Africa projected to surge by over 3% by the years 2020-2025, elements like rising population, energy demand and sold projects sparked the surge during 2017-2019. This stems partly from the vast presence of unused and plentiful wind resource and the existence of the smallest wind power costs in South Africa. Furthermore, the nation’s renewable energy capacity is further boosted from the yearly offshore wind energy output level of 44.52 TWh-2387.08 TWh coupled with an ocean depth of under 50m-1000m as calibrated under 2 different scenarios [25-30].Amidst rising demands for decarbonization and sustainability in the 3rd world. Faced with wind energy proliferation, South Africa supports the growth in the renewable power sector since the risks posed by climate change to its resources from water security to agriculture, and shorelines are not isolated. The exposure of the economy to policies outside of its borders and the way it lowers demands for South Africa’s coal given the spread of wind energy is unsurprising. From the spill overs of renewables, the impoverished Eastern Cape province, garnered 51% of South Africa's wind farms allotments. Consistent with the new policy, major banks have shown reluctance in securing financial backings for coal related ventures. Realizing, that the shift towards a low-carbon energy requirement involves capital spending in wind turbines built on precise high-tech tools on wind farms [31-36]. The design of sustainable new wind power networks intended to reduce energy shortfalls [37] requires conservation actions aimed at minimizing the effects on biodiversity [38-39]. With all these attributed to elements from policy to environment, no efforts have been made to track the wind power potentials with a mixscale model. Accordingly, this study will fill that void by assessing the potentials with emphasis on the issues, trends, factors, efforts, and the impacts using descriptive statistics and GIS [40-44]. The paper has 4 aims and sections. The primary 2 objectives cover current issues in wind energy use and assessment of output and capacity trends. The 3rd and 4th aim gauges the potentials and state of wind power distribution and amenities across different regions and the category of the factors, impacts, and current efforts. While the 5th aim is to design a decision support tool. The sections contain the introduction, methods, results, discussions, and the conclusions.
2. Methods and Materials
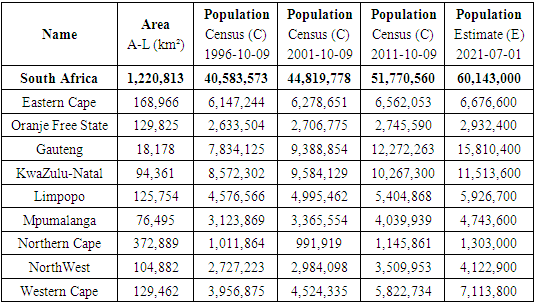
The study area South Africa located at the southernmost region of Africa, lies in between latitude 22° to 35° S, and longitude 17° to 33° E (Figure 1). As an emergent power in wind energy, the country ranks high at number 6 among the globe’s 11 ecologically mega diverse nation considering the enormity of biodiversity [45-47]. Accordingly, the nation stretches through a vast area of land estimated at 1,219,912 km2 (471,011 sq miles), across 9 provinces with some deemed as the wind producing hubs of the rainbow nation. Situated in a viable and thriving zone in the face of ample geographic spread of wind resources [48]. Between 1996 through 2021, the population shifted from 40,583,573 to 60,143,000 at a rate of 48.19% (Table 1). [49,50]Table 1. The Population of South Africa 1996-2021
 |
| |
|
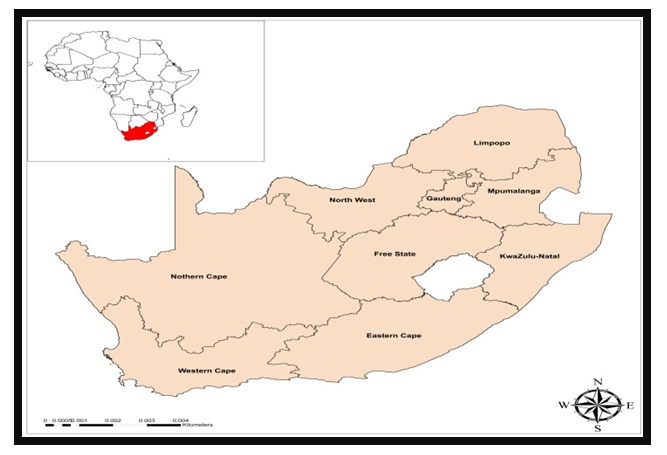 | Figure 1. The Study Area South Africa |
With a long coastline that spans more than 2,500 km (1,553 mi) and along two oceans (the South Atlantic and the Indian). The coastal zone under the south and south-western sections of the Great Escarpment encompasses many varieties of Cape Fold Highlands. With proximity to the coastline dividing, the Great Escarpment from the ocean where the potential for wind energy remains optimal, in the long coastal strip and inland escarpments, ample raw materials for wind power remain. Although the nation boasts of substantial amount of wind power, wind as an energy source is only practical in areas that have strong and steady winds. The provinces with the best wind energy potentials consist of Western Cape, Northern Cape, Eastern Cape, and KwaZulu-Natal [51-54]. Accordingly, South Africa’s estimated average annual wind speed at 10m is 6 m/s [2] coincides with the estimated total wind generation potential of 60 TWh per annum. Under the land availability, in which 410,000 km2 are exposed to wind speeds of more than 6.5 m.s-1. The expectation is that only 1,174 km2 could be allocated to wind farms. Thus, South Africa has fair wind potential, especially along the coastal areas of Western and Eastern Cape. Currently, in terms of facilities, the Klipheuwel wind farm is operating near Cape Town while the Darling wind farm has been in use since 2007 [55].In the context of the existing renewable power capabilities, it pays to recognize the fiscal and ecological advantages that are associated with wind energy nationwide. This is manifested by the anticipated socio-economic and technological and environmental turnarounds based on employment generation and amenity development. Others consists of revenue creation and rents from land on wind farms and turbines in private lands at $6,800 per turbine. There is also the affordable electricity power access to millions of South African households across provinces in the country [15-16]. Since the power out of South African wind farms occur at affordable prices. The dwindling costs of wind power, prompted partly by technological innovations and large-scale output, continues amidst price surge in conventional non-renewable fossil fuel power despite limited supply. Yet, the state-of-the-art wind power devices are so large and effective in power distribution that just a single wind turbine can generate almost 15 million kilowatt-hours annually. This is adequate in serving the needs of over 5,600 poor and underserved South African households [56-59]. In showing all these, the mix scale model remains vital in the enquiry [60-63].
2.1. Methods Used
The paper uses a mix scale temporal-spatial data approach involving descriptive statistics, energy information and primary data connected to geographic Information Systems (GIS) to display the trends spatially. The spatial information for the research was obtained from the South African Department of Minerals and Energy, Eskom Corporate Technology, The Department of Environmental Affairs, the University of Stellebosch and The Council of Scientific and Industrial Research (CSIR). The other sources consist of the World Wind Energy Association (WWEA) and the University of Cape Town. Essentially, core and relevant wind power statistics, the rankings, and socio-economic, demographics, physical and monetary components of the countrywide and regional and continental non-renewable info on wind markets and projections came from the South African Wind Energy Association, Energy Intelligence, United States Agency for International Development (USAID) and the Global World Energy Council (GWEC) for the periods 2016-2020. While the University of Stellebosch generated the needed national, regional, and state level information on projected deep and shallow water scenarios germane to the optimal delivery of wind energy over time across the nation of South Africa for 2016-2020. In the process, federal geographic identifier codes of the states and region/provinces were used to geo-code available information and the socio-economic and environmental variables contained in the data sets. This information was analyzed with basic descriptive statistics, and GIS with particular attention to the temporal-spatial trends at the national, regional, and provincial level. As mentioned earlier, this was made possible by the retrieval of spatial data sets of shape and grid files from the Global World Energy Council (GWEC), and The South African Wind Atlas, Renewable Energy Applications Map of South African Department of Environmental Affairs. The Council for Scientific and Industrial Research (CSIR) and South African Center of Renewable and Sustainable Energy Studies (CRSES) were also quite useful in the process. Elsewhere, know that the Interactive Map of South Africa’s renewable energy through International Renewable Energy Agency (IRENA), Lawrence Berkeley Lab and the African Clean Energy Corridor zones served in the delineation of vital transmission lines, proximity to load centers and the location of high-quality winds in digital form using ARCVIEW GIS. Part of the spatial data also came from land-use capability and classification maps for the study area. The statistical output of the variables from the spatial units were mapped and compared across time in ARCVIEW GIS. The relevant procedures consist of two stages.
2.2. Stage 1: Identification of Variables, Data Gathering and Study Design
The initial step in this research involved the identification of variables required to analyse changes and trends at the country level from 2016 to 2020. The variables consist of socio-economic and environmental and physical information, including size of land in acres, wind socio-economic development and enterprise development indicators/ values. Generally, the listings extend to variables like rankings and capacity, the power demand, electricity demand, household demand, population, project areas and financing. Aside from the additional economic indicators made up of jobs year to date, foreign investment share, wind share of investment as well as Black South Africa shareholding, operation capacity, household equivalent, top 5 wind markets in Africa and the Middle East for cumulative capacity. The top physical and wind power parameters of importance cover wind mean speed, electricity generation, wind class, potential wind production, transmission work, the number of wind farms, windfarms under construction, shallow water scenario and deep-water scenario. In the same order, comes the physical summary of selected onshore wind projects from bidding window 4 (based on IPP projects), new wind power capacity, other aspects of the installed wind energy capacity, wind towers, turbines, selected onshore wind projects from less, contracted capacity (MW), wind power facilities and power loads, the percentage of equivalents and average values. These variables as mentioned earlier were derived from secondary sources made up of government documents, newsletters, and other documents from NGOs. This process was followed by the design of data matrices for socioeconomic and land use (environmental) variables covering the fiscal years 2016, 2018 through 2020. The design of spatial data for the GIS analysis required the delineation of county, provincial, and national and state boundary lines within the study area as well. Given that the official boundary lines within the nation remained the same, a common geographic identifier code was assigned to each of the area units for analytical coherency.
2.3. Stage 2: Step 2: Data Analysis and GIS Mapping
In the second stage, descriptive statistics and spatial analysis were applied to transform the original socio-economic and land-use data into relative measures (percentages, ratios, and rates). This process generated the parameters for establishing, the extent of change, environmental and physical and economic potentials of wind energy facilities, the activities from the wind farms and various locations and transmission lines and the trends across the regions, provinces, and counties in each locality of relevance in South Africa through measurement and comparisons overtime. While the spatial units of analysis consist of counties, coastal watersheds, region and the boundary and locations where wind power potential and output flourished. This approach allows the detection of change, while the graphics highlight wind power distribution, frequency, the capacity of wind farms in place, those under construction, the size of projected land capacity, electricity production and potential and distribution trends. The remaining steps involves spatial analysis and output (maps-tables-text) covering the study period, using ARCVIEW11. With spatial units of analysis covered in the wind hubs and provinces and regions (Figure 1), the study area map indicates boundary limits of the units and their geographic locations. The outputs for each region and provinces were not only mapped and compared across time, but the geographic data for the units which covered boundaries, also includes ecological data of land cover files and paper and digital maps from 2016-2020. This process helped show the spatial evolution of wind power output trends, the likely potentials, environmental impacts, ecological degradation as well as changes in other variables and elements shaping wind power proliferation and impacts in the study area.
3. The Results
This part of the research focusses on temporal and spatial analysis of the wind energy trends in the study area. Using descriptive statistics there is a prime focus on the analysis of wind energy amenities and capacities in the nation at the regional and state scales, largely on the current state, renewable inventory, and comparative assessment. The other segments cover the projected production of electricity from wind power and market potential of output over the various years along with impact assessment in the evolution of wind energy operations in South Africa. This is followed by the remaining parts of the section encompassing GIS mappings, and the acknowledgement of the factors associated with the changes and potentials in South Africa’s wind power surge and efforts of the actors involved in the turnaround.
3.1. Wind Energy Amenities and the Capacities
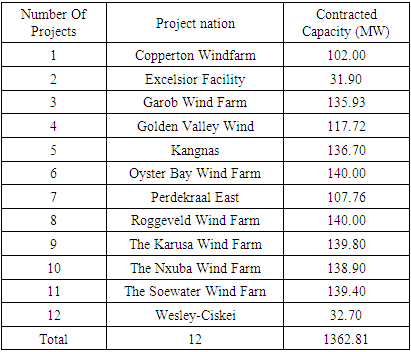
Drawing from a range of energy indicators in the nation of South Africa over the years. It is worth noting that in the face of alternative power abundance. Many onshore wind projects from the existing official bidding window 4, reflect volumes of energy transactions regarding IPP projects in 2018. Out of the total of 12 onshore projects slated for bidding with total capacity load of 1362.81 MW at an average of 113.56 MW. The Oyster Bay and Roggeveld wind farms held the highest contracted capacity of 140.00 MW alongside 3 other facilities (Karusa, Nxuba Soewater) with combined power loads and mean values measured at 418. MW-139.36 MW. In the same category of prime spots in the projects, the wind farms at Kangnas and Garob facilities accounted for capacity values of 135.93 MW-136.70 MW. While a trio of farms Copperton, Golden Valley and Perdekraal East on the second spot held identical power loads of 102.00 MW, 117.72 MW -107.76 MW. Elsewhere, Excelsior and Wesley-Ciskei Wind Energy rounded out the lower (third) tier of facilities with about 31.90 MW-32.70 MW in contracted capacity (Table 2).Table 2. Summary of Selected Onshore Wind Projects From Bidding Window 4 (Based On IPP Projects) 2018
 |
| |
|
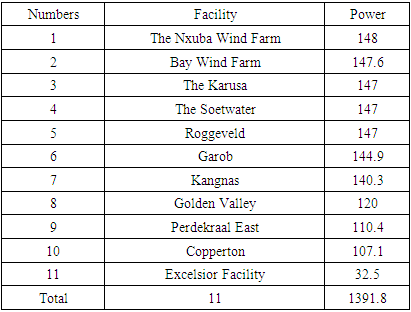
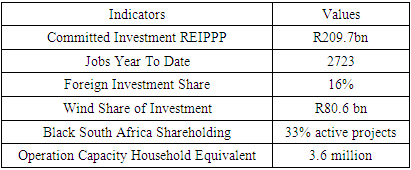
The distribution of currently built wind farms and their capacity in South Africa, cover three categories under a total of 1391.8 MW, and a mean value of 126.52 MW in the amenities. This extends from the development of a quintet of these facilities with the top ones made up of Nxuba, Oyster Bay, Karusa, Soetwater, and Roggeveld at power loads estimated at 148 MW to 147 MW. In the second classification, in which both Garob and Kangnas wind farms hold the capacity for 144.9-140.3 MW. The remaining four facilities at Golden Valley, Perdekraal East, Copperton, and Excelsior wind farms are equipped with electricity power loads of 120 MW-110.4 MW to 107.1 MW to 32.5 MW (Table 3). Considering that the growth of the sector requires adequate capital outlay and entrepreneurial ventures. The profile of the energy index of the nation related to wind power in 2020 shows with R209.7 bn raised through committed investment. The amount of wind power portion of the deals at R80.6 bn resulted in the inflow of foreign investments at the rate of 16%. Under such investment atmosphere, opportunities are enormous for Black South Africa in terms of shareholding with the operation of 33% active projects. This is happening in a nation thriving in operational capacity household equivalent of 3.6 million in the deliverables (Table 4).Table 3. Wind Farms Currently Being Built and Their Capacity In South Africa MW
 |
| |
|
Table 4. Wind Socio- economic Development and Enterprise Development Stats, 2020
 |
| |
|
3.1.1. Renewable Inventory and Comparative Analysis
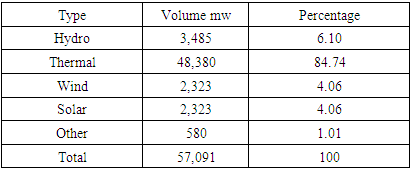
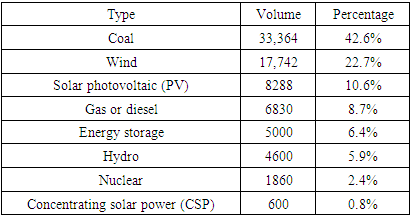
In as much as South Africa’s energy inventory total generation capacity of 57,091 MW in 2018 shows wind power contribution at merely 2,323 mw at 4.06%, far below Hydro and thermal whose loads and rates ranged from 3,485 mw-48,380 mw and 6.10 to 84.74% (Table 5). By the period 2030, among the various energy types, likely to constitute major sources of electricity generation, only coal with 33,364 MW at 42.6% will stand above wind power’s projected loads of 17,742 MW and percentage value of 22.7% while solar, gas, energy storage, hydro, nuclear and the others followed up in mostly single digit values (Table 6). Accordingly, the future prospect for South Africa remains very optimal. Table 5. Energy Generation Capacity for SA, 2018
 |
| |
|
Table 6. All Renewable Energy Industry Likely To Constitute The electricity Generation by 2030
 |
| |
|
3.1.2. Anticipated Production of Electricity From Wind Power and Regional Analysis
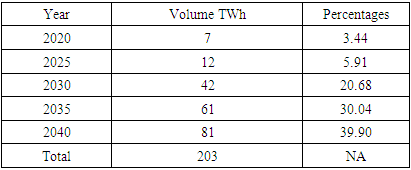
Following projections highlighting a total of 203 TWh in electricity power to be generated by wind energy at an average of 40.06TWh in South Africa between 2020-2040. See that after slowly starts in power output at 7-12 TWh in 2020 through 2025, then comes a rebound of 42 TWh in 2030. From thereon in 2035-2040, the projected electricity generation reaches all-time highs of 61-81 TWh at levels of 30.04-39.90%. This is completely higher than the three previous periods whose levels were 20.68%, 5.91% to 3.44%. This further buttress the robust potentials of industrial power in electricity generation in the country (Table 7).Table 7. Projections of Electricity Generation From Wind Energy, 2020-2040 In South Africa
 |
| |
|
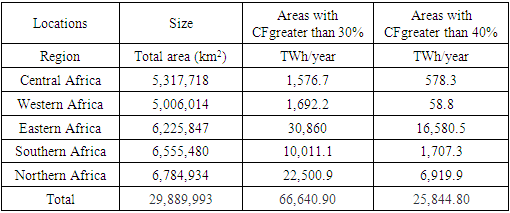
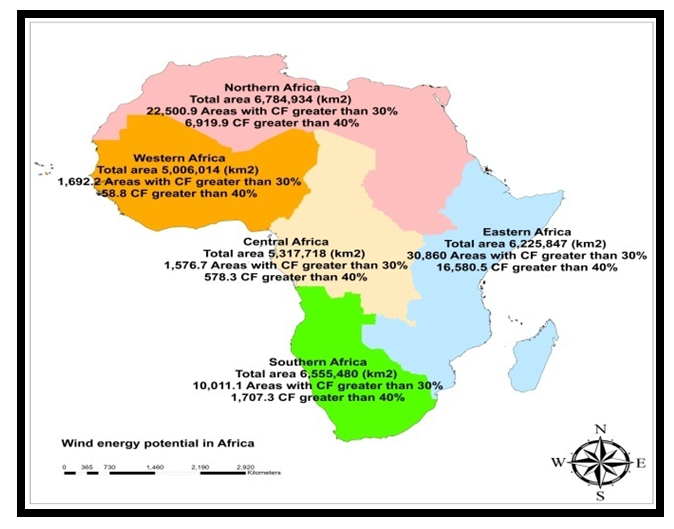
Looking at the extent of wind power potential at the continental level of Africa. The Southern Africa zone encompassing the study area, with its notable total size of 6,555,480 km2 had areas far with greater than 30-40% in 10,011.1to1,707.3 TWh per year in power load that are overly essential in the generation of electricity. Given that the wind power potentials along the study area region only lags the levels in Northern and Eastern Africa where the proportion of loads stands as the largest at 30,860-16,580.5 TWh/year to 22,500.9-6,919.9 TWh/year in places greater than 30%-40%. The region of South Africa still outpaced both Central Africa and Western African Regions whose probable wind power capacities of 1,576.7- 578.3 TWh/year to 1,692.2- 58.8 TWh/year appeared lower in the continent (Table 8).Table 8. Wind Energy Potential in Africa
 |
| |
|
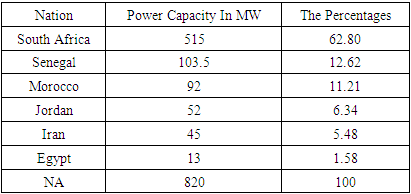
From a much closer look on the primacy of South Africa on its profile as a major frontier of wind energy in 2020, Look no further than the extent of the load capacity in both Africa and the Middle East. Out of the six nations listed at a total value of 820 MW and average of 136.75 MW, the output of South Africa at 515 MW and 62.8% as the data indicates completely surpassed the other areas. This puts South Africa on a much higher level which deeply contrasts with the activities in other nations even though Senegal and Morocco followed up on the second and third spots with 103.5 MW- 92 MW at the rates of 12.62-11.21 percentage points. In the Middle East zone where Jordan and Iran developed fresh capacity of 52 MW and 45 MW, estimated at 6.34%-5.48% in wind power facility, they still occupied numbers 4 and 5 in the ranking. The neighboring nation of Egypt’s capacity of 13 MW on its part, finished last (Table 9).Table 9. New Wind Power Capacity in Africa & the Middle East in 2020
 |
| |
|
3.1.3. Wind Energy Market Potentials
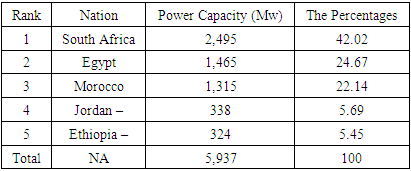
In the context of market potentials, in 2020, the same pattern also holds among the 5 top wind markets for a total group cumulative capacity of 5,937 at mean level of 1,187 MW. Of these markets, South Africa showed a visible dominance with load volume of 2,495 MW representing 42.02% ahead of the group tally. Among the remaining nations, while both Egypt and Morocco on the 2nd and 3rd spots maintained 1465-1315 MW at proportional points of 24.67-22.14%. The nations of Jordan and Ethiopia posted identical values of 338-324 MW and 5.69-5.45% respectively in the fiscal year 2020 (Table 10). Table 10. Top 5 Wind Markets in Africa & the Middle East for Cumulative Capacity in 2020
 |
| |
|
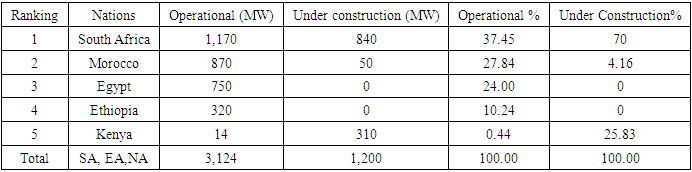
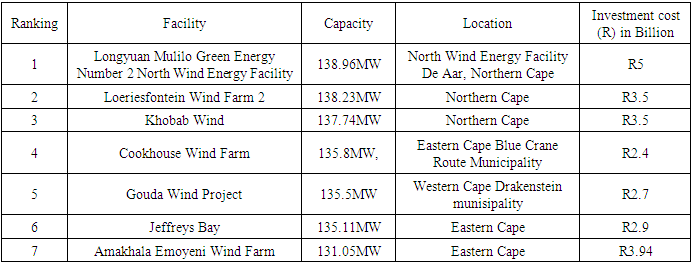
The viability of South Africa’s wind power market potential in 2016 across the five biggest wind markets in the continent of Africa are fully manifested through both operational power loads and those under construction in different countries. With these market activities spread across the regions of South Africa, East, and North Africa, under the initial display of the distribution of operational and development capacities in 2016. South Africa ranked number 1, led in every category by 1,170 MW-840 MW at the rates of 37.45% and 70%. Looking at the other competitors listed on the table, the North African nations of Morocco and Egypt maintained operational loads of 870 MW 750 as Ethiopia and Kenya held only 340-MW14 MW. However, during the same period, only Kenya and Morocco were active in the construction of new wind power facilities with of loads of 301 MW-50 MW as Egypt and Ethiopia posted none. This is indicated from the lopsided nature of the percentage distributions for operational amenities and those under construction which shows Morocco with 27.84%- 4.16% compared to Kenya at 0.44%-25.83% in ventures. Even at that, this left Egypt and Ethiopia partially with about 24.00%-10.24% of the facilities fully operational in the marketplace as well (Table 11). Seeing the largest sustainable energy projects ranked by facility, current location, and the investment costs in South Africa. The Longyuan Mulilo Green Energy Number 2 at Dar in Northern cape Town topped the list with R5 billion along with two other Northern cape amenities at Loeriesfontein Wind Farm 2 and Khobab Wind at the costs of R3.5 billion each. The costings for the other group of 3 facilities (Jeffreys Bay, Amakhala Emoyeni Wind Farm, and Cookhouse Wind Farm) mostly in the Eastern cape area also run in the order of 2 to 3 R billion individually as well (Table 12). Table 11. The five biggest wind markets in Africa, 2016
 |
| |
|
Table 12. Currently the Largest Sustainable Energy Projects
 |
| |
|
3.2. Impact Assessment
From the surge in wind power production activities over the regions and the states in the study area. There are a mix of impacts as manifested with some many upsides at various levels pertaining to the generation of wind power loads and distribution to users in South Africa. This consists of physical, ecological, economic, and technological implications.
3.2.1. Physical and Ecological Effects
The evidence of the actual physical and ecological impacts of wind power have been felt across the South African region through the design of wind related infrastructure germane to power access. Given the needs for coherent renewable energy flow as a measure of for progress in the country. The huge window of opportunities in the design of power facilities transcends everywhere in the country. This started with the development as far back as 2011 of overall 1,170 MW in wind turbine loads and an additional 840 MW presently in the offing. All in all, South Africa intends to invest 8,400 MW in wind capacity by 2030 as Eskom just built a smaller model windfarm within the Klipheuwel area in the Western Cape. Added to that is the experimental location spot at nearby Darling where the initial stage has been brought to closure together with others under consideration elsewhere in the Eastern cape coastline. In further along the physical infrastructure sphere in 2019, Enel Green Power also began the design of 2 wind farms with estimated load values of 140 MW individually. Whereas these amenities are due to be fully functioning towards the end of 2021. They will be contributing immensely to the entire energy load and onto the national network in line with the projected timeframe under consideration. Considering the insights gained since the South African government gave its support to the Darling Wind Farm as a National Demonstration Project in June 2000. As decision support tool indispensable in understanding new ways of tracking energy and the environment interactions. The risks posed to the safety of birds and the eventual mitigation measures involving the switching off and reactivation of wind turbines adjacent to natural habitats or birds flight paths carry major upsides as indicated. The same can be said of the activities within some of the secure control rooms at the sites. Given that this is a testament to the real dangers and impacts of wind energy to biodiversity. The case in point is the kind of measures put into place to prevent needless disasters that would have resulted in the loss of Blue Cranes, Cape Vultures, and species of birds at the 33-MW Excelsior farm.
3.2.2. Economic and Technological Effects
Regarding the fiscal effects of wind energy potentials, South Africa has seen the influx of over USD 4.1 billion into new venture capital for the renewables during 2018. Of this, wind power gulped about USD 2.7 billion. This is considered as the largest throughout the sub–Saharan African zone. With this, considerable increments are underway in the foreseeable future. From the nation’s bold actions, driven by the government of South Africa’ policy instruments. In all these, the wind power marketplace remains on the upside and always forward looking. This is based on the present projections pertaining to power production through wind energy. As part of the benefits that accrues to those directly and indirectly involved, most individual agricultural growers can generate US$6,500 yearly in revenues as part of the rents from the installation of wind turbines on their farm fields. Additionally, the Integrated Resource Plan (IRP) 2010-2013 has also injected many vital changes likely to shape energy management and delivery in South Africa. Under the current IRP, widespread support exists for the extension of present renewable energy bidding scheme with more yearly cycles of 1000 MW in wind power. On the labour side of things, there are contentions over job security uncertainty from other stakeholders, like organized labour. These objections come out of common concerns over job losses among conventional providers of power who feel threatened by the current emergence of renewables including wind energy. The tech impacts of the program involve the innovative measures of Enel Green Group in initiating the design of wind energy across the country. This resulted in the development of a couple of wind farms with 140MW in loads in both the Northern Cape and in the Eastern Cape provinces under the bid window round 4. Under the process, the firm invested in the state-of-the-art techniques for the design of wind farms. The tools encompass cutting-edge electronic forums and system keys to display and distantly sustain field operations and facility openings for production. The project also covers digital tools to carry out and evaluate production excellence and quick assessment of wind turbine parts. These methods and the parameters will ensure a much faster info access needed in enhancing design efficiency, while promoting interaction amongst stakeholders on different locations. Furthermore, the firm has also been actively involved in employment generation and sponsorship of programs aimed at turning around the lives of those in the adjourning communities.
3.3. GIS Mapping and Spatial Analysis
The GIS analysis consists of the visual display of spatial patterns underscoring the ingredients of wind power generation and distribution. This consists of the various parameters of wind mechanics and flow synonymous with their natural occurrences and availability represented. The said indices consist of wind power density and elevation and speed under the corresponding scales vital in the delivery across the various states. Based on the portrayals of the indices in space, the wind amenities in the form of projects, and wind farms currently in progress coupled with the capacity and onshore side across the hubs in South Africa and potentials in Africa, did take center stage. The info conveyed via geo-analytics on several scales and shades denote the potential lanes of the sector. The ability to pinpoint spatial-temporal dimensions of the capacity across sites using GIS as the analytical tool, is very vital in showing the state of wind energy and the capacities in South Africa amidst the ongoing expansion of the sector. The GIS mappings of the trends indicates the dispersion of essential indices of wind energy firmly planted in a couple of spots with further spread onto different parts of South Africa. Looking at the current pace in the study area, the wind power generation, amenities and their capacities and loads seem visibly concentrated along the spots in the hubs where production is feasible with speedy breeze flow in the landscape. In terms of wind power density at 50 M elevation and windspeed distribution in the nation of South Africa. The indicators in the legend distinguished by high to low scales across provinces in the country under the different colors of light orange and purple and the others (yellow, red, and blue) as a measure of the trends, underscores the flow. On the power density side at 50 M, the high and low metrics as calibrated on the legend box and maps shows that the distance values of 8496.77 km denoted in blue color, appears visibly concentrated on the lower side within the Eastern cape province. From there, emerged additional clusters of wind power density on the high point, converged towards the western cape zone at similar scales, while the low range at 3.01887 (in pink/yellow colors) did spread out notably in space to the other provinces (Figure 2).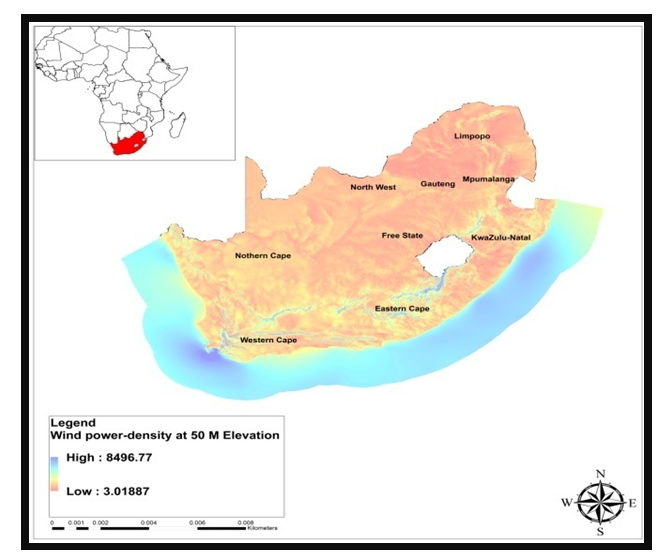 | Figure 2. Wind Power Density at 50 M Elevation a |
Another dimension to the spatial evolution of wind velocity in the study area under 50 M elevation mark stems from the distribution patterns of the dual phases of high and low. Although these patterns similarly held firm in the respective localities of the country with patches of higher scales (at 18.3542 km) inherently prominent as represented in blue. Further looks, show also that the said spatial form gradually diffused onto the lower northeast portions and southeast to the northwest parts of the map. This is in deep contrast to the lower wind scale of 0.928176 km in yellow/ red colors that were fully present on the uppermost side in Limpopo amidst broader spread in the central provinces and the Kwazulu -natal axis as well. From such scenario, based on the contours in place as manifested on the scenario from the map legend box. Clearly, the geographic distribution of the wind speed, once again succinctly affirms the dominance of both the Eastern and Western cape terrains as major sources and sites of the highest levels of wind speed germane to the efficacy of local energy infrastructure. This is consistent with the mandate in the respective places in the delivery of wind power by the renewable energy sector of South Africa under that category of elevation. (Figure 3).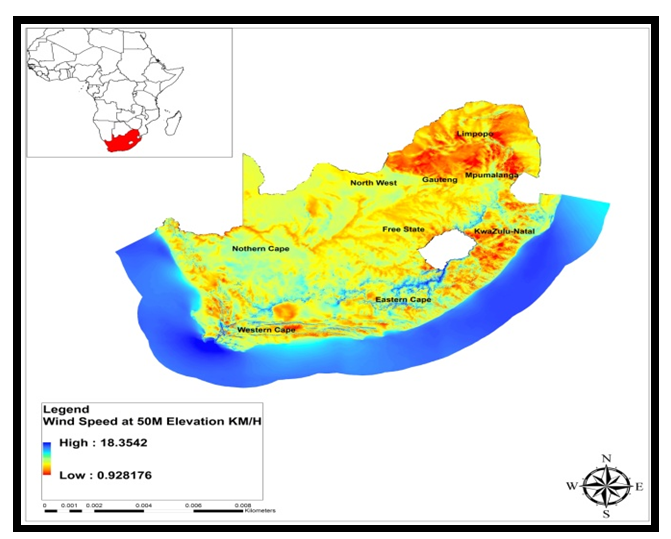 | Figure 3. Wind Speed At 50 M Elevation b |
Looking at the wind speed occurrence at 10m elevation level in South Africa on the different sites across the country under the designated scales of 20,6897-0.337878 in the high and low categories of purple/light green and yellow /red. Once again based on the scope of the forms as indicated in the previous patterns manifested in the spatial analysis. The patches of highest points of the wind speed at 20.6897 runs through portions of the Northern edges of Kwua Zulu/ Natal landscapes down unto the Eastern cape area in light blue as the same geographic forms continues deep into the western cape zone. Further along those lines, the Limpopo area in the northmost part and at the lower scale of the wind speed of 0.337878, showed a pattern (a mix of light yellow and red colors) deemed meagre in terms of distribution. This is followed by similar ranges slightly evident all through lower Kwa-zulu, and the Eastern and western cape provinces as well. Under that same category, see that the vast portion of areas extending to the northern cape, the northwest and the free state areas covered in yellow exhibited similar attributes in space as well (Figure 4).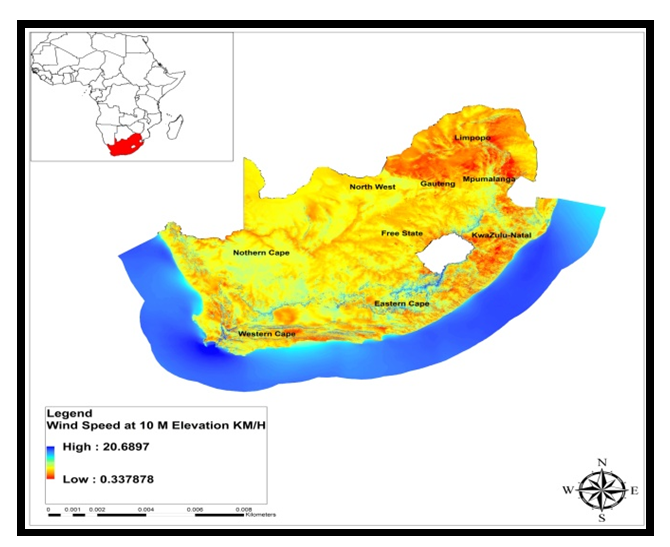 | Figure 4. Wind Speed At 10 M Elevation a |
From the wind power density map under the 10 M elevation scale as illustrated in the high-low size values of 13592.7 to 0.126764 (in light purple, green/ yellow and pink). See that the patches of the areas in the high phase of the wind power density (light purple/green) stretches in between the Kwa-zulu land corridors, to the geologic provinces of the Eastern and Western cape areas. This is somewhat different with the rapid spread in space of the lower scale (of 0.126, 764) whose coverage appeared exceedingly robust (in mostly pink colors) across the remaining areas in the nation (Figure 5).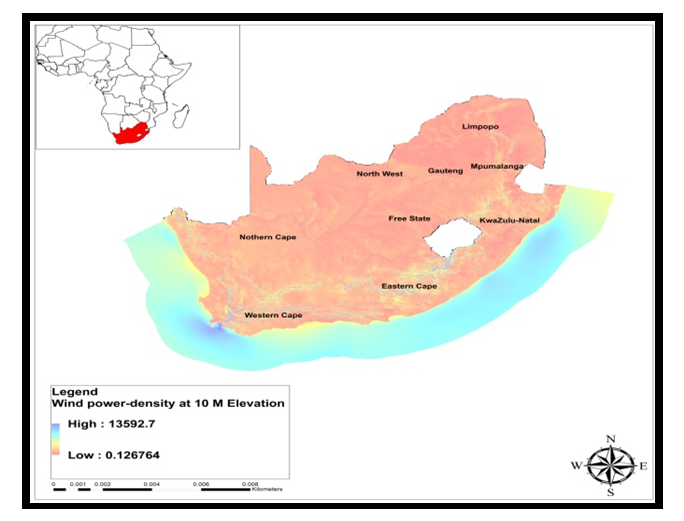 | Figure 5. Wind Power Density at 10 M Elevation |
In the context of the 200 M elevation scale classifications based on the high and low values of 17.2342-2.35621 kms (mostly light blue and purple/mild green) in wind speed and wind power density. The spatial distribution form embodies clusters of areas in the upper Kwa-zulu zone under higher level of 7.2342. With that came visible spread further into the neighboring areas with extensions way into the Eastern cape, and Western cape in the lower Southeast zone of the country coupled with notable clusters deep into the adjoining areas in the Northern cape province side of the map. Added to that are pockets of axis denoted in yellow and red that are associated with low velocity scales of 2.358621 that are visibly present in the provinces of Limpopo, the lower parts of KwaZulu natal and isolated patches of spots in the western cape also (Figure 6).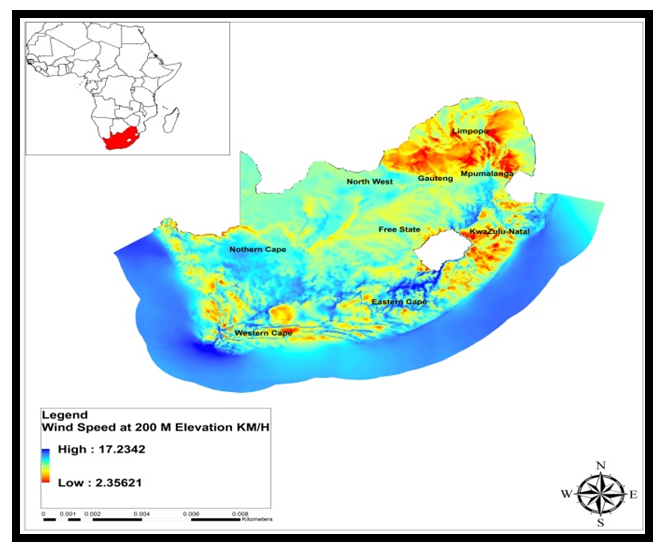 | Figure 6. Wind Speed at 200 M Elevation |
The wind power density values of high-low phases at 5044.96 to 28.36774 as indicated from the map under the light purple/ light green remained mostly in parts of KwaZulu natal with extensions into the Eastern Cape and western cape. On getting into the other provinces, spots in light red under the low scale of 28.367 emerges much solidly along the Limpopo portions in the north and other provinces coupled with landscapes under the lower range in yellow colors. Other than that, the areas covered under the lower scale loads were fully visible in space across the nation at the 200m elevation scale (Figure 7).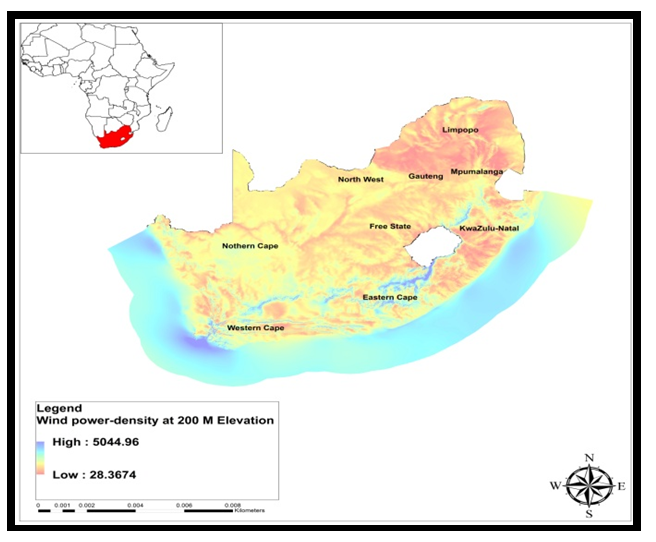 | Figure 7. Wind Power Density At 200 M Elevation |
The south African nation really means business when it comes to the siting of wind power projects. Given the connections with the commitments to energy security in the provinces over the last several years. The importance of the volume of wind farm activities in the lower south of the nation and in the North cape area cannot be overlooked. From the map info, while the eastern Cape still boosts of some of the largest sustainable energy projects beginning with Amakhata Eomoyeni wind farm in upper area and Coockhouse wind farm and Jeffreys Bay Wind farm with power loads of 131 MW, 135.5 MW to 136.11 MW. The spatial distribution of the major wind farms shows a gradual concentration of these facilities firmly planted around the neighboring province of western Cape within a pair of farms (Obuda wind project, and the Longyyuan Mullion green energy project) operating under slightly identical capacities estimated at 135.5 Mw to 138.96 MW. Onto the Northern zone at Northern cape, are Logricsfoniun wind farm and Khobab farm powered by 138.23 MW-137.7 MW (Figure 8).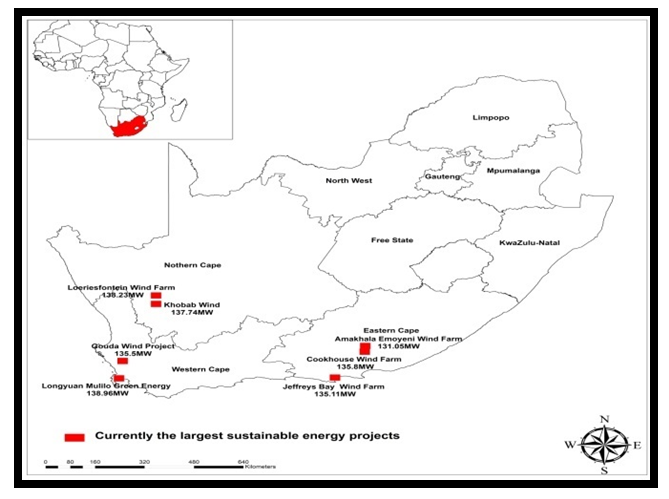 | Figure 8. Spatial Distribution of Largest Sustainable Energy Projects |
While the same patterns hold for the windfarms that were currently built and the potentials in the nation. The onshore wind distribution spots essential in the provision of energy as they are, stretches from Limpopo west and Mpumalanga North onto Kwa zulu natal East. This is like the other two spots along the Eastern Cape southeast and central areas. From there on, the trend shifts gradually into multiple sites in the Western Cape town area. Even among the regions in the continent of Africa, South Africa still stands on its own in terms of wind energy potentials under the various measurable statistical indicators (Figures 9-11).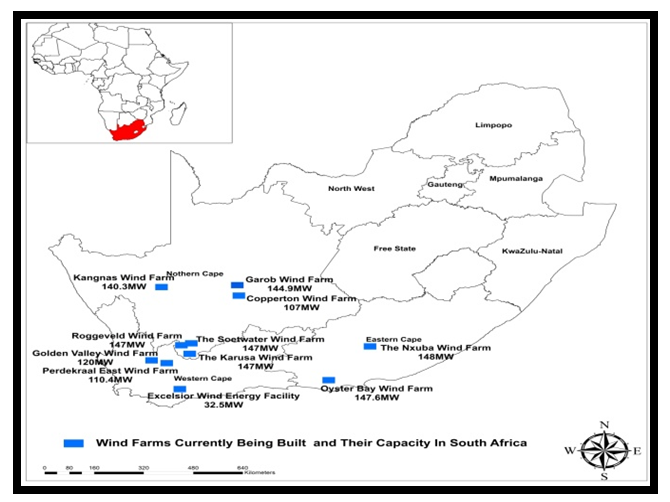 | Figure 9. Spatial distribution of Farms Currently Built and Their Capacity |
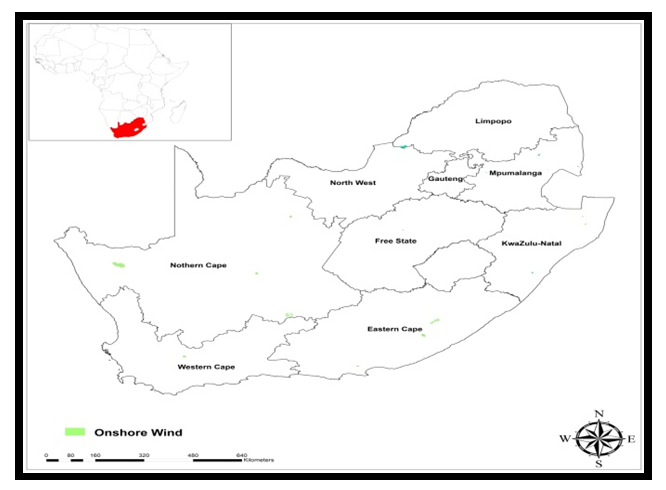 | Figure 10. The Geographic Dispersal of Onshore Wind Power |
 | Figure 11. Africa’s Wind Energy Potential |
3.4. Factors Shaping Wind Power Momentum
The important elements that were instrumental in advancing the expansion in wind energy potentials in South Africa did not happen in isolation. They are linked to different policy, socio-economic, and physical factors. These elements are described below one after the other.
3.4.1. Policy Elements in Place
The growing capacity of wind power in South Africa cannot be isolated from the current state of policy making process in the country. Since the inception of many of the wind power programs fuelled by policy instruments and the start-ups, initiated under the EIPPPP bid window round 4. Several breakthroughs have occurred beginning in April of 2018, when South African government moved the long awaited PPAs onto action. This in turn made independent power producers (IPPs) to reveal their definitive venture capital targets and choices. Since the actualization of robust plans and the government’s legal actions accelerated the proliferation of wind power in the nation like in several regions across the globe. Such practices which often require the infusion of monetary inducements along with novel regulatory standards as part of the subsidy framework, enables small scale power clients obtain wind energy and other non-conventional supplies of power. Against that background, wind energy emerged as a key supplier of power in South Africa, based on the design of ambitious schemes for the development of wind farm facilities. For that, the 2019 government support for Integrated Resource Plan (IRP) highlights augmented spending allotments that elevated wind power production as a priority in the nation’s energy program. This puts wind power in the mix as the projected provider of 20% of South Africa’s energy by 2030 under the most current IRP.
3.4.2. Economic Forces
The enviable spot of South Africa’s wind power industry in the entire continent of Africa could not have happened in the absence of a viable investment climate. Given the public biddings for multiple ventures backed by bold aims. The nation is spending considerably in the rapid expansion of wind power. Although, the preliminary expenses associated with wind energy connection in the design of fresh power lines and the postponements of brand-new ventures could be a drag in marketplace. The optimism across wind power markets in South Africa in the fiscal year 2019 led to the development of over 2000 MW loads in wind energy. Just as nearly a dozen other projects are on the design and preparation phases, the wind power sector of South Africa remains on the verge of unprecedented surge in line with officially projected timings. With such a formidable growth path in place for companies therein, South Africa is fully on track to having a prolific growth in the wind power sector, judging from the size of prospective private operators in the industry. This comes as more 500 MW size facilities slated for a roll out by the nation’s investors, are all to be in South Africa. With the billions of dollars at its disposal and the low expenses in energy production at South African wind farms under current climate. Surely, the sector stands to gain enormously from the dwindling costs of wind energy. These soaring processes are further evidenced in the 4 tendering phases organized by the Department of Energy’s Renewable Energy Independent Power Producer Procurement Programme (REIPPPP) until now. Since this occurred under average prices in round 4 of the bidding estimated at only 62c/kWh. This is much lower than the price tag of R1.38/kWh from the proposed coal fired power station, Kusile during the inception in 2019.
3.4.3. Demography and Population
Throughout the Southern Sub region of Africa, South Africa as the largest nation, has over the years, experienced double-digit population increases at the provincial and city levels. Such pace of population explosion is overstretching South Africa’s aging power infrastructure and its energy resources while disrupting both the economy and communities. Being a recurrent issue responsible for electricity outages and short supply of power. It is partly attributed to the uptick in the local consumption of electricity amidst pressures from the rapidly growing population and other necessities dictated by surge in market operations. Added to that are the increased development in the design of new settlements requiring more power use for their daily activities. There is also the limited infusion of funds to ensure the upgrade, servicing, and replacement of vast network of obsolete power facilities. With big cities like Johannesburg expected to be burdened by population surge of geometric proportions in 3 to 4 decades. The current strain will push the over stretched power networks beyond limits in meeting the needs of more residents. With South Africa developing its power facilities for the foreseeable future. The disbenefits of fossil fuels and policy shifts has enabled the switch to renewable resources like wind power as a regular component of the energy mix, hence the proliferation. Thus, in response to the energy issues encountered nationwide, coupled with limited access to power supply in the countryside and carbon footprints from coal output and usage. South Africa wasted no time in promoting plans integrating renewable power sources like wind onto the nation’s energy mix.
3.4.4. Physical Environment
Another twist to the impressive state of wind energy in South Africa stems from the role of physical factors in expanding the sector. Drawing from the plethora of raw materials of energy and the ecologically benign nature of wind power. The fact that the investors are benefiting from wind power endowments diffused across the coasts is a testament to the essence of the environment as a catalyst. This may not have happened had it not been for the physical attributes and geology of the nation since the raw material of wind exists along the trio of cape provinces. Because South Africa boasts of reasonable wind capacity, with the proper geographic spread near the shorelines of Western and Eastern Cape and the proximities to both the Indian and Atlantic oceans. Such capacity has not only been turned into major assets in the supply of power. But the resource serves ample use when fully harvested in places containing robust breezes made possible by the geology in the study area. With such natural endowments fully diffused across the major sites in the country and wind power known to have the second highest potential in the three Cape provinces. The sector has now fully tapped into the production of non-renewable power through the design wind farms situated at 30km west of Port Elizabeth. Ranked highly among the initial ones to be built, the facility draws heavily from the solid wind from the Indian Ocean at points exceeding any place in the zone. The other aspect consists of the low carbon footprint and the operations of wind turbines on farms.
3.5. Efforts and Initiatives
Considering the unprecedented expansion of wind power as a viable alternative source in a nation heavily dependent on coal fired power plants to generate electricity. The current ecological and economic benefits and policy shifts has sparked a turnaround. Accordingly, actions are being initiated among a host of government entities and other actors to consolidate the gains and advance the sector in South Africa.
3.5.1. Institutional Initiatives Aimed at the Wind Sector
In the context of efforts to sustain wind power in Africa. From every indication, South Africa remains actively involved through the promulgation of policies favorable to the elevation of wind power development as the center piece of its renewable energy plan. The policy prescriptions delivering wind energy nationwide encompasses the government white paper on renewable energy, the national energy Act, the integrated energy plan, and the integrated resource plan. With wind power positioned to becoming a key power supplier in South Africa, several strategies are on track in the building and introduction of wind farms in the nation. Out of the existing policy framework, the articulation of South Africa's Renewable Energy Independent Power Producers Procurement Programme prompted the launching of over 30 wind projects.Granted South Africa’s technological advances and the endowments in natural resources and wind assets, it has been besieged by recurrent power failure associated with nations in Sub Saharan Africa. To help turn it around, the GEF-funded South African Wind Energy Programme through the assistance of the Technical University of Denmark (RISØ) stepped up actions. The program initiated the amplification of an intermediate level wind atlas built on supercomputer replications and standardized through exact wind dimensions in planned sites. This program which commenced in November of 2008 and finished in December 2012 requires Atlas data regular publication on specified publicly accessible internet site. Elsewhere, in 2009, GTZ's TERNA Wind Energy Programme in collaboration with the Western Cape Department of Environmental Affairs and Development Planning (DEA&DP) and Eskom undertook a scientific based enquiry focused on assessing the impacts of adding wind power on the diffusion network. Additionally, BioTherm Energy’s Excelsior Wind farm partnership with local conservation groups to lessen the industry’s effects on local bird communities as an ongoing venture good for biodiversity, limits the mortality of birds. This has resulted in the coexistence of conservation and renewable energy platform that strengthens one and another.
4. Discussion
The study emphasized the state of wind energy potentials and the uses across South Africa. With that came the display of robust flow of wind power for electricity generation and other services. This is in meeting the needs of communities given the emergence of renewable wind infrastructure as power source from the sector. Out of this option and the growing quest for alternative energy expansion, South Africa now represents a new frontier of wind power transactions benefiting from institutional commitments and access. Drawing from the adherence to low carbon footprints associated with wind energy in conformance to global obligations under climate change convention. There are opportunities for the integration of South Africa’s wind power into the larger energy policy being the largest wind market in Africa. Accordingly, mix scale model of descriptive statistics and GIS sharply underlined the links between many socio-economic and environmental and physical indicators in the penetration of wind energy across South Africa. Furthermore, the spatial visualizations of wind indices therein affirm steady spatial patterns indicative of present level of usage, access, and initial priorities. While the GIS identified the concentration, evolution and spread of the specific wind power indices comprising of capacity, density, facility, potential, onshore amenities, and infrastructure under construction on selected sites. This is of considerable importance seeing the part of wind power in water preservation and CO2 emission reduction. The inference is major amidst the soaring expenses of hydrocarbon products and the volatility in commodity trades as wind power momentum grows nationwide.The assessment of alternative energy involving wind power also covers the vast inventories of many facilities at localities across the country. Considering wind power’s projected level of 22.7% amongst energy sources in 2030. The potentials as the top wind market in 2020 affirms the primacy of the study area pertaining to cumulative capacity of 42.2% above the group of other producers such as Egypt and Morocco. In the absence of many factors in place, the momentum powering the adoptions of renewable energy, their relevance and impacts would have evolved differently. This position recognizes the importance of policy, socio-economic, ecological, and physical forces behind the shift towards wind energy across South Africa. This is evident from the projected socio-economic and technological and environmental benefits based on the creation of jobs, facility designs and boosts in income made possible by the proactive policies of the government, rising population and demands. Because power supplies from South African wind sources come at lower costs mainly due to latest advances in state-of-the-art technologies and growing output. The physical attributes and geology have been of immense importance considering the abundance of wind flow in 3 cape provinces. As a result, the nation enjoys sufficiency in wind power deposits, with good spatial dispersal along the coastlines in western and Eastern Cape coupled with the adjacency of South Africa to the Indian and Atlantic oceans. With the ecological impacts mostly on the upsides given the risks from conventional fossil fuel sources amidst the benefits of wind energy. Several efforts were made in various ways by the stakeholders from government, the energy sector, and NGOs of South Africa to turn the sector around. This was aimed at ensuring ecologically benign operations built on sustainability by the wind farms without endangering biodiversity and animal welfare. Seeing the newness, the benefits, factors, and effects of wind energy. The study suggests regular monitoring, robust investment, the design of additional facilities, effective policy, and the development of regional wind power info system and public education as the nation readies for the next phase.
5. Conclusions
This study highlighted the growing potentials and trends in wind energy production across South Africa with important outcomes: a) Wind power rising as an alternative source of energy b) Wind energy’s growing potentials evident c); Impacts obvious in the sector); d) The surge in wind energy fuelled by many factors; e) Mix-scale model quite efficient. Without doubt, the rise of South Africa’s wind energy industry over the years really speaks for itself based on the turnarounds. The development of wind assets in South Africa as a component of the energy mix shows the degree to which it evolved into key power source amidst rising demands. This is happening in places where the towering nature of wind turbines into the skies as part of the grid network and power source defines the landscape aesthetics. Such physical presence typifies the extent of wind power infrastructure penetration and how far the nation has come as new frontier in breeze energy. Hence, despite the dominance of coal as a major power source all along. The perceived risks to investors in non-renewable fossil fuel ventures and the reluctance of lenders may have been the ultimate nail in the coffin driving the outright rise of wind power in the nation. This really pushed wind power into the forefront as a source of energy given its growing usage and the multiplier effects. With South Africa’s place as Africa’s leading wind market, the basis for the spark prompted a major national renewable power programming in 2011. In so doing, energy planners are in a better position to keep proper tracking of wind power stocks through effective schemes for meeting the nation’s needs. From the analysis, researchers, professionals, users, investors, and stakeholders can access up to date info on wind energy prospects vital to sustainability and ways of harvesting the asset. The one key thing of importance in this study involves the capacity and abundance of wind power assets in South Africa. Since wind flow blossoms on natural, and geologic settings containing the raw materials supporting strong breeze velocity and movement in multiple directions. The availability of large coastlines forcing wind movements in South Africa extending over 2,500 km (1,553 mi) in between two oceans remain a plus. While this enhances the optimal potentials of wind energy flow to destinations for needy consumers. Being a powerhouse in this department, South Africa has large volumes of wind power, as energy source that can be harnessed in a couple of localities with strong potentials. While these potentials extend from the Western cape to KwaZulu-Natal known for their stable winds. South Africa’s yearly average wind speed (of 10m - 6 m/s) not only overlaps with the overall load of 60 TWh. There are large swaths of land that can be allotted to wind farms as well. Of great importance is the mitigative role of clean wind energy in a country deemed the largest emitter of GHS in Africa in which ¾ of power loads come from coal fired plants. In all these, note that the consolidation of wind energy potentials opens venture possibilities to underserved Blacks through the purchase of shares from projects serving customers. In stressing these potentials, the enquiry injected new tools from which the nation can draw upon as it continues to harness the potentials of wind energy. From the nature of wind energy operations in South Africa, note that much of the known effects carry many upsides starting with the meagre level of CO2 footprint in the sector. This is important considering that the benefits of clean renewables like wind energy in reducing Green House Gas Emissions in a nation whose power production is heavily dependent on fossil fuel fired coal plants runs deep. With coal responsible for 232 Twh of electric power production in the nation knowing the harmful impacts. The fact that electric power production through wind turbine effectively decreases carbon footprints. Expectedly one wind turbine like the one deployed in many farm facilities in South Africa can get rid of at least 1.7 million tons of Green House Gases (GHGs) and CO2 annually, compare this to the production ambient of coal powered plants known to emit noxious pollutants. Just as wind power flow is indispensable in the containment of water deficits through conservation, it has the capacity to save around 52 million litres of water. Further on the impacts, the ecological-economics side of it includes the sustainable nature, the limited pollution intensity and the amount of rent that accrues to landowners on whose terrain wind turbines operate and the investment capital inflow. Even though the revenue generation capacity of wind energy could not have happened in the absence of fiscal spill overs and policy. In 2018, the wind sector garnered 65.8% of all energy investments in the country at levels that surpassed the entire SSA region. In showing these upsides, amidst the risks from conventional fossil fuel sources of energy, the paper remains fully indispensable in gauging the feasibility of the sector.The mounting surge in wind energy power output and usage across in South Africa cannot be separated from some factors starting with the proactive nature of government policy framework. There is also a commitment in moving the sector to another level as an alternative energy source. Given that the launching of several wind power projects was largely propelled from the existing policy tools governments use to deliver on their missions to the larger populace. Beginning with the objectives of the EIPPPP tender window phase 4. This initiative created an enabling environment in 2018 that resulted in a big shift upon which, authorities in South Africa moved the awaited PPAs onto action in a manner that helped producers disclose their investment money levels. With that came a vibrant investment environment and the spark in demands by rising population. In the face of consumer needs and the preference for a reliably available alternative source of energy, mostly driven by these forces and the reactions of the wind energy markets in South Africa in the process. The presence of physical factors predicated on geology across South Africa, where vast swaths of lands enable breeze flow, together with the distribution of wind power on the coastlines of two oceans played key roles. The research in upholding the value of these elements herein, amidst the surge in wind energy, inserted their weight in the industry in a way likely to shape policy debates.The uses of mix scale methodology of GIS and descriptive statistics as analytical tools occurred with greater proficiency. While the process injected novel ideas to a national appraisal of wind energy use. The model remained overly operative in delineating the study area and recognising the trends, together with the assembling of data on the factors and other indicators from wind energy use, installed wind capacity to the number of wind farms. While the technique serves those tasked with appraising wind potentials in Africa. The GIS analysis points to visible concentration and progression in areas where usage has been growing over the years. Accordingly, the GIS mapping as a management tool remained quite valuable in showcasing the dispersion of wind power indices from capacity, density, amenities, the pace of their diffusion and the patterns and scope of their evolution across space. This benefit reflects an important step to effective planning and improvement to previous policy which placed much premium on fossil fuel sources at the expense of renewable power potentials like wind energy in South Africa. The capacity of GIS in showing the patterns of usage, infrastructure presence and potentials over the years is quite important as South Africa gears up with the growing demands for wind energy given the economic and ecological advantages. Locating these potentials improves the capacity of mangers in focusing on wind power as vital alternative energy in the policy discourse in a manner not seen before. Using mix scale tool improves our knowledge of the state of the sector while quickening decision making and the knowhow for managers in framing future debates and the needs of the sector in South Africa.Given the widespread potentials of wind power in South Africa and the risks from carbon footprints of fossil fuel energy and the study outcome. Policy makers will search for serious answers to several queries deemed essential to the future of energy planning. The queries are as follows: How will the authorities ensure equitable rent payment on wind farms belonging to black land holdings? What type of challenges are likely to occur in the process given the infancy of the sector? What essential indices are required in a comprehensive measurement of wind power benefits in South Africa? How would the spatial spread of wind power facilities evolve in the coming years? What elements are likely to influence wind power penetration nationwide? From these queries, sufficient prospects exist for scholarship and practice to ensure that the current momentum towards wind power surge continues to spread and meet the growing needs through effective policy. This could go a long way in ensuring the sector attains its mission on clean energy, access, and sustainability in the foreseeable future.
References
| [1] | Council For Scientific and Industrial Research. (2015). Financial Costs and Benefits of Renewable Energy in South Africa. Pretoria, South Africa: Council For Scientific and Industrial Research. |
| [2] | Department of Energy. (2016). State of Renewable Energy in South Africa. Pretoria, South Africa: South Africa Department of Energy. |
| [3] | Department of Environmental Affairs. (2015). EIA Guideline for Renewable Energy Projects. Department of Environmental Affairs. Pretoria, South Africa: Department of Environmental Affairs. |
| [4] | Department of Trade and Industry. (2015). The Wind Energy Industry Localisation Roadmap In Support of Large-Scale Roll-Out In South Africa. Integrated final report. Pretoria, South Africa: Department of Trade and UE. |
| [5] | Global Wind Energy Council (GWEC). (2016). Global Wind Statistics. 2015. Brussels, Belgium: Communication Department. GWEC. |
| [6] | South African Wind Energy Association (SAWEA) (2016). South Africa Harnesses Power of the Wind. Johannesburg, South Africa: South African Wind Energy Association. |
| [7] | Walwyn, D.R. (2015). Renewable Energy Gathers Steam In South Africa. Renewable and Sustainable Energy Reviews 41: 390-401. |
| [8] | Greeff, Liane (2012 April). Sustainable Development: Power From The Wind in South Africa. Turbines Generate Hope For Clean Energy. New York, NY: The UN Africa Section Department of Global Communication, African Renewal Magazine. |
| [9] | Linde, H.A.van der. (2020). Wind Energy In South Africa. Retrieved July 20th 2020 From https://www.sciencedirect.com/science/article/abs/pii/0960148196884205. |
| [10] | Atmos Clear Investments. (2021 April). Vestas Optimistic About South Africa, Africa's Onshore Wind Potential. Lausanne, Switzerland: Atmos Clear Investments |
| [11] | South African Wind Energy Association (SAWEA). (2020 October). Stats and Facts SAWEA; South Africa’s Utility Scale Wind and Renewable Energy Industry. Johannesburg, South Africa: South African Wind Energy Association. |
| [12] | Shilpi, Jain. (2017 December). The Rise of Renewable Energy Implementation In South Africa. Energy Procedia. 143: 721–726. |
| [13] | Merem, E.C. (2020). The Preliminary Assessment of Decarbonization Trends In South Africa. Unpublished Internal RFP Intended For Bidding. Jackson, MS: Jackson State University, Department of Urban and Regional Planning. |
| [14] | USAID (2021). South Africa Power Africa Fact Sheet. Retrieved December 20th 2021 From https://www.usaid.gov/powerafrica/south-africa. |
| [15] | Sosibo, Kwanele. (2016 June). Land Access Issues Stall Wind Energy Plan In South Africa. London, UK: Thomas Reuters News Foundations. |
| [16] | Sosibo, Kwanele. (2014 October). Communities Stuck In Land Ownership Battle With Government. Mail and Guardian. |
| [17] | Bungane, Babalwa. (2020 November). South Africa: Kangnas Wind Farm Kicks Off Operations. ESI Africa. |
| [18] | Tiyou, Tony. (2016 October). The Five Biggest Wind Energy Markets In Africa. Renewables In Africa. Retrieved July 20th 2020 From https://www.renewablesinafrica.com. |
| [19] | Mordor Intelligence. (2019). Wind Energy Installed Capacity, In MW 2014-2019.Mordor Intelligence. |
| [20] | Banks, Douglass (2006). The Potential Contribution Of Renewable Energy In South Africa; Sustainable Energy Climate Change Project (SECCP). Johannesburg, South Africa: Earth Life Africa. |
| [21] | World Wind Energy Association (WWEA) (2009). WWEA Wind Energy International - Country report 2009, South Africa. Bonn, Germany: World Wind Energy Association. |
| [22] | Pombo, Nicolette Van-Zyl. (2019 September). Tracking Wind Energy In South Africa. ESI Africa. 4:1-5 |
| [23] | Global Wind Energy Council (GWEC) (2015). GWEC Global Wind Report – Annual Market Update Brussels, Belgium: Communication Department. GWEC. |
| [24] | Heggie, Byjon. (2020 April). Southern Africa: How Sunshine and Wind Can Drive An Emerging Economy. Population and Energy. The National Geographic. |
| [25] | Energypedia (2020). South Africa Energy Situation: Wind Energy. Retrieved July 20th 2020 From https://energypedia.info/wiki/South_Africa_Energy_Situation Wind Energy. |
| [26] | International Energy Agency (IEA) (2020). Forecast of Electricity From Wind Energy. In TWh, South Africa, 2020-2040 Forecasts. Paris, France: International Energy Agency. |
| [27] | Caboz, Jay. (2020 January). These Are The Biggest Green Energy Projects In SA-All Wind Farms. Business Insider SA. |
| [28] | South African Wind Energy Association. (2016 February). South Africa Harnesses Power of The Wind. Johannesburg, South Africa: South African Wind Energy Association. |
| [29] | Dolares, Esteban. (2011). Why Offshore Wind Energy. Renewable Energy. 36: 444-450. |
| [30] | CCE News Team (2021 March). Study Urges South Africa to Tap Offshore Wind Energy Resource. Stellenbosch Central, Stellenbosch: Stellenbosch University Department of Mechanical and Mechatronic Engineering. |
| [31] | Garthwaite, Josie. (2021 April). The Science Behind Decarbonization: The Race To Zero. Stanford Earth Matters Magazine. |
| [32] | Merem, E.C. (2018). Appraising Variations In Climate Change Parameters Along The Lower West African Region. Journal of Safety Engineering. 7:1:1-19. Climate Change and Shorelines |
| [33] | Merem, E.C. (2017). Techniques of Remote Sensing and GIS as Tools for Visualizing Impact of Climate Change-Induced Flood in the Southern African Region. American Journal of Climate Change. 6: 306-327. |
| [34] | Bungane, Babalwa. (2020). South Africa: Kangnas Wind Farm kicks off operations. ESI Africa. |
| [35] | McKane, Jamie. (2020 February). South Africa Will Be A Wind Energy Powerhouse. Olifansfontein, South Africa: My Broadband News. |
| [36] | PR Newswire (2011 January). Second Wind's Technology Gains Ground in South Africa's Expanding Wind Energy Market. Retrieved July 20th 2020 From https://www.prnewswire.com/news-releases/second-winds-technology-gains-ground-in-south-africas-. |
| [37] | New Southern Energy (NSE). (2020). Wind and Solar Energy 2: Alternative Sources In South Africa. Cape Town, South Africa: NSE. |
| [38] | Local, Pam. (2021 March). Wind Farm Pioneers System To Protect Birds In South Africa. ESI Africa. |
| [39] | Ingram, Elizabeth. (March 2021). Wind Farm Pioneers System To Protect Birds In South Africa. Renewable Energy World. |
| [40] | Merem, E.C. (2021). Assessing Hydraulic Fracking Issues in the US Southeast and Western Region, Energy and Power. 11:1: 1-19. |
| [41] | Merem, E.C. (2019). Analyzing Geothermal Energy Use in the East African Region: The Case of Kenya. Energy and Power. 9:1: 12-26. |
| [42] | Merem, E.C. (2020). Issues In Transboundary Water Use In The River Nile Basin Area of Africa. World Environment. 10:2: 27-44. |
| [43] | Merem, E.C. (2018). Assessing Renewable Energy Use In Ghana: The Case of the Electricity Sector. Energy and Power. 8:1: 1-17. |
| [44] | Merem, E.C. (2017). Assessing the ecological effects of mining in West Africa: The case of Nigeria. International Journal of Mining Engineering and Mineral Processing, 6:1: 1-19. |
| [45] | Merem EC (2022 March). The Analysis of Wind Energy Potentials In South Africa. Proceedings of The Conference of Minority Public Administrators (COMPA). Dallas: TX. March 2- 5, 2022. |
| [46] | Merem E.C. (2018). Assessing the Menace of Illegal Wildlife Trade In the Sub Saharan African Region. Advances in Life Sciences. 8:1: 1-23. |
| [47] | Merem, E.C. (2021). The Assessment of China’s Scramble for Natural Resources Extraction in Africa, World Environment. 11:1: 9-25. |
| [48] | Hagemann, K. (2009). Mesoscale Wind Atlas Of South Africa, Climate Systems. Cape Town, South Africa: University of Cape Town, Analysis Group, Stellenbosch Seminar. |
| [49] | Word City Population (2021). South Africa: Republic of South Africa Provinces and Major Urban Areas. Retrieved July 20th 2020 From http://www.citypopulation.de/en/southafrica/cities/. |
| [50] | Statistics South Africa. (2021). South Africa’s Population. Pretoria, Republic of South Africa: Statistics South Africa. |
| [51] | Business Insider SA. (2021 March) Offshore Wind Farms In 3 Spots Could Supply All of SA’s electricity – 8 times over. in the Western Cape. Business Insider SA. |
| [52] | Green R. (2011). The Economics of Offshore Wind. Energy Policy. 39:2:496-502. |
| [53] | International Renewable Energy Agency (IRENA), (2015). IRENA and DTU Launch Worlds Most Detailed Wind Resource Data.: Global Atlas for Renewable Energy, Wind Map. Abu Dhabi, United Arab Emirates: IRENA. |
| [54] | CCE News Team. (2021 March). Study Urges South Africa To Tap Offshore Wind Energy Resource. Retrieved July 20th 2020 From https://cceonlinenews.com/2021/03/15/study-urges-south-africa-to-tap-offshore-wind-energy. |
| [55] | SouthAfrica.Info Reporter. (Jul 2004). SA Wind Power: Not Just a Breeze. Retrieved July 20th 2020 From https://gwec.net/wind-power-blows-africa-2/#. |
| [56] | Brand South Africa. (2020). Wind Energy. Retrieved July 20th 2020 From https://www.brandsouthafrica.com/governance/sustainable/wind-energy-290216. |
| [57] | Chantelle Y. J (2019 May). Clustering of Wind Resource Data For The South Africa. Journal of Energy in Southern Africa 30: 2: 126–143. |
| [58] | Inambao, Freddie L (2019 June). Offshore Wind Resource Assessment off the South African Coastline. International Journal of Mechanical Engineering and Technology (IJMET) 10:06: 95-119. |
| [59] | Whiteman, A. (2018). Renewable Energy Statistics 2018. Abu Dhabi, United Arab Emirates: International Renewable Energy Agency (IRENA). |
| [60] | Merem, E C. (2017). Assessing Ecosystem Liabilities Of Oil and Gas Activities In Southern Nigeria. Public Health Research, 7(1), 3-26. |
| [61] | Merem, E. C. (2016). The Geography Of Wind Energy Use In The Mid-West Region Of The U.S. Journal of Energy and Power. 6:1: 1-15. |
| [62] | Merem, E. C. (2020). Evaluating Geothermal Energy Potentials In The US Western Region With GIS. International Journal of Engineering. 10:2: 23-40. |
| [63] | Merem, E. C. (2017). Regional Assessment of Energy trends In West Africa Using GIS. International Journal of Energy Engineering. 7:1. |

 Abstract
 Reference
 Full-Text PDF
 Full-text HTML