-
Paper Information
- Paper Submission
-
Journal Information
- About This Journal
- Editorial Board
- Current Issue
- Archive
- Author Guidelines
- Contact Us
Energy and Power
p-ISSN: 2163-159X e-ISSN: 2163-1603
2021; 11(2): 33-45
doi:10.5923/j.ep.20211102.01
Received: Apr. 30, 2021; Accepted: May 19, 2021; Published: Jun. 15, 2021

Design of 3-phase Static Modular Double-conversion Lithium-ion-based UPS System
 Abstract
 Reference
 Full-Text PDF
 Full-text HTML
P. K. Ngongo, MTE Kahn
Electrical Engineering Department, Cape Peninsula University of Technology, Cape Town, Bellville, South Africa
Correspondence to: P. K. Ngongo, Electrical Engineering Department, Cape Peninsula University of Technology, Cape Town, Bellville, South Africa.
| Email: |  |
Copyright © 2021 The Author(s). Published by Scientific & Academic Publishing.
This work is licensed under the Creative Commons Attribution International License (CC BY).
http://creativecommons.org/licenses/by/4.0/

A challenge for industries nowadays is to optimize the functionality of their critical processes. Whether they be manufacturing, production, healthcare, banking, data, research, or shopping centres, they are becoming large and complex with several critical loads and processes whose availability is crucial to their overall effectiveness and market competitiveness. Based on their design specifications and accuracies expected, these processes often tend to have a low tolerance and are susceptible to power failures, spikes, brown-out, dip, or surges. They require a high integrity power supply to guarantee their correct functioning, increase their robustness against the damaging effect of power disturbances and operational availability. Eskom’s network instability, lower energy availability, and poor power quality, unfortunately, cannot guarantee the integrity of supply to these critical loads. An increase in load shedding in the past few years highlights this low energy availability factor. Based on these reasons, the facility opted to install 4 x 1100kVA online lead-acid-based rotary UPSs to sustain a sturdy power supply through periods of power disturbances. The sustainability of power will also allow orderly processes shutdown in case of prolonged power interruption and avoid any outage-related financial setbacks. Commissioned back in 1995, they have attained their end-of-life and suffer regular costly maintenances, higher losses, and higher spares cost due to unavailability. Although these are considered legitimate running costs, they occur on a capital scale after few years. Given the system’s age, running cost, and inefficiency, the facility would be efficiently and cost-effectively served by newer high-performance UPS systems. The process of choosing the right UPS system and energy storage solution for critical infrastructure has now become more challenging than ever. Today’s UPS technologies and their corresponding backup storage solution must maintain or even increase the availability and manageability of power on their respective facilities. In the effort to reduce the total cost of ownership, it is imperative to extend lifetime, decrease footprint, streamline maintenance, and lower cooling costs and other operating expenses, in addition to reducing the upfront capital investment. Lithium-ion-based static UPS systems are poised to enhance energy storage for secure power applications. They provide benefits in reducing the installation and maintenance costs and have low waste energy resources making them have high operational efficiency and weigh less than the rotary UPS system. The energy storage system used in these systems has since transformed from medium-lifetime, sprawling, and heavy lead-acid batteries to a long-life, compact, lightweight solution with predictable performance, simplified maintenance, and robust life cycle management. The intervention strategy will present a comprehensive assessment that offers a site-specific solution. It will also provide a financial and performance analysis of the current rotary UPS system versus the new static UPS system with the desire to improve the facility’s power protection, secure its long-term availability, strengthen its energy efficiency capacity, and reduce maintenance costs and carbon footprint.
Keywords: Floor loading capacity, Power and usable energy density, Spatial footprint, Storage capacity, Total cost of ownership
Cite this paper: P. K. Ngongo, MTE Kahn, Design of 3-phase Static Modular Double-conversion Lithium-ion-based UPS System, Energy and Power, Vol. 11 No. 2, 2021, pp. 33-45. doi: 10.5923/j.ep.20211102.01.
Article Outline
1. Introduction
- Several papers have elaborated on the beneficial effects in evaluating the UPS efficiency, losses effects, power density, spatial footprint requirement, and floor loading of various power systems between static UPS (SUPS) and rotary UPS (RUPS) systems. Several others have provided some framework that guides users’ decisions into selecting the best UPS type to be deployed while basing these decisions on their specific circumstances and requirements. A couple of battery technologies have since developed into commercially worthwhile alternatives to lead-acid technology; amongst these technologies is the lithium-ion technology. Several other papers have elaborated on the comparative analysis between lithium-ion and lead-acid batteries (LIBs and LABs) for UPSs and various applications. They have included the baselines to be considered for optimal chemistry and technology selection suitable to the application [4,5,14,18,19,21,25]. Unfortunately, this evaluation, selection process, comparison, or decision elaboration process cannot fit aspects of all facilities; these aspects are situational, site-specific, and subject to requirements imposed by their power system and protection security.The energy analysis of any UPS system is always associated with costs. The examination and assessment of only its operational electrical energy wasted can approximately determine these costs. Being linked to a volatile tariff price adjustment administered by Eskom for the past ten years, these costs will increase as the energy tariff increases. It is important to note that the 2020/2021 tariff price adjustment previously predicted is no longer valid following the affirmation of an average tariff increase of 15.06% in the 2021/22 financial year [12]. However, where an optional UPS system is available, it is always necessary to compare its performance with the existing system. The establishment of how optimal and cost-effective the current UPS system is vis-à-vis the new system is done by first determining their wasted energy costs separately and then comparatively assessing them.These data are crucial in fully informed decision-making, capital expenditure budget motivation, determination of their economic competitiveness, and how quickly they repay the capital investment injected into them.From a design perspective, the capacity of a UPS system links to its physical size. For various UPS products, these dimension specifications are often available in the catalogues and manufacture’ manuals. Although that is the case, there is no single source where these data are summarised comparatively for every product due to information limitations or lack of motive to conduct such comparison. Inside the wide range of UPS technologies presently available in the market, over and above the enhancement in power rating, modularity, redundancy, and efficiency, the compactness of their components has since drastically improved through the use of high-frequency and high-power IGBT semiconductors. This featuring characteristic drove their footprint and weight down when compared with traditional lead-acid-based RUPS systems (LAB-RUPSs). Although the spatial area, weight, and consequently the power density of a new generation UPS system is most likely to be lower than that of the legacy UPS system, the evaluation to confirming and proving this hypothesis is, anyway, needed. This assessment will also determine the impact the system will have on its initial installation cost, land need, civil and structural works, and infrastructure loading requirements. It is also worth mentioning that the correlation between the UPS system’s capacity and space they occupy and the physical load exerted on structures where they are mounted forms a significant aspect of their market sustainability and appraisal. It is only for these reasons that power density (kW/m²) assessment becomes an important metric in fully informed decision-making, selection, and budget motivation.The most vital section of the UPS system is its energy storage system that delivers the required energy to guarantee continuous conditioned power feed to critical loads or processes. This statement leads to say a UPS system is only as good as its battery energy storage system (BESS). The sizing of a BESS for a specific application is per the required facility’s power capacity, autonomy duration, power storage capacity, battery depth of discharge, battery efficiency, UPS efficiency, UPS power factor, and design efficiency. These aspects are situational and subject to requirements imposed by the type of system employed and the facility’s power protection requirements. The evaluation of usable energy density and storage capacity among selected BESSs conducted across different facilities’ power reticulations will, therefore, meant to differ. While the development of the lithium-ion battery chemistries gains paces every day intending to enhance and optimize their performances, analysis in the understanding of the current battery technology against developed technologies is key to proving the efficacy of the future facility’s power protection system. Even though the operational performances, usable energy density, and storage capacity of a new generation battery chemistry system are most likely to be higher than a legacy battery system, those aspects should, anyway, be evaluated and confirmed. Furthermore, the relationship between BESSs’ stored energy capacity and the constant discharge power delivered when called upon forms a significant aspect of their market sustainability and appraisal. The assessment of this aspect is significant to the determination of the amount of power is stored in each BESS bank to be drawn from when needed and clarification of the impact the BESS will have on the facility’s power protection security during low power qualify periods. Based on that, energy density assessment has become a very useful metric in fully informed decision-making, selection, budget motivation, and determination of performance competitiveness.Overall, this paper will use a specific facility-based approach to evaluate various benefits and characteristics between the old LAB-RUPS and the new LIB-SUPS system. This evaluation will conclude in three stages. The first stage will be to represent a comprehensive approach to saving energy, promote and implement an energy management system and energy system optimization that strengthens facility capacity in energy efficiency and carbon dioxide emissions reduction aligned with SANS/ISO 50001. The second stage will be to provide a statistical summary from the evaluation of power density and floor loading capacity associated with the deployment of the new lithium-ion-based SUPS (LIB-SUPS) following the replacement of an old LAB-RUPS. The third stage is where the overall UPS+BESS spatial footprint, the floor loading capacity, and the usable energy density and storage capacity of BESSs associated with UPS systems are comparatively assessed on a common basis to identify and establish if the system selected is optimum and economical.
1.1. Background and Problem Statement
- There are several modern electronic types of equipment used by the facility. Based on their design specifications and accuracies expected, a high integrity power supply to increase their robustness against the damaging effect of power disturbances, as illustrated in Figure 1, is needed. Unfortunately, Eskom’s network instability, lower energy availability, and poor power quality factors cannot guarantee the required integrity of the supply [6,26]. If the facility had to depend solely on the power utility, these unconditioned disturbances will negatively impact its key processes and affect production capacity. Following an analysis of energy used by critical systems, a 4 x 1100kVA online LAB-RUPSs system has been installed. The UPS system was commissioned back in 1995 with an autonomy of 15 minutes. It now poses major operational threats such that the potential failure of these UPS units will remove power protection security, increase the susceptibility to equipment damage, and severely disrupt production. The recovery time from power interruptions will significantly increase since various systems placed in cold start conditions might take up to a day to complete their setup [18,19].
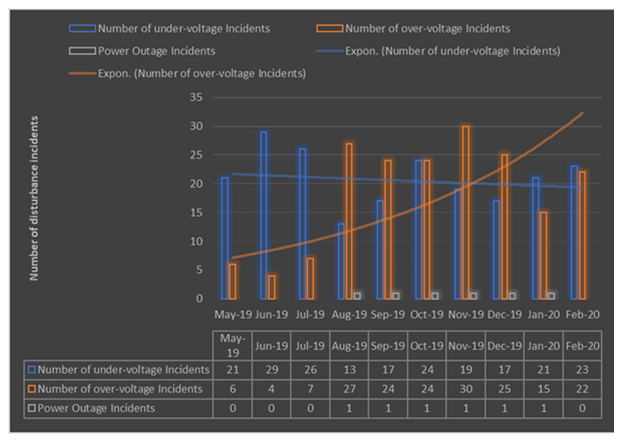 | Figure 1. Facility energy disturbances |
2. UPS System Feasibility Study
2.1. Inception of the Current RUPS System
- The site is supplied by the local authority from a 66/11kV substation as shown in Figure 2.1 with a 5MVA notified maximum demand. All 4 x 1100kVA RUPS units supply a common output bus inside the paralleling cubicle. Through the operator selection, they can run either in the power rating or redundant parallel mode. If an uncorrectable power imbalance occurs in one set or if one RUPS fails, the system will switch automatically to external bypass mode by opening the 600V bypass breaker Q5. For UPSs' maintenance breaker Q5 is used to bypass the critical loads. And for either transformers or UPSs' maintenance breaker OCB5 is used.
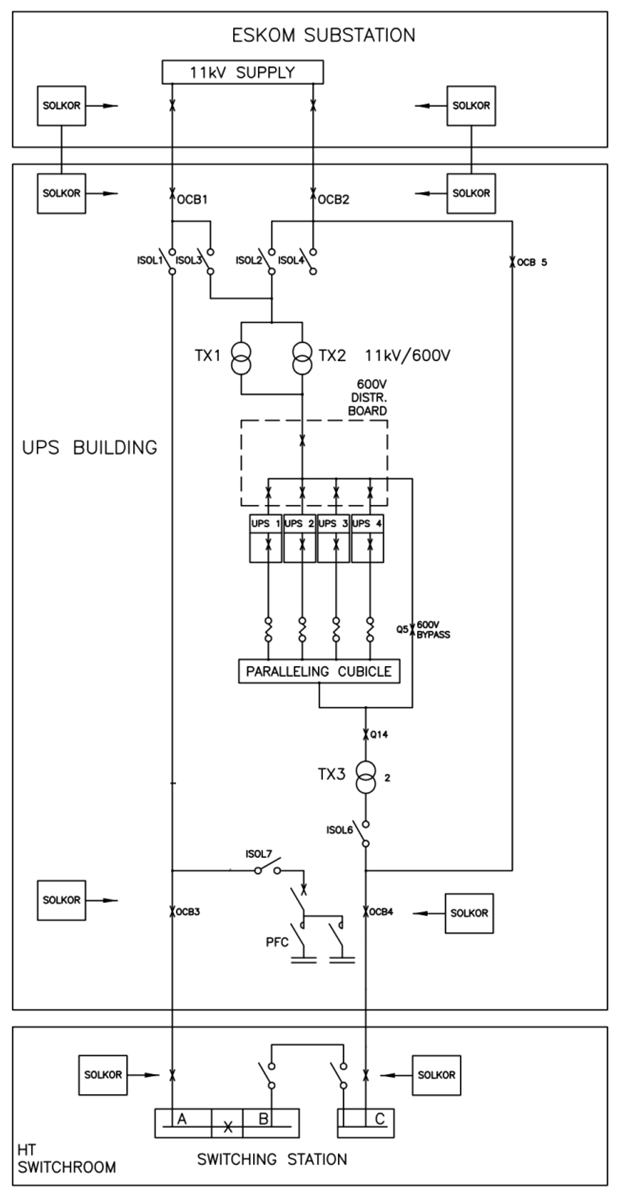 | Figure 2.1. Facility MV reticulation |
2.1.1. RUPS Footprint and Floor Loading Capacity
- RUPS width x depth x height = 5.16 x 1.32 x 2.265mThe area occupied by each UPS = 5.16 x 1.32 = 6.8112m²The area occupied by all UPSs = 6.8112 x 4 = 27.245m²Input cabinet weight = 2475kgOutput cabinet weight = 1320kgMotor-Generator set weight = 7600kgAccessories weight = 240kgSilencer weight = 255kgComplete system weight = 11890kgThe total weight of all UPSs = 11890 x 4 = 47560kg
2.1.2. Lead-acid BESS (LA-BESS) Rating
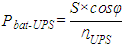
- An important consideration related to the sizing and selection of an appropriate BESS suitable for a given UPS application is its rated power and self-sufficiency period at various load rates following the analysis of the facility’s energy usage of critical equipment. The amount of electrical power to be considered is the power delivered by that BESS when called upon (Pbat-UPS). For that reason, the calculation of the BESS rating will start with the UPS apparent power required to support critical loads (S) while also considering the overall UPS system efficiency (ȠUPS) and power factor (cosφ) as per Equation 2.1 below:
 | (2.1) |
 | (2.2) |
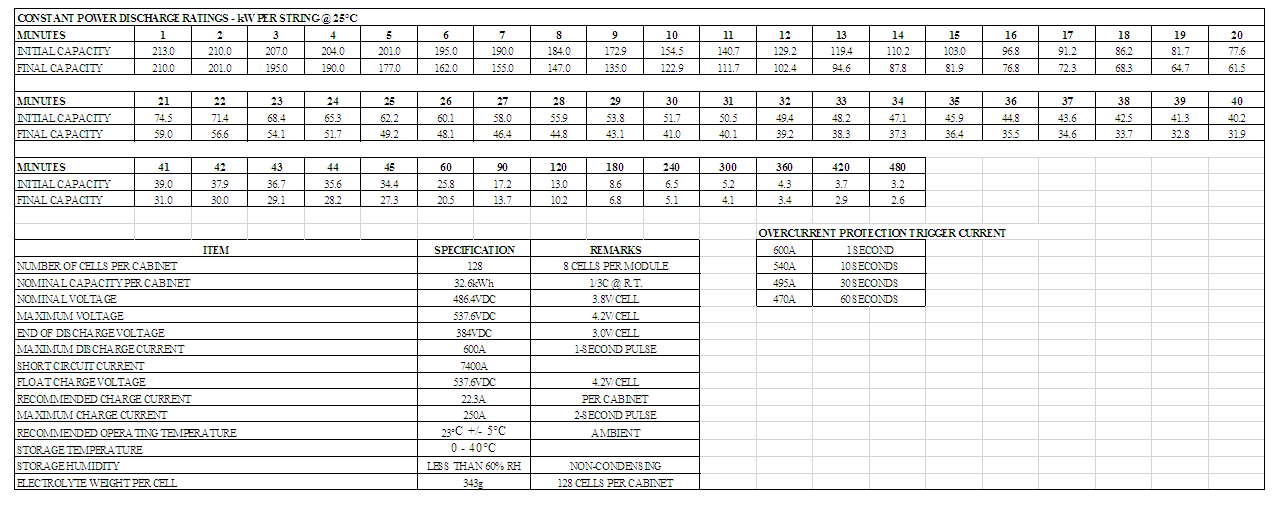
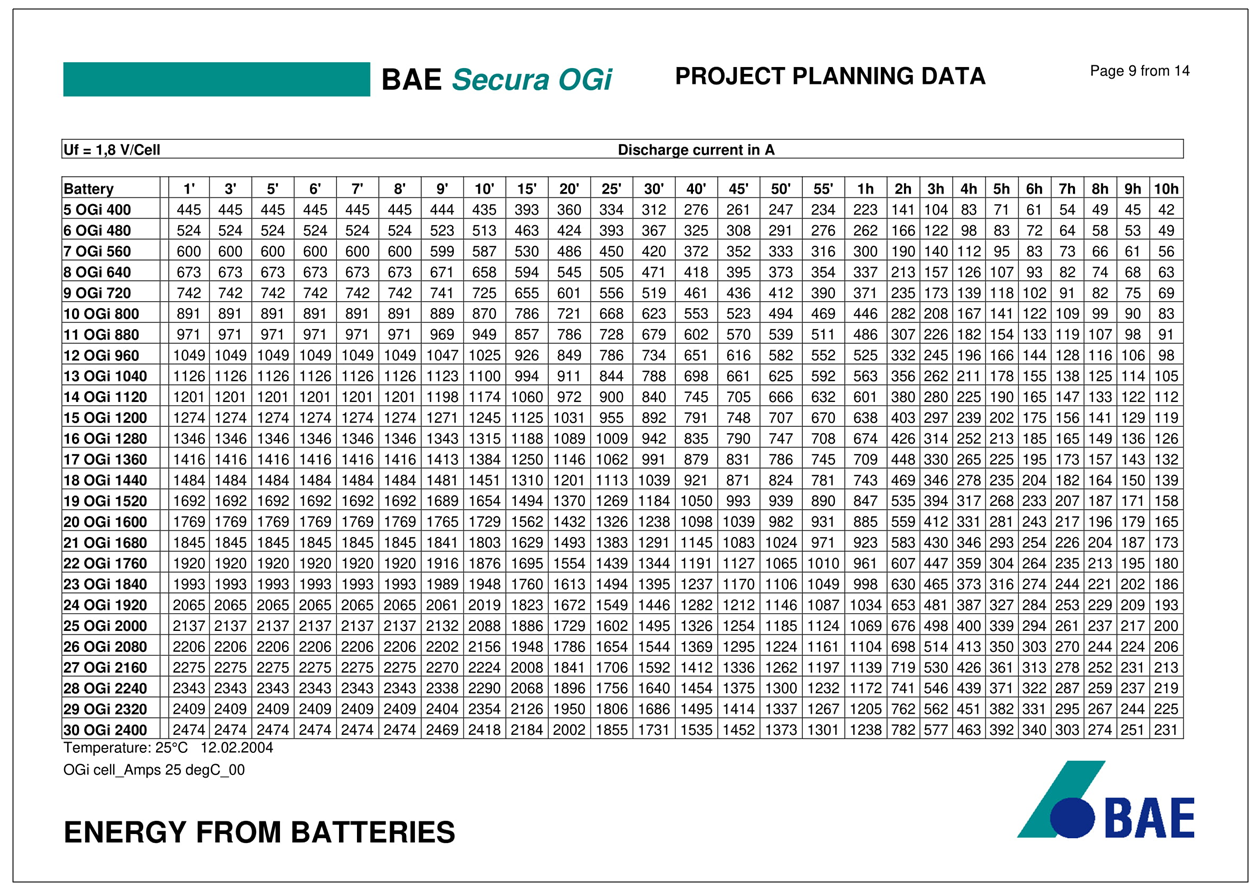 | Table 2.1. Constant Battery Discharge Current [2] |
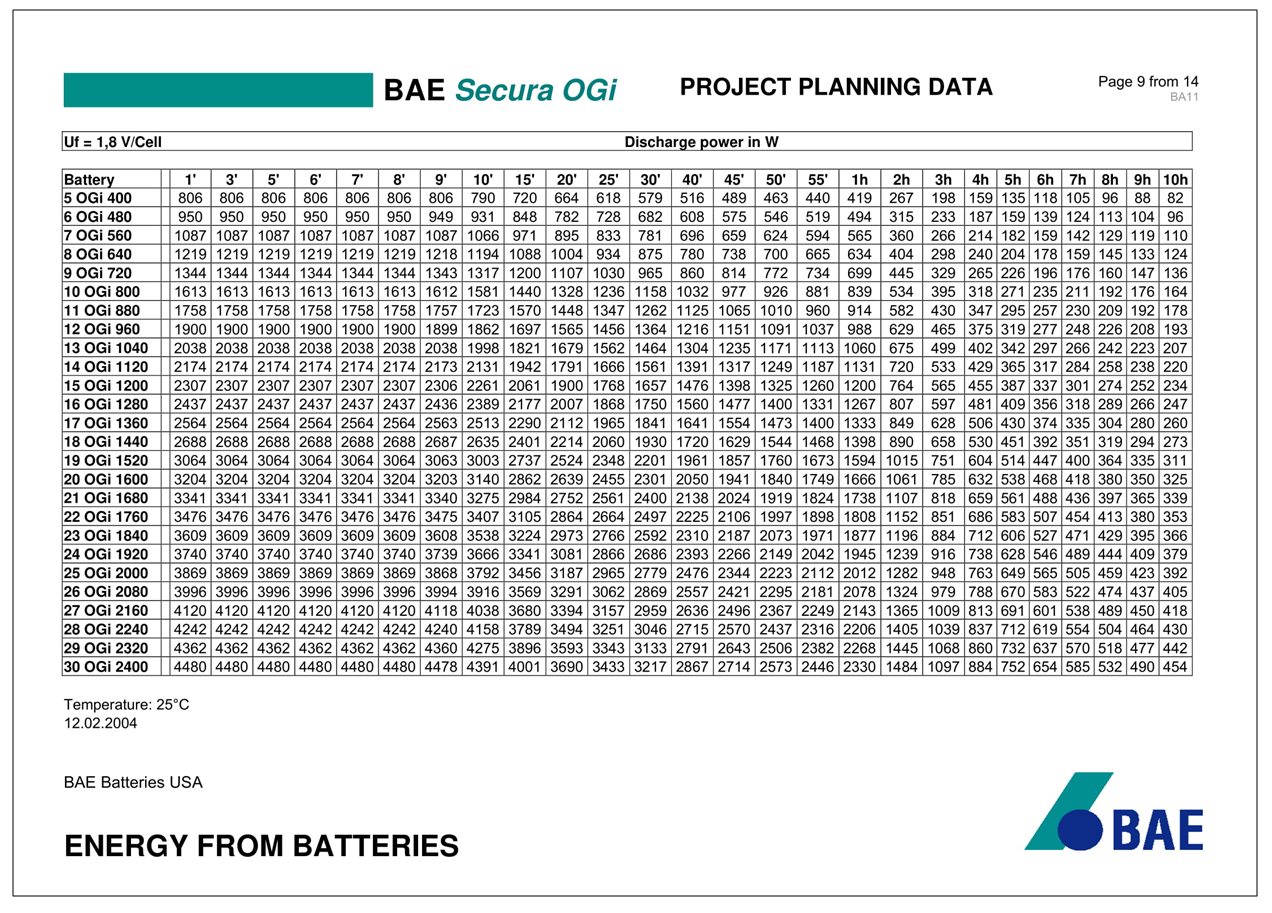 | Table 2.2. Constant Battery Discharge Power [2] |
2.1.3. Cell heat-dissipation
- The RUPS system uses BAE OGi single-cell, vented, or flooded lead-acid batteries. Each RUPS has 264 BAE Secura 25-OGi-2000 cells connected in series. A considerable amount of heat transforms over and above the alteration of mass and exchange or transfer of electrical energy emanating from the chemical reactions during the float, discharge, and charge operation [1,2,3,17,20].Float operation: The heat dissipation power during the float operation mode for one cell can be calculated by Equations 2.3 & 4 below:
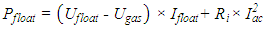 | (2.3) |
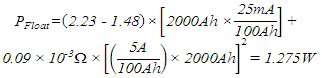 | (2.4) |
 | (2.5) |
 | (2.6) |
 | (2.7) |
 | (2.8) |
2.1.4. Battery Room Ventilation
- The battery room consists of the heating, ventilation, and air conditioning (HVAC) #1 & 2 which are of York make and require a 3-phase supply. The rated cooling and heating input powers of HVAC#1 are, respectively, 21kW and 14kW, and for HVAC#2, these powers are, respectively, 16kW and 14kW.
2.1.5. LA-BESS Footprint and Floor Loading Capacity
- The 264 batteries associated with each RUPS are double stacked into four rows (lower and upper row), each row containing 66 cells:Cell length x width x height = 0.44 x 0.21 x 0.67mCell surface area = 0.44 x 0.21 = 0.0924m²The total area occupied (excluding ventilation gaps) = 0.0924 x 132 = 12.2m²The total area occupied (including ventilation gaps) = 16.4 x 1.75 = 28.7m² The total area occupied by batteries of all UPSs = 28.7 x 4 = 114.8m²Cell weight = 154.085kgThe total cells weight (excluding racks weight) = 154.085 x 264 = 40678.44kgThe total weight for all 4 batteries banks = 154.085 x 1056 = 162713.76kg
2.1.6. RUPS System Findings and Drawbacks
- The four Piller RUPSs installed are over 26 years old, spare parts are no longer available, the equipment and die to produce a replacement unit are no longer available. Although they are still operational, any significant failures would most likely also make them unrepairable. With ageing, they now require regular heavy maintenance and suffer higher electromechanical energy losses inherent to pony motor, frictional, windage. When compared to new UPSs, they are running at high operation loss due to their low power factor (0.8), low efficiency (92%), high heat dissipation, and a requirement for high room ventilation. They are bulky and occupy high footprint space. Like with most equipment, current specifications differ totally from or bear little resemblance to those of earlier years, experiences and technical developments have shown the previous specifications to be deficient. Examples of differing requirements between earlier and current standards relate to operating mechanisms, diagnostic coverage, and personnel protection during equipment failure. On the other end, the associated BAE 25-OGi-2000 LA-BESS now requires biannual maintenance costing the organization approximately R300 000 annually. Although this is considered a legitimate running cost of the plant, it occurs on a capital scale with repetitions of 8 to 10 years. The cost of a cell in 2021 is seating at around R35 000. All cells came with an initial 2-year warranty. The extension of this warranty by an additional three years cost the facility approximately R700 000. Even though the BAE battery cell has a prescribed life expectancy of 20 years, various aspects can undesirably influence it. During normal operation of flooded cells, a considerable amount of heat dissipated adds to the system running cost. Due to the presence of hydrogen, the battery room requires high ventilation to monitor its concentration. The battery room is zoned (zone 1) hazardous utilizing costly explosion-protected electrical and hydrogen monitoring equipment.
2.2. Conceptualization of the New System
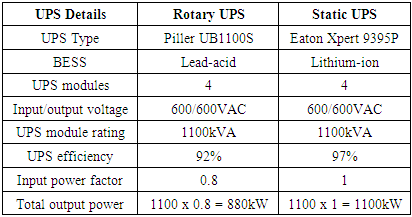
- There are multiple UPS configurations available nowadays. The main configuration types are line-interactive type, online double-conversion type, and offline type. Decisions of what configuration type to be selected are mainly market, requirements, and choices related more than their technological expertise. Identification and selection of a well-suited UPS for any application are concluded by thoroughly type-examining its designed features and benefits towards the facility to be protected. Before selecting a suitable UPS system, it is vital to define its functional and parameters-based performance structures to which its design this UPS is developed. It is also equally crucial to determine requirements such as power, safety, availability, maintainability, affordability, scalability, design performance, configuration type, full autonomy, and capability to condition all NRS-048 defined imperfections. These requirements will assist the system in achieving its optimum integrity and performance level. From that, a parallel UPS system comprising of four Eaton Power Xpert 9395P High-performance, Four-UPM, 600/600VAC, 1100kVA modular SUPSs configured as per Figure 2.2 has been specified; their main specifications are as in Table 2.4. They offer improved lower-load-rate efficiency, performance, power protection capability, reliability, and reduced overall operating costs. Other additional benefits offered by the Eaton Power Xpert 9395P High-performance SUPS include the lowered total cost of ownership (TCO), the employment of a three-level converter topology, the field-installed uninterruptible power module (FI-UPM) capability, the modularity design, the employment of variable module management system (VMMS) and energy saver system (ESS), the easy capacity test (ECT) capability, and the deployment of advanced battery management (ABM) technology [10,11].
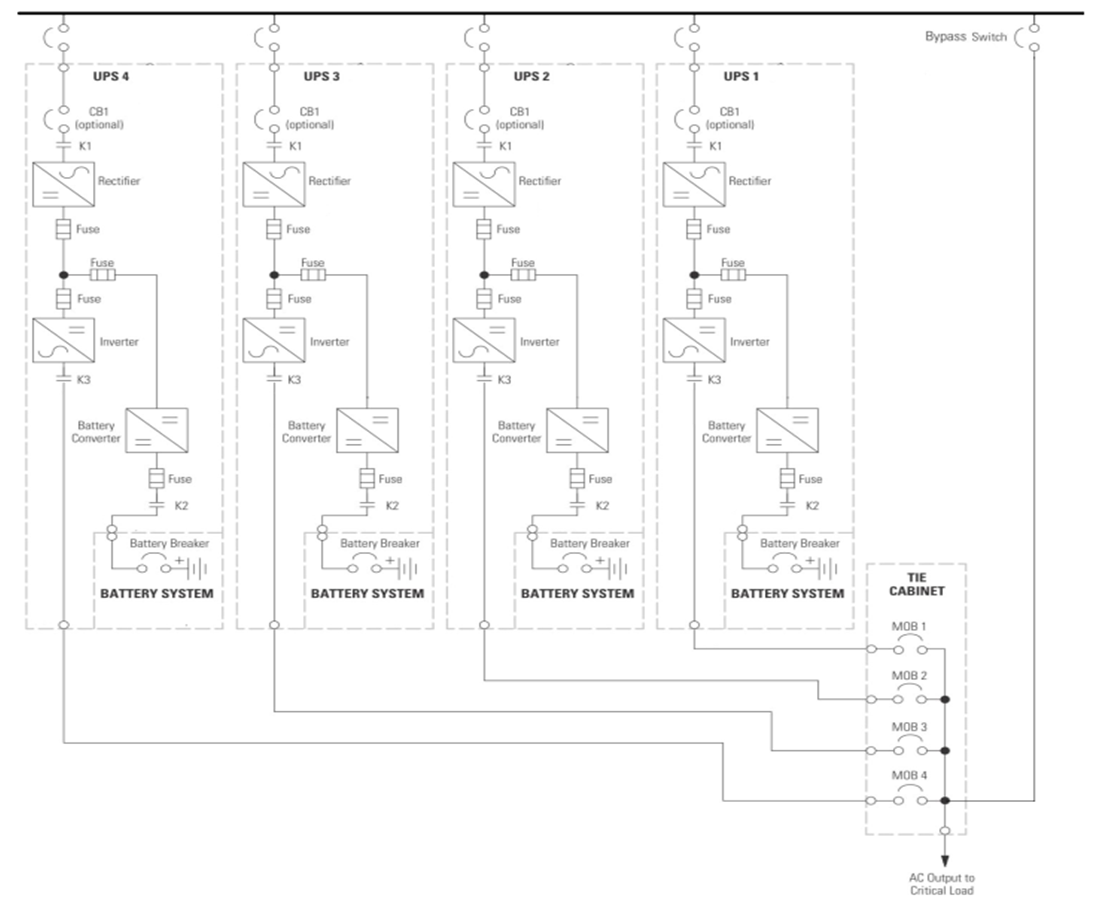 | Figure 2.2. Parallel system with centralized maintenance bypass |
2.2.1. SUPS Footprint and Floor Loading Capacity
- SUPS length x width x height = 5.659 x 0.873 x 1.88mSUPS surface area = 5.659 x 0.83 = 4.94m²The total area occupied by all SUPSs = 4.94 x 4 = 19.76m²SUPS weight = 5239kgThe total weight of all SUPSs = 5239 x 4 = 20956kg
2.2.2. Lithium-ion BESS (LI-BESS) Rating
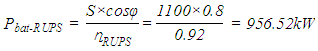
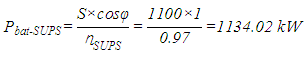
- The system uses prismatic LMO lithium-ion battery (LIB) cells - Samsung SDI and 128S1P cabinets. Each cabinet will contain 16 battery modules for every single string, and these battery modules will be series-connected via provided busbar links [7,8,9,10,15,23,24]. The module configuration is 8S1P (8 x 1S1P cells per module), the cell voltage is equal to 3.8 V, and the nominal cell capacity and discharge energy are, respectively, 67Ah and 254Wh (67Ah x 3.8VPC). Given these cell parameters, the module voltage will, therefore, be equal to 30.4V (8 x 3.8VPC); the nominal module capacity and discharge energy are, respectively, 67Ah and 2.036kWh (8 x 254Wh/cell or 67Ah x 30.4V); and the cabinet voltage is equal to 486.4V (16 x 30.4V/module). The nominal cabinet capacity and discharge energy are, respectively, found to be 67Ah and 32.6kWh (16 x 2.036kWh/module or 67Ah x 486.4V). Similarly, from using Equation 2.1 and based on the maximum installed capacity of 1100kVA per SUPS, the battery power is determined as per Equation 2.9 below:
 | (2.9) |
 | Table 2.3. Samsung 128S1P Technical Data [8] |
2.2.3. LI-BESS Footprint and Floor Loading Capacity
- The 20 battery cabinets associated with each SUPS will stack into two rows. Each row containing ten cabinets installed side-by-side and rear-to-rear in a so-called ‘128S20P’ configuration:Cabinet model: 128S1PCabinet length x width x height = 0.65 x 0.53 x 2.281mCabinet surface area = 0.65 x 0.53 = 0.3445m²The total area of two rows of cabinets associated with one SUPS = 0.3445 x 20 = 6.89m²The total area of all eight rows of cabinets associated with SUPSs = 6.89 x 4 = 27.56m²Cabinet weight = 482kgThe total weight of each system = 482 x 20 = 9640kgThe total weight of all four systems = 9640 x 4 = 38560kg
2.3. Comparative Analysis
- The four old 3-phase LAB-RUPSs and the four newly selected modular double-conversion LIB-SUPSs of the same size will comparatively be analysed. The main characteristics of both UPS systems to be analysed are specified in Table 2.4 [11,16,22].
|
2.3.1. Assumptions
- All calculations will base on the following assumptions. Based on data obtained from Eskom, the facility had 67 interruptions sustained above 5 minutes in the past ten years [13], giving an average of 7 interruptions per year. For that, we assume to have seven complete battery discharges and recharges a year. The discharge is made through a full 15min design backup time to translate to a monthly discharge period of 0.146 hours (7 x 15 minutes/12 x 60). Each charging process takes 6 hours and translates to a monthly charge period of 3.5 hours (7 x 6 hours/12 = 3.5 hours). With the average number of hours per month taken to be 730 hours and based on monthly discharge and charge periods determined above, we can deduce that LAB will be in floating operation for the rest of the time when not discharging or charging; this is equivalent to 726.35 hours a month. Two ventilation units control battery room temperature and prevent the unsafe accumulation of hydrogen gas. The system design allows the run of both ventilation units for LAB and only one single ventilation unit for LIB at fully rated capacity during summertime (low-demand season) to compensate for their winter (high-demand season) consumptions. Through energy transformation from electrical to heat developed in our system, we will assume that of every Watt of dissipated heat energy by any equipment, 60% Watt of electrical power is being consumed. The facility uses the ‘Miniflex’ electricity tariff structure from the power utility. This tariff structure is one of the time-of-use (TOU) electricity tariffs for urban customers with a notified maximum demand (NMD) from 25kVA up to 5MVA. TOU tariff means a tariff with energy charges that change during different TOU periods and seasons. This TOU tariff is commonly used in developed economy countries as it is structured to incentivise consumers who lower their consumption during peak periods. The TOU periods typically are peak, standard, and off-peak periods and differ during high and low demand seasons.As more critical loads add to the UPS system, a high amount of power will need to be processed by various main components (inverter, rectifier). The losses emanating from these components will vary in proportion to critical loads, so are the energy charges during TOU periods and seasons. With this TOU electricity tariff structure having an economic impact on the wasted energy costs from both UPS systems, the accurate energy losses costs in alignment with the facility consumption profile or behaviour will need to be determined. Unfortunately, the main concern from previous researches while evaluating UPS system losses was to consider a fixed average energy charge in their annual energy losses calculations. UPS system annual energy losses costs specification based on an average energy charge will unfortunately not be load-profiled to the facility’s energy consumption profile nor adapted to the power utility’s charges through various seasons and time of the day. To specify these energy losses costs more accurately, the wasted energies distribution must follow the realistic energy profile or consumer behaviour and get charged per their time-of-use.The determination of total cost of ownership will base on energy costs from Eskom’s time of use, 2020/2021 Miniflex tariff structure where all ancillary charges are included [12]. Energy distribution through this comparison is made in alignment with facility 2019/2020 consumption behaviour, and deduced energy distribution coefficients are as below:High-demand season (HDS) energy distribution ratios:Peak energy average = 0.309XStandard energy average = 0.794XOff-peak energy average = X(X + 0.309X + 0.794X) = YX = Y ÷ 2.103Y = Total seasonal energy calculatedX = Multiplying factor = Off-peak energyLow-demand season (LDS) energy distribution ratios:Peak energy average = 0.297XStandard energy average = 0.759XOff-peak energy average = X(X + 0.297X + 0.759X) = YX = Y ÷ 2.056Y = Total seasonal energy calculatedX = Multiplying factor = Off-peak energy
2.3.2. RUPS Losses Calculation and Energy Distribution
- All energy distributions calculated below are inserted in 2020/21 Eskom’s tariff input sheet; respective costs are as in Table 2.8.a) RUPS heat energy loss: With the maximum heat dissipation of each RUPS given to be 87kW, 60% of this heat represents electrical power consumed and is equal to 87 x 0.6 = 52.2kW. For all four RUPSs running throughout 730 hours of the month, the monthly electrical energy is equal to 52.2 x 730 x 4 = 152424kWh.b) Battery room cooling loss: For the LAB room, the assumption is to run both ventilation units at their fully rated capacity during summertime. Total cooling power of both air conditioning units used is (21 + 16) = 37kW leading to a monthly electrical energy of 37 x 730 = 27010kWh.c) Rated operation loss: As calculated, the rated loss is equal to 76.5kW, and for all four UPSs running throughout 730 hours of the month, the monthly electrical energy is equal to 76.5 x 730 x 4 = 223380kWh.d) Batteries floating operation loss: As calculated in Section 2.1.3, the heat load during floating operation per cell was 1.275W, 60% of this heat represents electrical power consumed, and for all 1056 cells floating 726.35 hours a month as demonstrated in Section 2.3.1, the monthly electrical energy will then be equal to 1.275 x 0.6 x 1056 x 726.35 = 587kWh.e) Batteries discharge operation losses: As calculated in Section 2.1.3, the heat load during discharge operation per cell was 299.32W, 60% of this heat represents electrical power consumed, and for all 1056 cells discharging 0.146 hours on average a month as demonstrated in Section 2.3.1, the monthly electrical energy will then be equal to 299.32 x 0.6 x 1056 x 0.146 = 27.7kWh.f) Batteries recharge operation losses: As calculated in Section 2.1.3, the heat load during recharge operation per cell was 46.521W, 60% of this heat represents electrical power consumed, and for all 1056 cells charging 3.5 hours on average a month as demonstrated in Section 2.3.1, the monthly electrical energy will then be equal to 46.521 x 0.6 x 1056 x 3.5 = 103.165kWh.g) HDS - Energy wastedY = 152.42 + 223.38 + 0.587 + 0.028 + 0.103 = 376.518MWhX = Off-peak energy = 376.518 ÷ 2.103 = 179.04MWhPeak energy = 179.04 x 0.309 = 55.32MWhStandard energy = 179.04 x 0.794 = 142.16MWhh) LDS - Energy wastedY = 152.42 + 27.01 + 223.38 + 0.587 + 0.028 + 0.103 = 403.528MWhX = Off-peak energy = 403.528 ÷ 2.056 = 196.27MWhPeak energy = 196.27 x 0.297 = 58.29MWhStandard energy = 196.27 x 0.759 = 148.97MWhi) HDS - Backup energyY = 4400 x 0.8 x 0.146 = 514kWhX = Off-peak energy = 514 ÷ 2.103 = 244.41kWhPeak energy = 244.41 x 0.309 = 75.52kWhStandard energy = 244.41 x 0.794 = 194.1kWhj) LDS - Backup energyY = 4400 x 0.8 x 0.146 = 514kWhX = Off-peak energy = 514 ÷ 2.056 = 250kWhPeak energy = 250 x 0.297 = 74.25kWhStandard energy = 250 x 0.759 = 189.75kWh
2.3.3. SUPS Losses Calculation and Energy Distribution
- Like in Section 2.3.2, all energy distributions calculated below are inserted in 2020/21 Eskom’s tariff input sheet; respective costs results are as in Table 2.8.a) SUPS heat energy loss: With the maximum heat dissipation of each SUPS given to be 61kW, 60% of this heat represents electrical power consumed and equal to 61 x 0.6 = 36.6kW. For all four UPSs running throughout 730 hours of the month, the monthly electrical energy is equal to 36.6 x 730 x 4 = 106 872kWh.b) Heat output from battery cabinets: With the maximum heat dissipation of each battery cabinet given to be 567BTU/hour, and with 1BTU/hour equal to 0.2931W, the heat dissipation in Watt will then be 567 x 0.2931 = 166.131W = 0.166kW. With 60% of this heat representing electrical power consumed, the active electrical power consumed will be equal to 0.166 x 0.6 = 0.0996kW. For all 80 (20 x 4) cabinets running throughout 730 hours of the month, the monthly electrical energy is equal to 0.0996 x 730 x 20 = 5816.64kWh.c) Battery room cooling loss: For the LIB room, the assumption is to run only one ventilation unit at its fully rated capacity during summertime. Use one single air-conditioning unit of 16kW rated capacity. This assumption leads to a monthly electrical cooling energy of 16 x 730 = 11680kWh.d) SUPS rated operation loss: As calculated, the rated loss is equal to 34.02kW, and for all four UPSs running throughout 730 hours of the month, the monthly electrical energy is equal to 34.02 x 730 x 4 = 99338.4kWh.e) Batteries waste heat energy during floating, discharge, and recharge operation is zero since the cycle operation of battery cells is controlled by a battery management system (BMS).f) HDS - Energy wastedY = 106.87 + 5.817 + 99.34 = 212.027MWhX = Off-peak energy = 212.027 ÷ 2.103 = 100.82MWhPeak energy = 100.82 x 0.309 = 31.15MWhStandard energy = 100.82 x 0.794 = 80.05MWhg) LDS - Energy wastedY = 106.87 + 5.817 + 11.68 + 99.34 = 223.707MWhX = Off-peak energy = 223.707 ÷ 2.056 = 108.807MWhPeak energy = 108.807 x 0.297 = 32.316MWhStandard energy = 108.807 x 0.759 = 82.58MWhh) HDS - Backup energyY = 4400 x 1 x 0.146 = 642.4kWhX = Off-peak energy = 642.4 ÷ 2.103 = 305.47kWhPeak energy = 305.47 x 0.309 = 94.4kWhStandard energy = 305.47 x 0.794 = 242.54kWhi) LDS - Backup energyY = 4400 x 1 x 0.146 = 642.4kWhX = Off-peak energy = 642.4 ÷ 2.056 = 312.45kWhPeak energy = 312.45 x 0.297 = 92.8kWhStandard energy = 312.45 x 0.759 = 237.15kWh
2.3.4. Results
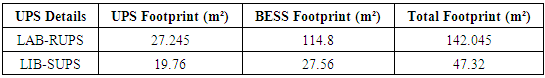
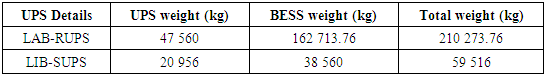
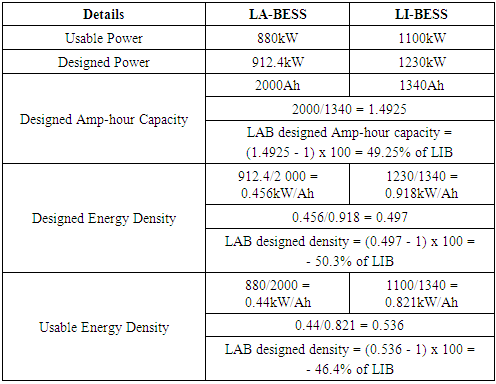
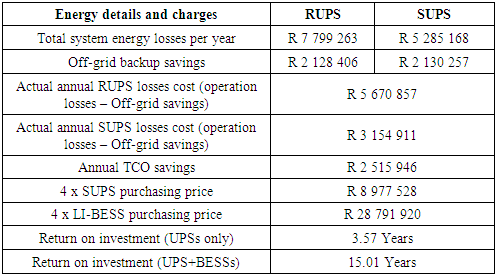
- The summary of the footprint and weight analysis between SUPS and RUPS systems and the respective BESS they employ are as in Table 2.5 & 6. The storage capacities and usable energy densities comparisons between SUPS and RUPS systems are as in Table 2.7. The net variance in the total annual running costs between SUPS and RUPS systems is as in Table 2.8 below [5]. It is worth mentioning that, in most of the previously cited researches, the comparison of the energy density between LAB and LIB refers to the weight of the battery system (W/kg) like in the case of [21,25]. In contrast, this paper will express this energy density differently based on the cell amp-hour or energy storage capacity (W/Ah). The expression will represent the actual depth of energy collection by each battery technology; the result will best highlight the development that the LIB chemistry has introduced in the usable energy density boosting compared to the LAB chemistry.a) RUPS power density: Referring to the main characteristics of both UPS systems in Table 2.4, the total active output power that each RUPS can deliver is 880kW. With the space footprint that takes up the system’s weight found to be 142.045m², the power density will be equal to 880 ÷ 142.045 = 6.2kW/m².b) SUPS power density: Referring to the main characteristics of both UPS systems in Table 2.4, the total active output power that each SUPS can deliver is 1100kW. With the space footprint that takes up the system’s weight equal to 46.36 m², the power density will be 1100 ÷ 47.32 = 23.24kW/m².c) From the results above, the percentage power density of the LAB-RUPS system is [(6.2 ÷ 23.73) – 1] x 100 = 73.873% less than that of the LIB-SUPS system.d) From the results in Table 2.5, the percentage spatial footprint of the LAB-RUPS system is [(47.32 ÷ 142.045) – 1] x 100 = 66.7% less than that of the LIB-SUPS system.e) From the results in Table 2.6, the percentage floor loading capacity of the LAB-RUPS system is [(59 516 ÷ 210 274) – 1] x 100 = 71.7% less than that of the LIB-SUPS system.f) With the yearly facility energy cost seating at R28 millions for the annual energy consumption of 21753MWh based on losses calculation in Section 2.3.2, the RUPS energy loss contribution is 27.5% and 21.22% of the total annual cost and energy consumed, respectively. Similarly, based on losses calculation in Section 2.3.3, the SUPS energy loss contribution is 18.4% and 11.54% of the total annual cost and energy consumed, respectively. The annual TCO savings represents 9.2% of the total yearly energy cost of the facility.g) From losses calculation in Section 2.3.2 and 2.3.3, the new LIB-UPS offers up to 56% (2649.4MWh ÷ 4761.3MWh = 0.5565 x 100 = 55.65%) less heat dissipated when compared to the existing LAB-RUPS system on an annual basis.
|
|
|
|
3. Conclusions
- The new SUPS system has a prominent fiscal return that offers a lesser total cost of ownership with up to 56% less heat dissipated when compared to the existing RUPS system. This fiscal return is so great that the upgrade allows the facility to pay back the invested capital into SUPS units and SUPS+BESSs in approximately 4 and 15 years, respectively. We can also conclude that, to reduce the total cost of ownership of any UPS technology, it is imperative, amongst other requirements, to lower cooling and system operating energies. This lowering of energy leads to reducing consequential exposure to ever-escalating energy tariff, carbon footprint, and increase competitiveness in energy management and savings. The LIB-SUPS system has a substantial and prominent reduction in weight and spatial footprint reduction and has higher power density than the existing RUPS system. The miniaturization and compactness of components used in LIB-SUPS benefited from various upgrades, high-frequency and high-power semiconductors usage has drastically and significantly contributed to this overall footprint and weight reduction when compared with a traditional LAB-RUPS system. And, while the development of LIB cell chemistries has gained pace to enhance and optimize their performances vis-à-vis of the LAB technology, improvement in cell weight and space footprint they occupy is also not surrendered. Based on the design requirements to support the full load power for 15 to 20 minutes of autonomy, we can conclude that the usable energy density of the LA-BESS is 46.4% less than that of the LI-BESS, the storage capacity of the LA-BESS is 49.25% more than that of the LI-BESS. The development of LIB chemistry has introduced greater energy density boosting. This energy density boost caused the quantity of service power collected at the given state of its maximum stored energy charge to nearly double compared to the amount of energy charge sourced from the LAB technology maximum stored energy charge. This statement comes from the fact that LIBs have a depth of discharge of up to 100% (DoD ≤ 100%) compared to only up to 80% (DoD ≤ 80%) for BAE LABs. This deep energy collection is conducted safely by innovative battery management systems implanted at the module, cabinet, and BESS level to offer condition-based monitoring and management of cells’ functionality and health.Although this explorative study design draws some similarity from previous researches, as demonstrated above, it provides repudiation to past approaches on how the costs of UPS system losses are determined. The current work, serving as an introduction of this exciting approach to the technical audience, highlights how various factors of the studied UPS systems play out in a specific application where the facility-based energy profile behaviour can assist in determining their losses costs more concretely. Given the narrow focus on a single specific facility, one can get a contextualized understanding of how the UPS system can be analyzed, evaluated, and selected based on a fully informed decision-making and related application.