-
Paper Information
- Paper Submission
-
Journal Information
- About This Journal
- Editorial Board
- Current Issue
- Archive
- Author Guidelines
- Contact Us
Energy and Power
p-ISSN: 2163-159X e-ISSN: 2163-1603
2020; 10(1): 1-10
doi:10.5923/j.ep.20201001.01

Comparative Numerical Study of the Combustion of a Biofuel Model and Gasoline under Fluent Code
 Abstract
 Reference
 Full-Text PDF
 Full-text HTML
Kamdem K. Claude Aurélien 1, Zhu Xiaolu 1, 2, 3, Harouna K. Attaher 1, Holman Joseph B. 1, Alaeldin Mohamed Tairab 1
1College of Mechanical & Electrical Engineering, Hohai University, Changzhou, Jiangsu, China
2Changzhou Key Laboratory of Digital Manufacture Technology, Hohai University, Changzhou, Jiangsu, China
3Jiangsu Key Laboratory of Special Robot Technology, Hohai University, Changzhou, Jiangsu, China
Correspondence to: Kamdem K. Claude Aurélien , College of Mechanical & Electrical Engineering, Hohai University, Changzhou, Jiangsu, China.
| Email: |  |
Copyright © 2020 The Author(s). Published by Scientific & Academic Publishing.
This work is licensed under the Creative Commons Attribution International License (CC BY).
http://creativecommons.org/licenses/by/4.0/

Nowadays, the possibility of substituting gasoline fuel with biofuels is examined by numerous researchers. This paper discusses the numerical study of the biofuel model (methyl decanoate). The Fluent code was used to validate the comparison between the non-premixed gasoline (n-decane) and biofuel model (methyl decanoate) combustion in the same conditions. The turbulence model used was the realizable k-ε model. The aerothermochemistry equations and the transport model of chemical species (Eddy-dissipation) were implemented in the combustion reaction to develop the velocity, pressure, temperature, energy, enthalpy, the turbulence dissipation rate, the kinetic energy of the turbulence, and the mass fraction of the species. The results showed that the CO2 and NOX contents of methyl decanoate are 5.7% and 11.03% respectively higher than those of decane.
Keywords: Turbulence, Biofuel, Combustion, Eddy-dissipation, Non-premixed
Cite this paper: Kamdem K. Claude Aurélien , Zhu Xiaolu , Harouna K. Attaher , Holman Joseph B. , Alaeldin Mohamed Tairab , Comparative Numerical Study of the Combustion of a Biofuel Model and Gasoline under Fluent Code, Energy and Power, Vol. 10 No. 1, 2020, pp. 1-10. doi: 10.5923/j.ep.20201001.01.
Article Outline
1. Introduction
- Considered as the most used means of transportation, the automobile has been put into the center of an environmental controversy over the last few decades of its fossil fuel source, oil, which power its internal combustion engine [1], [2]. The increasingly stringent requirements of the air pollution standard require the development of engines that meet environmental standards [3]. The transformation of this fossil energy into mechanical energy capable of ensuring the displacement of the automobile is taken by the combustion of this hydrocarbon whose resources are limited. Moreover, this combustion results in the formation of pollutants for the environment (destruction of the ozone layer by nitrogen oxides and global warming by carbon dioxide) [4]. Confronted with this threat to the environment, industrials transport sectors are trying to find ways to limit the consumption of fossil fuels and the impact of products from their combustion on the environment. These objectives, which represent major challenges for renewable energy sources, require research on fundamental and technological aspects. To meet the various constraints in terms of the availability of fossil energy resources and to contribute to the reduction of greenhouse gas emissions, multiple solutions are envisaged: one of these solutions arises from the use of biofuels.Biofuel is identified as a liquid or gaseous fuel obtained from biomass. Biofuels are classified under three categories: first-generation biofuels made from vegetable oils of edible sugar and starch [5], second-generation biofuels based on the non-edible vegetable matter [6], third-generation biofuels made from algae and other micro-organisms [7]. The last category of biofuel offers a more promising alternative than the two previous ones, that pose problems related to the cultivable surfaces and especially of famine due to the rise in prices of some staple foods, such as maize, soy, wheat, rapeseed, sunflower, and palm. Indeed, biofuels are separated into alcohol which is primarily used in the spark-ignition engine "gasoline engine", and esters which are employed in compression ignition engines "diesel engine" [8], [9]. Bioethanol is obtained from vegetable raw materials. Nowadays, it is the most utilized biofuel in the world. It is produced in three different ways from biomass: by fermentation [10], gasification followed by a synthesis process [11], and hydrolysis followed by a fermentation process [12]. Biodiesel is a vegetable oil ester. The use of vegetable oil as fuel is not a new technique. However, these oils offer overly high viscosity and a cetane index (ability to auto-ignition) overly low compared to diesel fuel, that makes them problematic for direct use in a conventional diesel engine, but due to their higher density, the weak power calorific value of vegetable oils is compensated (less than 11.5% gasoline standards) [13]. Therefore, their low cetane index of oils can increase fuel consumption, engine noise and emissions in HC, NOX, and CO2 [14], [15]. The CO2 emitted during the combustion from biofuels is taken up by the tree end of plants during growth and presented some advantages and limitations in atmospheric air [16]. To obtain characteristics similar to petroleum diesel, these vegetable oils will undergo transesterification with alcohol, mainly methanol (note that ethanol could be utilized) [17]. This reaction is achieved using a basic or acidic catalyst at moderate temperature (20 - 80°C) and atmospheric pressure. This paper chooses a representative combustion chamber as the basic element for combustion reaction, and simulates the pressure, temperature, velocity and species distribution derived from the combustion. The interaction between the turbulence (model of turbulence and transport model of chemical species) and the combustion has been also examined. These obtained results demonstrate that the biofuel model (methyl decanoate C11H22O2) generates the content of CO2 and NOX higher than those of gasoline (n-decane C10H22). This study also promotes the comprehension of different physicochemical phenomena issued from the non-premixed combustion of biofuel model in a combustion chamber. The fundamentals variables such as the pressure, temperature, velocity, energy, enthalpy, turbulence dissipation rate, the kinetic energy of turbulence and mass fraction of species are also validated by comparing the results obtained from the simulation of gasoline in the same conditions and parameters that have been settled.
2. Materials and Methods
2.1. Governing Equations
- Combustion modeling integrates the flow of fluids based on the equations of fluid mechanics, the transport of species based on the balance of the transported species, and the heat transfer based on the energy balance.
2.1.1. Equations of Aerothermochemistry
- The starting point for the turbulent reactive flow analysis is the fluid mechanics equation called the "Navier – Stoke’s equation" plus the energy equation. The chemical reactions produced during the flow require that the mass balance of the species present in the reaction and the diffusion phenomena be taken into account. These five equations are as follows [18]:- Equation of continuity:
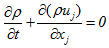 | (1) |
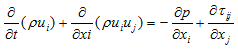 | (2) |
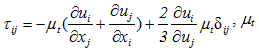 the turbulent viscosity, and
  the Kronecker symbol.- Balance equation of the species k:
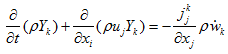 | (3) |
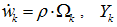 the mass fraction, and
  is the diffusion flux of the species k given by Fick's law [20]:
 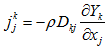 , where
  the molecular diffusivity of the species k.- Energy conservation equation:
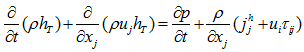 | (4) |
 and the diffusion flux of the enthalpy given by the Fourier law [21]:
  - State equation of perfect gases:
 | (5) |
2.1.2. Chemistry Kinetic
- All the chemical reactions involved can be written in the following general form [22]:
 | (6) |
 and
and  are respectively the stoichiometric coefficients in the forward and reverse direction,
  is a chemical species of the considered gas.
2.1.2.1. Chemical Production Rate
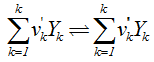
- If species k is involved in several chemical reactions, its global production rate
 is written:
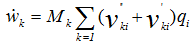 | (7) |
 is the difference between the direct and inverse volume velocity of the reaction i. It is given by:
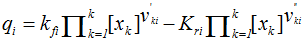 | (8) |

2.1.2.2. Reaction Velocity
- It has been shown experimentally that reaction rates depend on temperature and generally follow an Arrhenius type law [23]:
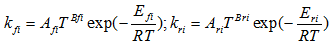 | (9) |
 are dependent on the considered reaction.
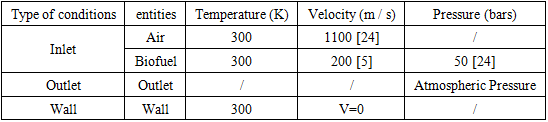
 2.2. Problem Description and Boundary Conditions
- The agitated combustion cylinder is shown in Figure 1. It is 1.8 m long and 0.45 m in diameter. At the center of the cylinder, a 0.01 m interior diameter tube is provided for the biofuel inlet.
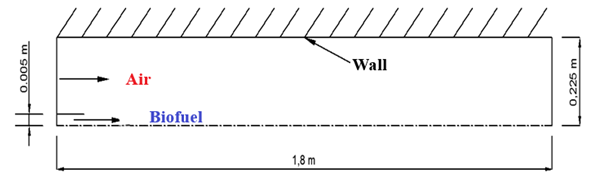 | Figure 1. Combustion chamber |
|
2.3. Numerical Method
- The method used by the FLUENT code is that of the finished volumes [25]. It stands out for its reliability in results, its adaptation to physical problems, its ability to cope with complex geometries. Besides, it is characterized by its advantage to satisfy the conservation of mass, momentum, and energy in all the finished volumes as well as in the whole field of computation, which is not the case with the other methods. It facilitates the linearization of nonlinear terms in conservation equations.It should be noted that Fluent offers several models for the modeling of reactive flows, but the model of the species chosen for this simulation is the transport model of chemical species and the volumetric reaction to "Eddy-Dissipation" as the interaction between turbulence and chemistry.This choice is motivated by [26]. In this case, the combustion, which is only controlled by turbulence, transports the mixture of the fresh gases with the hot products in the reaction zone, where the chemical kinetics are rapidly carried out.The Fluent software also provides several turbulence models such as Spalmart-Allmaras,
 models,
  Models, Reynolds stress model (RSM), Detached eddy simulation (DES) model, Large-eddy simulation (LES) model [27]. In this study, the standard model
  was utilized. It is used as a model with two transport equations, one for the kinetic energy of the turbulence k and one for the rate of dissipation of the kinetic energy ε. This model presents some advantages such as it assumes that the turbulent regime is fully established throughout the domain and that the effects of molecular viscosity are negligible compared to those of the turbulent viscosity (far from the walls). It is based on the Boussinesq hypothesis, that there is an analogy between the action of viscous forces and the Reynolds constraints in the mean flow [28]:
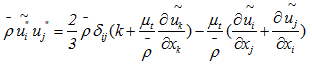 | (10) |
 - Equation of the turbulence kinetic energy:
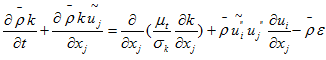 | (11) |
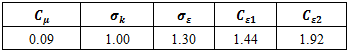
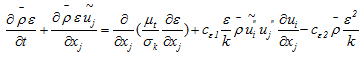 | (12) |
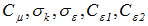 listed in Table 2, on that the calculation results depend.
|
2.3.1. Mesh
- The mesh is obtained automatically after selecting the parameters. The mesh element chosen is quadrilateral of Map type. For this mesh, it is obtained a result of 5000 nodes that can be seen in Figure 2. The size of the meshes differs from one point to another of the geometry.
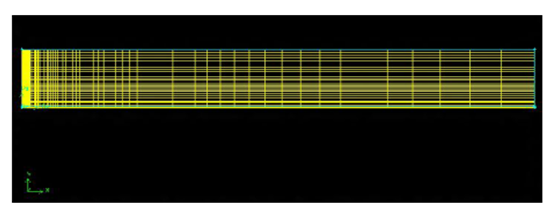 | Figure 2. Generation of the mesh of the combustion chamber in GAMBIT |
2.3.2. Simulation Parameters
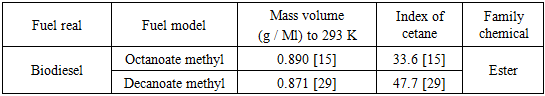
- According to their investigation [15], the values of some properties of biofuels model developed in kinetic models are found in Table 3.
|
|
2.3.3. Combustion Reaction
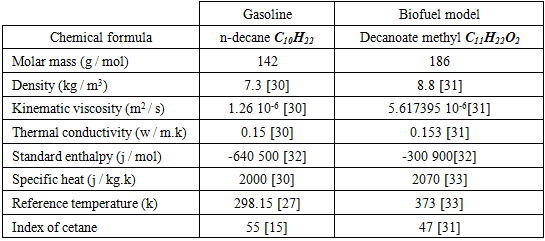
- Pure components were chosen to analyse the biofuel and gasoline. The combustion reaction is defined in terms of the stoichiometric coefficients, formation enthalpy and control parameters of the reaction rate. In this study, it is a one-step reaction scheme with five (06) species C10H22 or C11H22O2, CO2, H2O, O2, N2 (inert), and NOx was chosen.- The oxidation of n-decane of chemical formula C10H22 for the gasoline.According to the general hydrocarbon combustion equation of n-decane, it can be written this following equation:
 | (13) |
 associated for this reaction is
 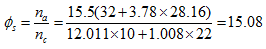 Therefore, complete combustion of a unit of gasoline mass requires 15.08 units of an air mass.- Determination of the Reynolds number of C10H22
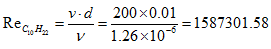 - The oxidation of methyl decanoate of chemical formula C11H22O2 for the biofuelMethyl decanoate belongs to the family of esters given its chemical formula. The general equation of combustion of the esters is given by [30]:
 | (14) |
 | (15) |
 associated for this reaction is:
 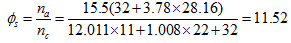 Thus, complete combustion of a biofuel mass unit requires 11.52 air mass units.- Determination of the Reynolds number of C11H22O2
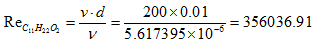 Based on the obtained values of the stoichiometric ratio of both biofuel, it is deducted that the combustion is lean because the air coefficient lambda is greater than 1. Therefore, theoretically, these values are very significant and prove that there is a high quantity of NOx issued from this combustion due to the high temperature generates by both fuel. In addition, both Reynolds numbers obtained prove that the regime is turbulent.The formation of NOx is illustrated by the extended Zeldovich mechanism [34]. The fuel provides high heat and due to the presence of free nitrogen and excess oxygen in compression combustion. This increases the appearance of NOx which forms under catalysis during combustion. His overall reaction is:
 | (16) |
3. Results and Discussions
3.1. Static Pressure
- The results of this study presented in Figure 3 show a very high pressure at the entrance to the combustion chamber. As this combustion takes place, this pressure drops and is submitted to atmospheric pressure at the outlet. Moreover, it is noted in this Figure 3 that the pressure of methyl decanoate (1,2555x10⁷ Pa) remains slightly higher than the pressure of decane (1,28476x10⁷ Pa). This high pressure is due to the extreme heat released during the premix combustion, such as indicates [35]. This gradually relaxes as the premix flame gives way to the diffusion flame. Both pressure drop and end up at the atmospheric pressure at the outlet. This pressure relief is indicated on the domain by the gradual coloration in blue towards the outlet of the chamber. In view of this point, the model biofuel also generates a remarkable pressure and is significant compared to gasoline.
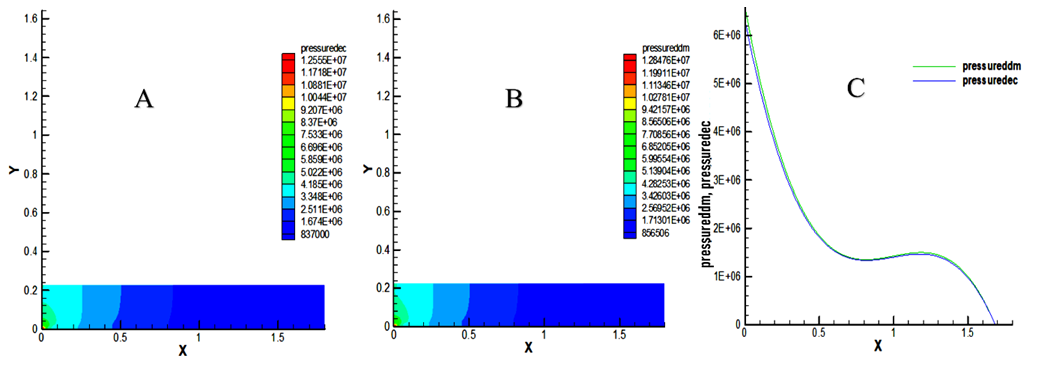 | Figure 3. Static pressure in the combustion chamber. (A) pressure of decane (dec), (B) Pressure of methyl decanoate (ddm), (C) comparison between pressure of decane and pressure of methyl decanoate |
3.2. Velocity Distribution
- The velocity distribution indicates by their dark red coloring a maximum speed on the axis of symmetry of the chamber as indicated in Figure 4. There are maximum velocities substantially equal to the outlet of the chamber, supposedly 1278.54 m / s for decane and 1273.54 m / s for methyl decanoate. In the near wall, relatively low speeds of about 340.945 m / s and 339.315 m / s respectively are observed for decane and methyl decanoate.
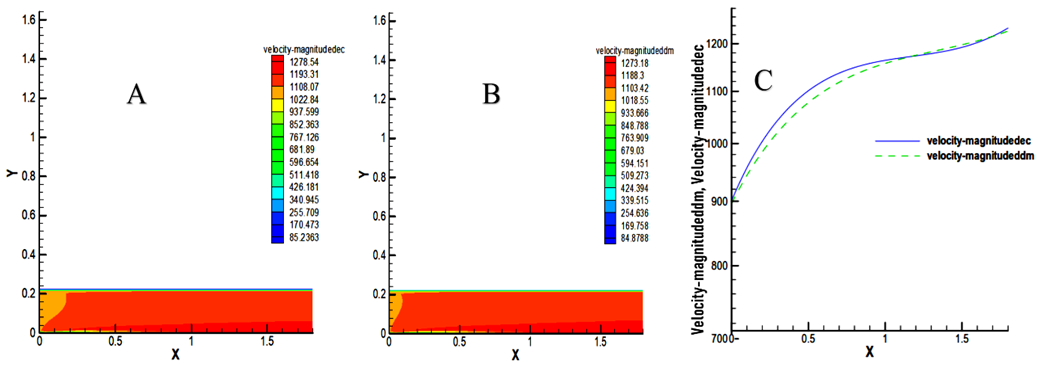 | Figure 4. Velocity distribution in the combustion chamber. (A) velocity of decane (dec), (B) velocity of methyl decanoate (ddm), (C) comparison between velocity of decane and Velocity of methyl decanoate |
3.3. Kinetic Energy of Turbulence
- The results show a very high turbulence at the inlet of the chamber, which is of the order of 56677.6 m2 / s2 for decane and 46332.8 m2 / s2 for the methyl decanoate as indicated in Figure 5. This high kinetic energy has a relationship with the high pressure at the entrance of the chamber for both fuels. It decreases sharply to 0.6 m. In the zone [0 - 0.6] m, the kinetic energy of decane is slightly higher than that of decanoate. In the zone [0.6 - 1.3] m, that of decanoate is slightly higher. Finally, in the zone [1.3 - 1.8] m, the kinetic energy of the decane is slightly higher than that of the biofuel with an pproximate percentage of 18.25%.
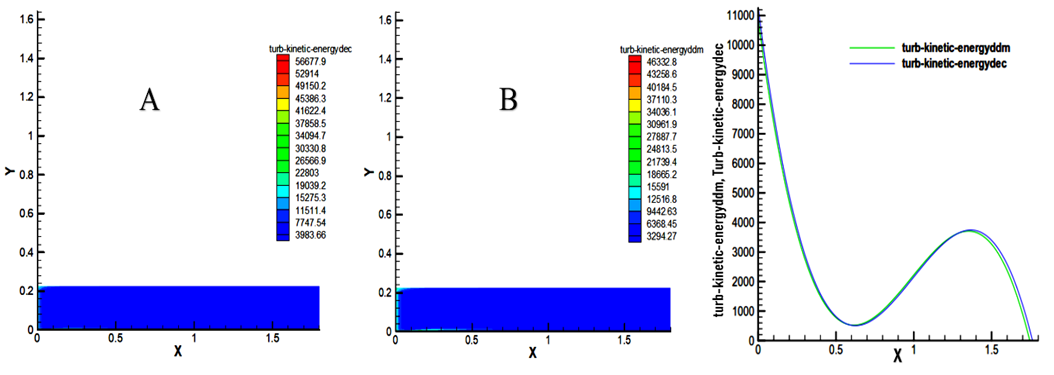 | Figure 5. Turbulence kinetic energy distribution in the combustion chamber. (A) Turbulence kinetic energy of decane (dec), (B) Turbulence kinetic energy of methyl decanoate (ddm), (C) comparison between Turbulence kinetic energy of decane and Turbulence |
3.4. Turbulence Dissipation Rate
- In this study, we note on the dissipation rate fields a high rate at the entrance of the combustion chamber. With values of 6.89641x10⁹ m2 / s3 for decane and 5.46608x10⁹ m2 / s3 for methyl decanoate as shown in Figure 6.
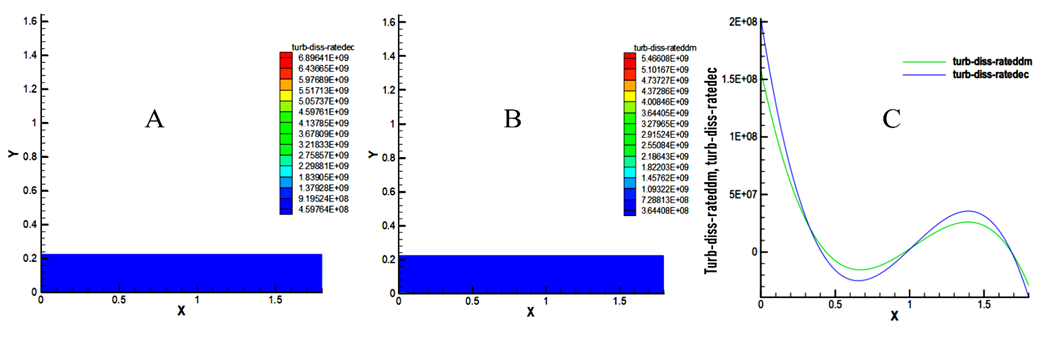 | Figure 6. Turbulence dissipation rate distribution in the combustion chamber. (A) Turbulence dissipation rate of decane (dec), (B) Turbulence dissipation rate of methyl decanoate (ddm), (C) comparison between Turbulence dissipation rate of decane and Turbulence dissipation rate of methyl decanoate |
3.5. Temperature Distribution
- The results of this study show a very high temperature in the axis of the combustion chamber that is due to the inflammation of the mixture. Decane reaches a maximum temperature of 2615.77K, and methyl decanoate has a maximum temperature of 2645.68K as showed in Figure 7. Moreover, this temperature will recover more and more in nearby wall to allow the engine to operate under normal conditions. In the zone [0 - 1.03] m, the temperature of the decane is higher than that of the decanoate, then the trend is reversed in the zone [1.3 - 1.8] m. The temperature generates by the methyl decanoate is 1.13% higher than the temperature of decane. Therefore, the low cetane index of biofuels generates a rise in temperatures [15].
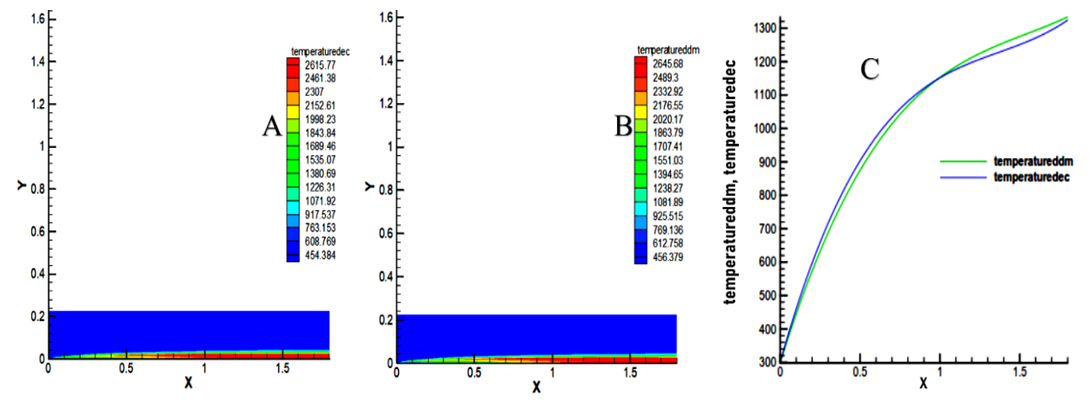 | Figure 7. Temperature distribution in the combustion chamber. (A) Temperature of decane (dec), (B) Temperature of methyl decanoate (ddm), (C) comparison between Temperature of decane and Temperature of methyl decanoate |
3.6. Total Energy
- The results indicate a very high total energy due to the high intensity of heat produced during combustion of the mixture in the combustion chamber. Inflammation of the air-fuel mixture allows to generate the maximum energies of 556983 J / kg for decane and 553604 J / kg for decanoate of methyl as showed in Figure 8.
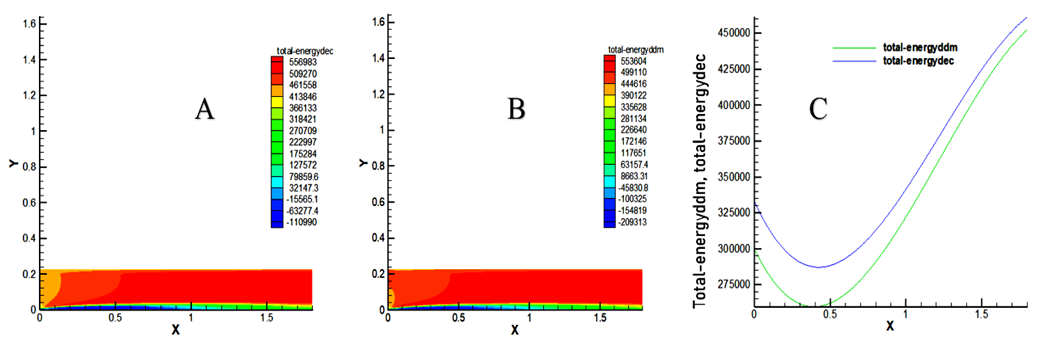 | Figure 8. Total energy in the combustion chamber. (A) Total energy of decane (dec), (B) Total energy of methyl decanoate (ddm), (C) comparison between Total energy of decane and Total energy of methyl decanoate |
3.7. Total Enthalpy
- It is observed that these two fuels emit a very high enthalpy following the ignition of the mixture in the axis of the combustion chamber to the outlet. Maximum values reached are 1.06386x10⁶ J / kg for decane and 1.03805x10⁶ J / kg for methyl decanoate as indicated in Figure 9. These curves show that the total enthalpy of decane is greater than the enthalpy of methyl decanoate in the combustion chamber with an approximate percentage of 2.38%.
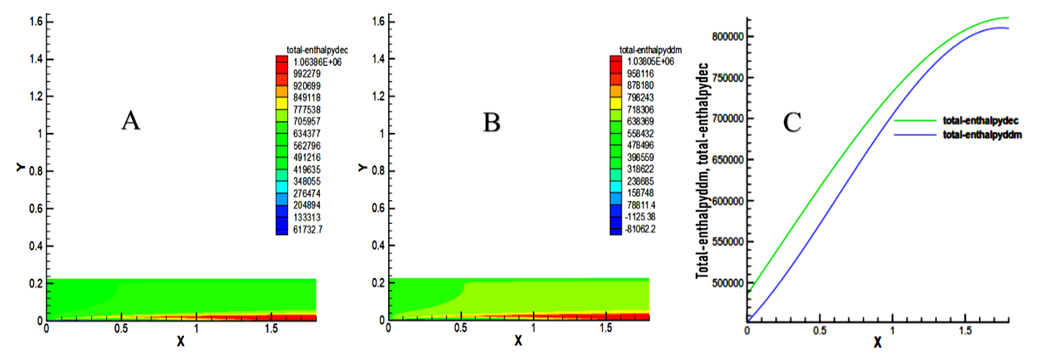 | Figure 9. Total enthalpy in the combustion chamber. (A) Total enthalpy of decane (dec), (B) Total enthalpy of methyl decanoate (ddm), (C) comparison be-tween Total enthalpy of decane and Total enthalpy of methyl decanoate |
3.8. The Mass Fraction of CO2
- In this study, the results show that the content biofuel of CO2 is 0.176432 compared to gasoline which is 0.166239. This value of biofuel is high and presents an increase of approximatively 5.7% relative to decane as indicated in Figure 10.
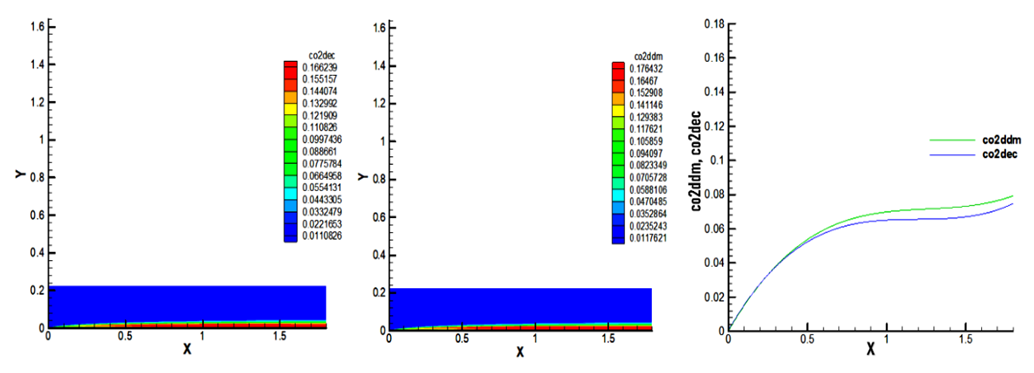 | Figure 10. CO2 mass fraction in the combustion chamber. (A) CO2 mass fraction of decane (dec), (B) CO2 mass fraction of methyl decanoate (ddm), (C) comparison between CO2 mass fraction of decane and CO2 mass fraction of methyl decanoate |
3.9. The Mass Fraction of NOx
- The results of this study show a NOx mass fraction of 0.015872 for decane and 0.0178409 for methyl decanoate at the outlet of the chamber, an increase of approximately 11.03% relative to decane as indicated in Figure 11. The low cetane index of biofuels generates a rise in NOx levels as well as high temperatures [15]. Thus, NOx emissions for biodiesel blended have been found higher than diesel fuel [14]. Based on this Figure 11, It is noted that the NOx production curve of methyl decanoate is above that of decane, which reflects a high production of NOx by the model biofuel. Consequently, this result is remarkable.
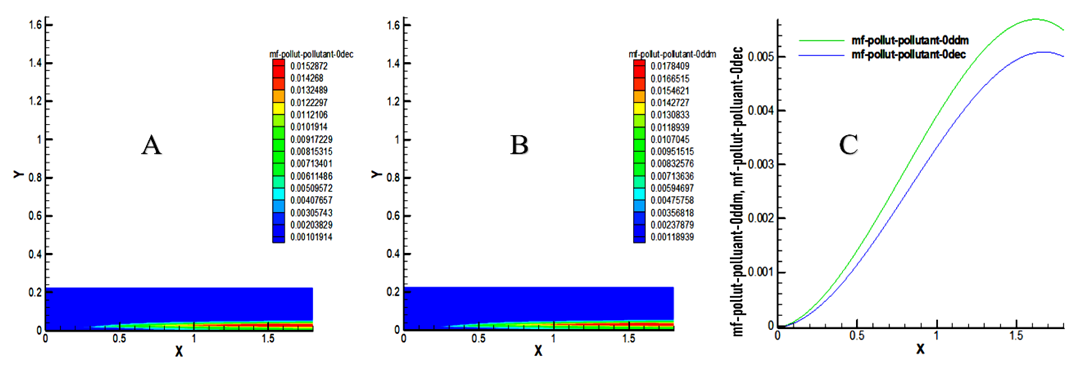 | Figure 11. NOx mass fraction in the combustion chamber. (A) NOx mass fraction of decane (dec), (B) NOx mass fraction for methyl decanoate (ddm), (C) comparison between NOx mass fraction of decane and NOx mass fraction of methyl decanoate |
4. Conclusions
- The Fluent code is allowed to simulate the combustion of a biofuel model (methyl decanoate C11H22O2) and gasoline (n-decane C10H22) under the same conditions. For this simulation, the type of mesh used was quadrilateral of map and it has been obtained 5000 nodes compared to other types. The equations of aerothermochemistry, a turbulence model (the standard k-ε model), the transport model of chemical species (Eddy-dissipation), and the fuel oxidation reaction equations have been implemented. The simulation parameters have been defined based on the literature and the calculation. The results obtained from this simulation show that the NOx content generates in the biofuel is slightly higher 11.03% than the diesel fuel. The maximum energies of 684314 J / kg and 679880 J / kg respectively are found for methyl decanoate and decane. The energy produces in the methyl decanoate is 0.6% lower than the energy of decane. The content of CO2 produces in the methyl decanoate is 5.7% relative higher than decane. This simulation shows that this biofuel generates an energy comparable to that of diesel fuel, but it releases more pollutants.
ACKNOWLEDGEMENTS
- This research was funded by Fundamental Research Funds for the Central Universities of China (grant number 2018B22414), Changzhou Sci &Tech Program (grant number CE20195037) and Youth talent support project from Jiangsu association for science and technology.
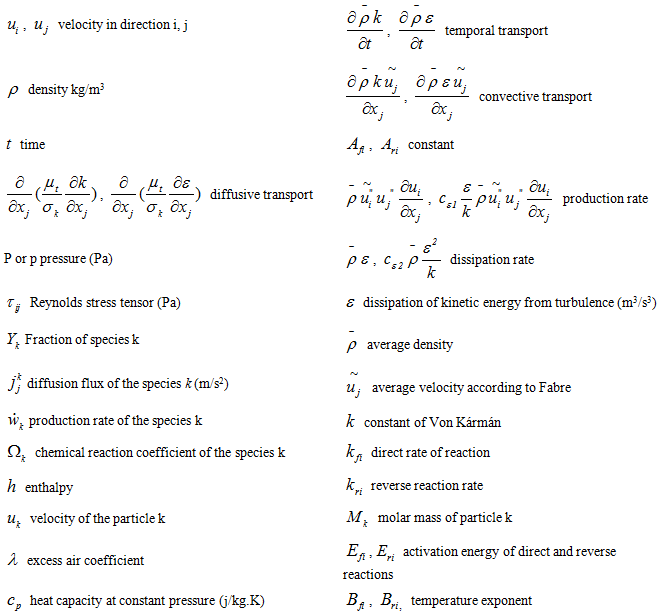
Nomenclature