-
Paper Information
- Paper Submission
-
Journal Information
- About This Journal
- Editorial Board
- Current Issue
- Archive
- Author Guidelines
- Contact Us
Energy and Power
p-ISSN: 2163-159X e-ISSN: 2163-1603
2019; 9(2): 39-47
doi:10.5923/j.ep.20190902.01

Optimizing the Use of Inedible Maize in the Design of an Ethanol Production Plant in Heilongjiang, China
 Abstract
 Reference
 Full-Text PDF
 Full-text HTML
L. Zhang, R. E. Blanchard
Loughborough University, Loughborough, LE11 3TU, United Kingdom
Correspondence to: R. E. Blanchard, Loughborough University, Loughborough, LE11 3TU, United Kingdom.
| Email: |  |
Copyright © 2019 The Author(s). Published by Scientific & Academic Publishing.
This work is licensed under the Creative Commons Attribution International License (CC BY).
http://creativecommons.org/licenses/by/4.0/

This paper adapts the ethanol model developed by Aldonza and Blanchard1 by applying it to maize feedstock in China. Part of the reasoning for this is according to the BP Statistical Review of World Energy 20182, the proven oil reserves in China only accounted for 1.5% of the world reserves in 2017. Meanwhile, Chinese energy demand has soared as a result of rapid economic growth. Dependence on imported oil and serious environmental pollution have forced the government to give priority to energy security issues and actively develop its renewable energy industries. China is a populous country with around 40% of the population living in rural areas. It might be significantly important for the goal of sustainable energy to establish self-sufficient bioethanol manufacturing plants in areas with high agricultural output. This study will predict the potential of an inedible maize-based ethanol plant in a rural area of Heilongjiang Province, China, which can save on transportation costs as well as a benefiting from a large source of raw materials, consisting of degraded stored maize kernels and maize cobs. The estimated operating time is 20 years and the annual throughput of maize is 3650 tons. The prospective ethanol yield is 1800 litres/day with a yield of 0.18 litres per kilogram of maize kernels. Meanwhile, solar energy would be fully utilized to exchange heat with the puree to reach the chemical reaction temperature. The double enzyme process and three consecutive processes of fermentation is used in the ethanol production system. It is concluded that the plant model would recover investment funds in 6 years under government’s tax incentives. The sensitivity analysis for estimated cash flows indicated that the annual yield and retail price of ethanol to be the highest risks of this enterprise.
Keywords: Bioethanol, Inedible maize, Plant model, Biogas, Economic viability
Cite this paper: L. Zhang, R. E. Blanchard, Optimizing the Use of Inedible Maize in the Design of an Ethanol Production Plant in Heilongjiang, China, Energy and Power, Vol. 9 No. 2, 2019, pp. 39-47. doi: 10.5923/j.ep.20190902.01.
Article Outline
1. Introduction
- Increasing energy use has brought about rapid development of the global economy, but recently has become a severe challenge for all countries [1]. Fossil fuels are not only non-renewable, with limited reserves, but they cause environmental problems such as the greenhouse effect and the resulting climate change may threaten human health and survival. While all countries are striving to improve the efficiency of existing energy use, they are also actively seeking new ways of energy utilization through the use of renewable energy. One such technology is bioenergy which has the potential to be sustainable. Indeed, the economic viability of biomass fuels, the benefits of reducing environment pollution and its application for electricity, heat or transport fuels are driving research, development and deployment. In this context, fuel bioethanol is being considered as one of the replacements for fossil fuels. It has been confirmed that maize ethanol could significantly reduce greenhouse gas emissions compared with gasoline [2]. Thus, fuel ethanol has become the most widely used biofuel in the world [3].Whilst bioethanol can be burned directly for electricity generation, it is generally used as a liquid fuel for transportation. It can be used directly or mixed with gasoline. The most common blended gasoline is a mixture of 90% gasoline with 10% fuel ethanol called E10 or ethanol gasoline, which can be used as automotive fuel without modifying the traditional internal combustion engine configuration [4]. In Brazil, fuel ethanol and gasoline are normally mixed in a volume ratio of 24:76 [5]. The ethanol content of the mixed fuel can be increased to 85% with modified car engine; this mixture is called E85 [6]. Fuel ethanol has a high-octane number and the combustion would be more rapid with a high flame temperature, which allows a high compression ratio and short combustion time, so the efficiency of internal combustion engine would be theoretically higher [7].Therefore, the development of economical fuel ethanol production technology is a top priority for many research centres, universities and enterprises. For instance, China National Cereals, oils and foodstuffs Corporation (COFCO) has made numerous experiments and processes to develop this [8]. The establishment of a biomass ethanol plant model should aim to reduce the cost, increase the ratio of renewable energy to non-renewable energy in the system and ensure the sustainability of ethanol production [9].The raw materials of biomass ethanol production can be divided into saccharide, starch and fibre. The extraction of ethanol from sugar is most common in Brazil with sugarcane as the feedstock which has the main component of sucrose [3]. Since the 20th century, ethanol production from sugarcane has developed rapidly in Brazil. Due to the popularity of hybrid fuel vehicles and increasing oil prices, more than 80% of cars produced in Brazil have engines that can run on mixed fuel [9]. Ethanol is usually produced from saccharides in some tropical countries which are rich in fruit. For instance, Aldonza and Blanchard designed a model of an ethanol production plant in St Lucia, an island with a large amount of banana production, and found that a self-sufficient ethanol plant would be beneficial to reduce dependence on oil imports and create employment [4].The process of extracting ethanol from lignocellulosic feedstock is more complicated. Regardless of what process is adopted, the lignocellulose should be pretreated to reduce the degree of polymerization and crystallinity and break the bonding layer of lignin and cellulose [10]. According to reports’ [11], Canada’s Logen company and Petro-Canada jointly invested in the establishment of the world’s first lignocellulosic ethanol pilot plant in 2004, and 4 million litres of ethanol are produced from 15,000 tons of wheat and corn straw per year. The cost of ethanol from this plant was 0.6 dollars/ litre. In 2005, the American company Celunol and University of Florida collaborated to successfully ferment carbon-five in maize straw into ethanol using recombinant Escherichia coli. NREL (The National Renewable Energy Laboratory) researching on the enzyme hydrolysis and simultaneous saccharification fermentation process, has become an internationally recognized in cellulose ethanol production technology [10]. However, there are drawbacks such as long fermentation cycles up to 180 hours, low enzymatic hydrolysis efficiency and high enzyme cost.At present, the feedstocks used in most bioethanol plants are starchy raw materials. In the US, which has high corn annual yields, most bioethanol might be made from corn. The carbohydrates stored in corn are called starch polysaccharides, and it is necessary to break the chemical chains in these starch polysaccharides to obtain glucose before it is fermented into alcohol by yeast [12]. This production method is common in Europe as well [3].China is one of the top three maize producers in the world [10]. Because of the current dependence on fossil energy imports, researching and utilizing maize fuel ethanol could be of great significance for maintaining China’s energy security. However, the large-scale cultivation of maize to be the feedstock of ethanol plants would inevitably pose a threat to food security, causing competition with industrial processes and creating unnecessary market crises, especially in developing countries with large populations. Therefore, there have been few attempts to research and establish models for maize ethanol production plants in China.The aim of this paper is to consider inedible maize, as the raw material, for ethanol production by microbial fermentation. This can reduce environmental pollution and also effectively utilize waste biomass without threatening food security. Meanwhile, using solar energy and bioenergy from maize cob to supply electricity and heating would increase the ratio of renewable energy to non-renewable energy as well in the whole system. The objectives are to evaluate the technological processes, that would combine an ethanol production model with a power production model. In addition, the establishment of a self-sufficient ethanol plant with waste maize as feedstock will be appraised through financial analysis. In this system, it would be assumed that the ethanol plant is built in the province with the highest annual maize production in China, namely HeiLongJiang [13].
2. Overall Process Model Description
- A design schematic of the maize-based self-sufficient ethanol plant appears in Figure 1. In this model, it is proposed that 3,650 tons of waste maize will be provided each year, which means 10 tons per day. The process model is described in this section.
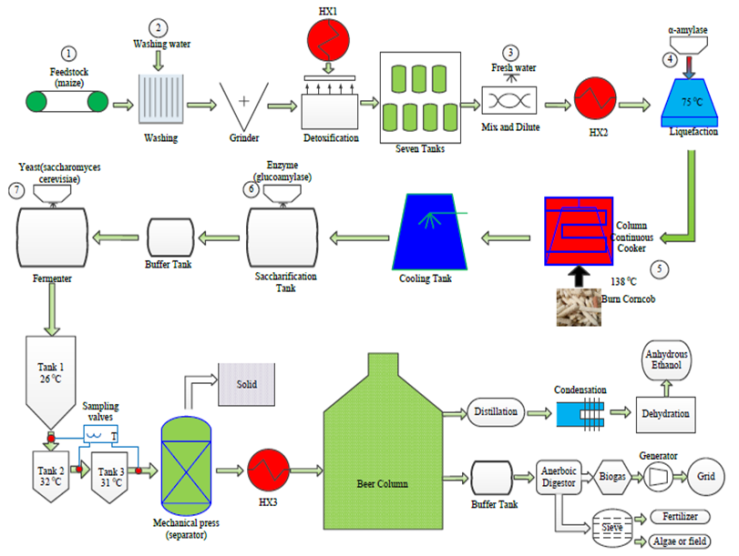 | Figure 1. Design schematic of maize-based self-sufficient ethanol plant |
2.1. Pretreatment
- The first section is pretreatment which includes washing, milling, detoxification and dilution, and the following settings have been made for this process:
2.1.1. Washing and Milling
- The raw materials are washed with fresh water at an ambient temperature (usually about 23°C) to remove dirt and dust. 0.5 litres of clean water would be needed for per kilogram of maize [14], and this water would be treated and discharged or recycled. No heating will be required during this stage. Then, the maize kernel without obvious impurities would be ground through a grinder aims to increase the heat receiving area, which would be beneficial to the subsequent detoxification and gelatinization process and improves the heat treatment efficiency. A hammermill with a rated capacity of 5 tons/hour and rated power of 30 kW would be chosen [15]; if operated for 2 hours per day 60 kWh of electrical energy would be consumed. In theory, the finer the mash the better, but additional processing would bring higher equipment costs and power consumption, so the size of the ground maize kernels are normally between 1.5 and 2.5 mm [14].
2.1.2. Detoxification
- The main purpose of detoxification treatment of inedible maize is to remove the aerobic microorganism aflatoxin. Ammonium hydroxide with an ammonia content of 26% should be used to fumigate the maize powder at a temperature of 30°C [16]. After that, the maize power should be placed in sealed vessels for five days, each with a capacity of 330 gallons (1500 litres) [17], and the density of the ground maize is 1040 kg/m3 [18], so the production rate is 9615 litres/day. Therefore, seven vessels would be needed every day and the plant would need to purchase five sets of seven vessels to provide a continuous process at a cost of £3803. As 100% detoxification can be achieved without hurting the maize quality, this method is widely used in the maize production industry [16].The temperature needed for this process (30°C) should be provided by a 79°C vinasse heat exchange, which is a product of the distillation process. Heat exchangers are classified into parallel-flow, counter-flow, cross- flow and mixed-flow according to the flow direction. Whereas the heat transfer efficiency of the counter-flow heat exchanger is always greater than the parallel-flow, the counter current shell and tube heat exchanger, fabricated in stainless steel, would be used in the factory system.
2.1.3. Dilution and Mixing
- Water should be added and stirred after detoxification for dilution. The rated power of the stirrer is 890 W [19] so the energy required is 21.36 kWh/ day. Setting the dilution rate to around 40% requires 3.84 m3/day of water for 10,000 kg/day of ground maize kernels, leading to a puree volume flow rate of 0.56 m3 per hour. The mass flow rate would be 492.24 kg/hour based on the predicted puree density of 879 kg/m3 [18].The following calculations were based on the assumption that the whole system works for 24 hours a day, 7 days a week.
2.2. Pumping
- A pump is used to deliver the diluted maize puree to the solar hot water heat exchanger. The flowrate of maize puree is 13.44 m3/day. There is a dimensionless value (the Reynolds Number [Re]) used to represent the fluid flow and it is defined as shown below:
 | (1) |
2.3. Liquefaction
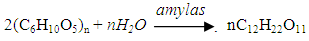
- The effects on the temperature of the puree caused by friction in the pump and pipe and the external temperature are negligible.Solar hot water would be used to increase the puree temperature from 30°C to 75°C. Then the maize puree would be delivered to the liquefaction tank which has a thermal insulation layer to maintain 75°C for 3.5 hours. It is important to maintain the pH value between 6 and 6.5 during liquefaction [20].A double enzyme liquefaction saccharification process would be used in this factory model, and this would require liquefied amylase to be added to the liquefaction tank. The α-amylase is heat resistant and acid tolerant. It is approximately 87% maltose with a small amount of dextrin and glucose in the final hydrolysate [21].
 | (2) |
2.4. Continuous Cooking & Gelatinization
- The system would use a column type continuous cooking method. There are some advantages for column continuous cooking, such as slow flow rate, long cooking time, stable operation, 28% reduction in gas consumption and less sugar concentration loss in feedstocks, compared to other approaches such as pot and tube type [18]. This could contribute to the high utilization rate of starch.The cooking should last for one hour at a high temperature of 138°C in a continuous cooking column [22]. Continuous cooking under high temperature for diluted starchy raw material would completely rupture the tissue and cells, so that the starch granules contained are released. The state of the starch would be changed from granules to dissolved solution [21]. This process is named gelatinization and aims to make the raw material more susceptible to becoming fermentable glucose under the action of the enzyme during the subsequent saccharification process. Meanwhile, high temperature can act as sterilization, which is desirable because bacteria affect the efficiency of the fermenters [23].It would be important to add water continuously because of the high cooking temperature, and supposing that the tap water mass ratio consumed is 1:3.8, which means that the required water per day should be (3840+10000) ×3.8 = 52.6m3. Burning corncob directly can provide the energy for high temperature cooking. It is published that the heat value of corncobs is 17,730 (LHV) kJ/kg [24].
 | (3) |
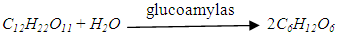
2.5. Saccharification
- Glucoamylase is an enzyme that can convert the sucrose to glucose by hydolysis. The chemical equation is shown as:
 | (4) |
2.6. Fermentation
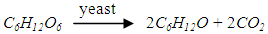
- The mash should be delivered to the fermenter as soon as possible after saccharification. Fermentation takes places continuously in three parallel fermenters, with the yeast in 3 portions [25]. The fermenters have a cylindrical shape with tapered ends top and bottom. The fermenter itself would be sealed with a hole at the top for the purpose of detecting CO2 emissions and recovery tubes, as well as measuring instruments such as feed tubes, interface tubes, and pressure gauges [26]. Three sampling valves are installed at the outlet of each fermenter to detect the fermentation state and pH value at any time. The amount of yeast can be adjusted flexibly also. A drain is fitted at the bottom and water inlets at the top for maintenance and cleaning. It is assumed that the transfer of mash from one fermenter to the next is instantaneous so there is no heat transfer between adjacent equipment. The transfer would be within the cycle of fermentation and be considered as steady-state transfer. According to the literature [27], the required yeast is 2.77×10⁻⁴ kg per kg puree, so the amount would be 4.02kg considering an extra of 5%.The capacity for tank 2 and tank 3 is 465 gallons (2,100 litres) [23], and the tank 1 would be double this size to allow for yeast growth. The temperatures required for the three tanks are 26°C, 32°C, and 31°C for durations of 4h, 12h and 40h respectively. The pre-fermentation period which can be named as the lag period is occurred in tank 1, to allow for yeast growth and the regulation of the growth processes [25]. This period has a great significance for controlling sugar concentration and pH value [22]. The second tank is the main fermenter in which the yeast grows rapidly as oxygen is consumed, and then the yeast stops growing as the alcohol concentration increases. In the last tank, the production of alcohol rises significantly accompanied by the consumption of nutrients, while the quantity and quality of yeast are reduced [28]. The fermentable sugar concentration decreases to a minimum level because most of the sugar in the beer is depleted as a reactant. After that the fermentation is slow; the heat generated and the CO2 production increase at a lower rate.It has been suggested that 92% of glucose can be converted to alcohol during fermentation [21], and the conversion rate might be 0.51kg per kg of glucose, as shown in the following formulas:
 | (5) |
 | (6) |
2.7. Distillation, Condensation and Dehydration
- After fermentation, a mechanical press (a solid-liquid separator) separates the solid (4-6%) from the liquid (94- 96%) [28]. The main component of the liquid is water and ethanol, together with other volatile impurities. 1st stage distillation should be carried out in a beer column with a distillation temperature of 79°C. Alcohol vapor becomes liquid in a condenser. The initial condensation temperature is supposed as 10°C and the condensed water can be heated to an ambient temperature for system recycling through heat exchanging by the waste heat discharged from the generator [29]. A metering pump and return valve are installed to control the flow rate.The ethanol concentration would reach 45% v/v after first distillation and 80% v/v after the second rectification column. The temperatures of this two-stage of distillation are the same and provided by a solar hot water heat exchanger. Maize starch could be used for dehydration because of its excellent absorption performance. The concentration of ethanol can be raised up to 99% after dehydration. It is reported that 8.9g water can be absorbed by 100g maize starch at 50°C and the value would increase to 44.7g at 90°C [4]. The maize starch can be recycled using the hot air from a heat exchanger.
3. Process Electricity Production Model
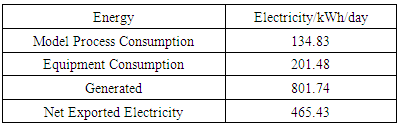
- As shown in figure 1, waste effluent will be anaerobically digested (AD) to produce biogas to generate electricity and reduce the environmental impacts of the process. Stirred tank reactor tanks would be used for the AD and the fermentation could be carried out at ambient temperature without extra heating. It can be assumed that the chemical oxygen demand (COD) of vinasse is 55700mg/L, and the COD removal efficiency is expected to be 70% [13]. Based on this a working volume 200m3 is suggested in 4 vessels, including one for standby. It is expected that 391.15kg per day of COD would be removed. Assuming that the biogas production is 0.33m3 per kg COD removal and therefore the daily biogas yield is 129.08m3. CH4 content of biogas produced by this system can be predicted as 70%. The energy value of biogas is supposed to be 26MJ/m3 [30], with 60% power generation efficiency, and the remaining 40% would be heat loss. It can be calculated that the generated electrical energy is 801.7kWh/day, and the generated thermal energy is 534.5kWh/day.The rating power of biogas generator set of this model is 50kW [21]. Main facilities of the biogas power generation system are generator set and heat recovery device. Biogas should be compressed into storage tank after desulfurization, and then connected to the generator [31]. The generated electrical energy would preferentially support the factory and excess electricity could be sold to the grid for revenue. It would automatically connect to the grid to maintain plant operation if there are some uncontrollable factors such as damaged machines and insufficient power generation. The heat exhausted from generator can be used to dry by-product or maize starch. Excess stored biogas can be manufactured to produce pure methane to supply a gas station. The residue during the biogas production is a highly efficient bio-fertilizer because it is rich in nutrients and has high organic matter [32]. Since the factory is built close to the maize field, it would be also a good option to dry it and subsequently sell it as high-quality fertilizer.In addition to the development of the process model an economic analysis was also performed. The findings from the study are now presented.
4. Results and Discussion
4.1. Process Output
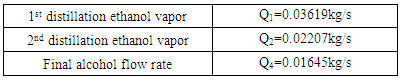
- The ethanol vapor flow rate after fermentation can be described by the equation below:
 | (7) |
 | (8) |
 | (9) |
 | (10) |
 | (11) |
 | (12) |
|
|
4.2. Profitability
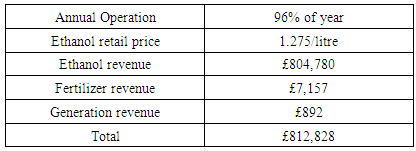
- Stale inedible maize collected from local farmers or grain storage warehouses would be used as the feedstock for ethanol production. That maize is unsuitable for domestic food or animal feed due to toxic microbial aflatoxin and therefore the feedstock could even be cost-free.Anhydrous ethanol is tax exempted when it is produced for fuel in China, as well as its by-products [34]. According to expense of project norms, the construction and installation cost is 700 yuan/m2 in rural areas of Heilongjiang [35].The British Pound (GBP) to Chinese Yuan (CNY) exchange rate was applied at 9.0556 (October 2018) [36]. It is required that the typical retail price of ethanol should be 91% of the price of gasoline. For example, in UK, the price for petrol is about 1.4 GBP/litre [37], and the on-grid power tariff is around 0.13 GBP/kWh [38].The annual revenue for the bioethanol plant is presented in Table.3. The expected operating life of this plant could be 20 years after the one-year construction period, and a 96% uptime in one year is assumed. The years indicated in this article represent operating years. The depreciation for plant assets is estimated as 5% according to the Tax Law of the People’s Republic of China [34]. The maintenance cost could be considered as 7.5% of the operating cost. The discount factor is taken as 7.2%, consisting of 4.9% interest rate and 2.3% inflation rate.
|
4.2.1. Static Evaluation
- a). The capital cost, operating and maintenance costs can be predicted based on the market prices, and their proportions are shown in Figure 2. It can be seen that the cost of raw materials - 48.01%, accounts for the most expenditure, followed by cost insurance and freight (CIF), 27.6%. Therefore, the cost control should focus on the raw material cost and CIF, and they will affect the cash flow if they have fluctuations.
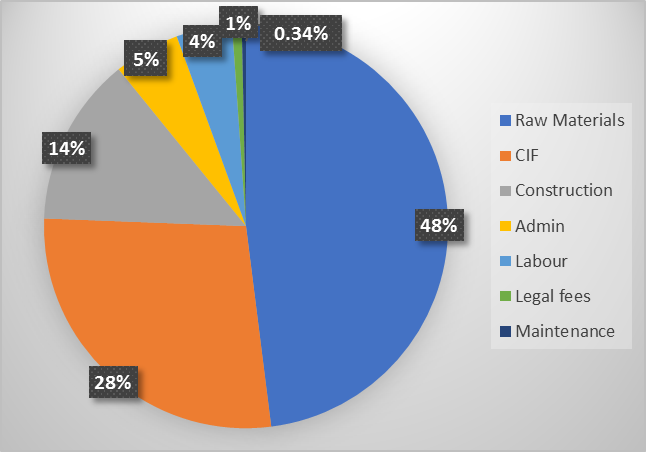 | Figure 2. Proportion cost estimates for plant |
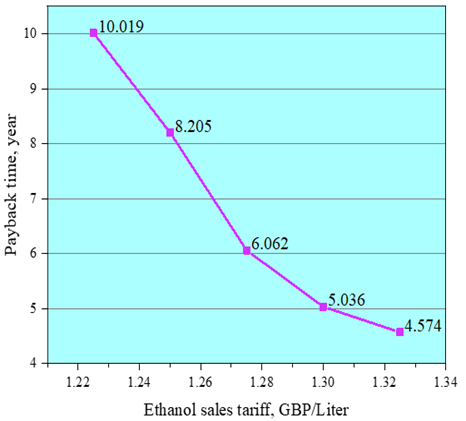 | Figure 3. Payback time dependence on various ethanol tariff price |
4.2.2. Dynamic Evaluation
- a). The Net Present Value (NPV) is the difference between present value of future cash inflows for a particular scenario and the present value of future cash outflows. This indicator can reflect the profitability of an investment and is a financial economic factor that could play an important role in investors’ decisions [39]. A greater than zero number is needed and the larger the value the more optimized the scheme.The NPV of this model factory is shown in Figure 4 for the 20-year operation. NPV becomes positive at the beginning of the7th year of operation, indicating that the project would be likely to achieve good benefits and is worth the investment.b). Internal Rate of Return, IRR, is the discount rate when the total present value of the capital inflow is equal to outflow. It is a rate of return that an investment is eager to achieve and is the discount rate when NPV is equal to zero [37]. If IRR > discount rate, NPV will be >0, and if IRR < discount rate, NPV will be < 0. In this system, IRR could be calculated to be 12.35% which means this project would have a good profitability in consideration of the 7.2% discount rate.
 | Figure 4. NPV estimate of plant over 20yr operation |
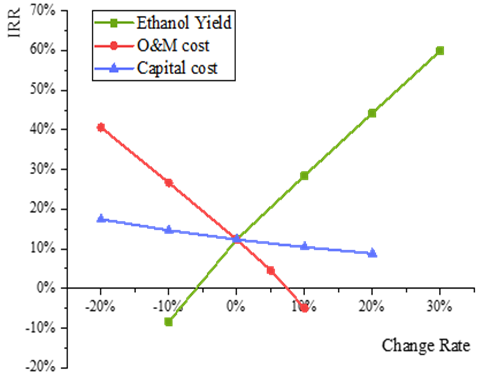 | Figure 5. The variation of IRR (%) versus the changes of ethanol yield, O&M cost and capital cost (%) |
5. Conclusions
- A mathematical programming model was set up for a self-sufficient maize-based ethanol production plant. This considered both the process energy balance and economic analysis. A heat exchanger accompanied with optimized design of bioethanol produced from starchy raw materials were used throughout the model process and gave an indication of the costs in this plant.It is recommended that a factory is built in a rural area close to maize fields or local storage warehouses. In rural areas of China, farmers often put crop wastes like straw on the road or set fire to it, which affects traffic safety and air quality. The factory could recycle and utilize crop wastes like maize cobs, not only making full use of crop wastes but also bringing farmers extra income.In theory, the system does not need to consume non-renewable energy, except if the solar energy is scarce or during an abnormal operating period. Therefore, the model has raised the ratio of renewable energy to non-renewable energy. The results from this system indicated that the yield of corn ethanol was 0.18 litres per kg inedible maize, and the daily electricity consumption through the process is 336.31kWh. 185m3/day biogas were produced by vinasse which can supply 801.7kWh/day of electricity and 534.5kWh/day of heat. So, 465.34kWh/day electricity could be sold to local government for feeding into the grid. The waste after AD was sold as a part of the revenue as well as the extra methane produced. A financial model was established under given assumptions to analyse profitability and investment risk. The predicted 20 years’ cash flows show that the plant can recover all costs at the beginning of the 7th year of operation. The retail price of ethanol would have a great influence on the payback period. Furthermore, a major increase in the payback period results from a slight decrease of ethanol retail price. An IRR of 12.35% indicates that this plant is worth the investment. It is concluded that the self-sufficient bioethanol plant is feasible based on the process model and financial analysis.Bioethanol factories have great potential given the financial and tax support from government. The establishment and operation of an actual production process is needed to validate and optimize the results of this model. Carbon dioxide is a by-product in the process of converting glucose into ethanol, and so it can be considered as an additional source of revenue, although the need for storage and handling of the gas would add to the costs.
ACKNOWLEDGEMENTS
- Dr Andy Cross for his assistance and suggestions in discussing the research problem.
Notes
- 1. Aldonza & Blanchard’s paper on banana waste to ethanol was published in Energy & Power in 2012. DOI:0.5923/j.ep.20120205.012. https://www.bp.com/content/dam/bp/business-sites/en/global/corporate/pdfs/energy-economics/ statistical-review/bp-stats-review-2018-full-report.pdf