E. C. Merem 1, Y. Twumasi 2, J. Wesley 1, D. Olagbegi 1, S. Fageir 1, M. Crisler 1, C. Romorno 1, M. Alsarari 1, A. Hines 3, G. S. Ochai 4, E. Nwagboso 5, S. Leggett 6, D. Foster 1, V. Purry 1, J. Washington 1
1Department of Urban and Regional Planning, Jackson State University, Jackson, MS, USA
2Department of Urban Forestry and Natural Resources, Southern University, Baton Rouge, LA, USA
3Department of Public Policy and Administration, Jackson State University, Jackson, MS, USA
4African Development Bank, AfDB, 101 BP 1387 Avenue Joseph Anoma, Abidjan, AB 1, Ivory Coast
5Department of Political Science, Jackson State University, Jackson, MS, USA
6Department of Behavioral and Environmental Health, Jackson State University, Jackson, MS, USA
Correspondence to: E. C. Merem , Department of Urban and Regional Planning, Jackson State University, Jackson, MS, USA.
| Email: |  |
Copyright © 2019 The Author(s). Published by Scientific & Academic Publishing.
This work is licensed under the Creative Commons Attribution International License (CC BY).
http://creativecommons.org/licenses/by/4.0/

Abstract
Being an emerging economy where the dependence on geothermal power to sustain production over the years in the country ranks high, Kenya’s Rift Valley contains substantial geothermal energy enough to power the economy than most African countries. In the last several years, geothermal production has gained steam, and this has resulted in an unprecedented surge in installed capacity in different sites amid rising demands. This coincides with allocations to optimize the growth of the sector and the investments to boost supply among renewables. With that has come joint ventures and growing prospects in the sector likely to extend into the upcoming decades. Of great significance is the uptick in geothermal power output and its emergence as the second largest source of renewables alongside infrastructure proliferation. While this reflects the profile of Kenya as a major producer worldwide, geothermal power continues to serve the nation through improved access to electricity for communities and firms as clean source of energy with low carbon foot print and limited environmental impacts due to many factors. Considering the rising usage and the role of Kenya as regional leader in geothermal energy output, very little has been done in the literature to assess current capacities and the state of the resource. Added to that, previous studies overlooked the use of mix model in tracking the status and evolving patterns of geothermal parameters from production to installed capacities in the country. This paper will fill that void by analyzing geothermal energy use in the East African Nation of Kenya. Emphases are on the issues, trends, impacts, production, factors and current efforts to boost production. Using mix scale methods of GIS and descriptive statistics, the results show changes in usage, rising production in geothermal energy and spatial dispersal of various indicators from assets to elevation along the Rift Valley. With the emergent trends attributed to socio-economic and physical factors, the paper recommended the need for education, support for energy infrastructure development, spatial analysis and the design of a regional geothermal energy information atlas.
Keywords:
Geothermal energy, GIS, Production, Kenya, Electricity, Rift Valley
Cite this paper: E. C. Merem , Y. Twumasi , J. Wesley , D. Olagbegi , S. Fageir , M. Crisler , C. Romorno , M. Alsarari , A. Hines , G. S. Ochai , E. Nwagboso , S. Leggett , D. Foster , V. Purry , J. Washington , Analyzing Geothermal Energy Use in the East African Region: The Case of Kenya, Energy and Power, Vol. 9 No. 1, 2019, pp. 12-26. doi: 10.5923/j.ep.20190901.02.
1. Introduction
Under a network of rugged geologic fault lines and volcanic sites dispersed north to south axis across the Great Rift Valley in the Eastern African region. Kenya’s Rift Valley boosts of vast geothermal reserves estimated at 10,000 MW spread over 14 sites [1-3]. While Kenya ranks as one of the largest producers of geothermal power in the globe [4, 5]. Geothermal power plants which convert steam generated from hot rocks deep underground into electricity, occupies a vital spot in Kenya’s main development plans [6]. At that, geothermal energy has numerous advantages over other sources of power, as it is not affected by drought and climatic variability [7]. Given its highest availability (capacity factor) at over 95% [8], geothermal power is not only green with no adverse effects on the environment [9], but it is also locally available in Kenya unlike conventional energy source that is heavily dependent on imported fuel [10-12]. Being an emerging economy where the dependence on geothermal power to sustain production over the years has risen, the country ranks high globally ahead of many advanced economies in geothermal output [13]. Just as Kenya’s Rift Valley contains substantial geothermal assets enough to power economic development than most African countries [14]. The increased geothermal power [15, 16] will have a significant impact on the country which has for long depended on expensive fossil fuel generators to make up for lethargic power supply [17]. For Kenya, geothermal represents a more reliable and sustainable energy option in comparison to other popular sources [18-20]. This comes at a period in which hydro-electric power, once a staple of the Kenyan power grid, has begun to dry up in the face of erratic precipitations emanating from changing climatic parameters. Furthermore, from the often-unpredictable rainy seasons, hydro power sources in Kenya frequently fails to provide enough energy and runs 42% below capacity. Compounding the matter, only 16% of the population currently has access to electricity [21]. For those who do, electricity power rationing has become a regular nuisance due to undependability and inefficiency [22]. Given the economic cost, Kenya has no other choice than tap into its vast reserves in geothermal energy sources [12]. Accordingly, Kenya now has the geothermal potential to deal with its energy crisis given the uptick in output, capacity generation and new installations and plants springing up in diverse locations [23, 24]. With that has come joint venture initiatives and growing prospects in the sector likely to extend into the upcoming decades [15]. Of great significance in all these is the surge in geothermal power output and its emergence as the second largest source of renewable energy alongside infrastructure proliferation in various locations in Kenya [2, 3, 20]. Thus, in the last couple of years in the country, geothermal power production has gained steam, and this has resulted in an unprecedented rise in capacity installed in different sites in lieu of rising demands [25-28]. This is evident from ongoing initiatives to optimize the development of the sector and the volume of investments geared at boosting supply among renewables [23, 29, 26]. All these have trigged a fresh scramble for renewable energy access and security in a crowded field in the East Africa region with Kenya as the lead nation and the new frontier in geothermal energy [30, 31]. Of the 18,000 MW in geothermal potential in the East African region in 2016, Kenya held over 50% of the total load more than its neighbours from Tanzania to Ethiopia [32]. With such abundant treasure readily available, currently, Kenya has set out ambitious targets that will involve the expansion of geothermal production capacity to 5,000 MW by 2030 [1], coupled with a medium-term goal of 1,887 MW in installed capacity in 2017. In 2014, the output of geothermal power as source of electricity peaked at 415 million kilowatts per hour (KWh) in August [33]. At that pace, the geothermal plant at Hell’s Gate delivered power to 500,000 households and 300,000 small businesses [5]. In addition to that, geothermal energy has not only found widespread usage nationwide, it represents an enormous potential to further expand the floriculture and horticulture industries in Kenya that generates US$1billion yearly [34]. At Oserian flowers, one of Kenya’s largest exporters, geothermal steam often warms greenhouses and generates electricity at its two other power plants where heating allows the company to sell 400-380 million flower stems each year [5, 35, 36].Worthy of note in all these, is the role of geothermal power in improving the fortunes of many Kenyans [37, 19] through economic prosperity, the reductions in electricity tariffs for consumers and operational costs of firms [24, 34]. With less carbon footprint on the economy and the ecosystem, the benefits of geothermal energy remain enormous [34, 12]. Such revival in Kenya’s renewable energy security via geothermal power [38-40]; are linked to changes in socio-economic, geologic, physical and ecological factors located within the larger energy nexus [34]. More so, very little has been done to capture these trends in East Africa by fully assessing the output, usage, capacity and the potentials of Kenya using a mix scale approach [41-44]. For that, this study will fill that void by analyzing geothermal prospects in Kenya. Emphasis are on the issues, trends, factors, efforts and impact analysis. The paper’s major objective is to assess geothermal energy use and the extent of variations. In terms of organization, the paper is divided into five sections. The first part covers the introduction, while the second part highlights the methods and materials. Section three presents the results of data analysis made of descriptive statistics, spatial analysis of GIS mapping, factors and impacts. Section four deals with discussions, while section five provides the conclusions and recommendation.
2. Method and Material
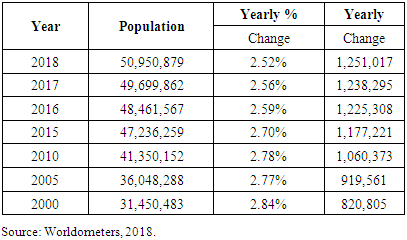
The study area Kenya, with a population of over 50 million stretches through a 580,367 km2 area in the East African region [45]; (Figure 1, Table 1). It extends from the coast on the Indian Ocean to the low plains and central highlands. The highlands are intersected by the 6000km2 Great Rift Valley, a major land form rich in geothermal energy with an opulent plateau stretching through to the East [9]. Surrounded by ecological diversity, Kenya’s rift valley boosts of a robust safari scenery coupled with a vast tapestry of extensive land rich in wildlife [4, 9]. In the process, a substantial population of many wild animals, reptiles and birds roam around geothermal reservoirs in the country where agriculture accounts for 33% of the GDP [46]. Table 1. Kenya’s Population 2000-2018
 |
| |
|
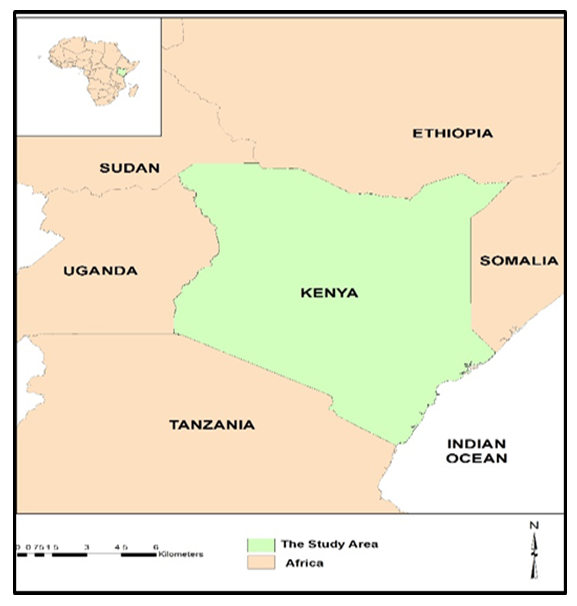 | Figure 1. The Study Area, Kenya |
Besides a current GDP of $176 billion in 2018 and projected growth of 5%-6%, as the economic and transport hub of East Africa [46]. The underground terrain in the Rift valley is a geothermal hotspot fuelling economic resurgence and energy security in the country [12, 47]. In other words, Africa’s Great Rift Valley where the continent is slowly splitting to one side and the terrain’s crust disperses, extends across the middle of Kenya where access to hot rocks below the surface has put enormous treasure of geothermal power comfortably within reach [31, 47]. Although, geothermal energy can exist in everyplace in the globe. However, the thing that keeps it reachable in Kenya is the fact that the earth’s shell is quite tinny, thus the vapor inside flows out openly without difficulty and hereafter it can be used for power production [47, 16]. This is evident at the Olkaria, the biggest geothermal plant in Africa, encircled by forested mountains and wildlife habitats. Located 120 Km (75miles) Northwest of Nairobi, the facility contains a web of tubes which run deep underground [2, 24, 26, 21, 48]. At a time in which Kenya’s Vision 2031 plan places highest premium on low-carbon development together with renewable energy expansion alongside geothermal power assuming greater part [49]. The region’s sub terrain, geothermal hotspot and reservoir storing blistering water sources and steam at 300 degrees Celsius (572 degrees Fahrenheit), is piped up to the exterior from pits of about 2,000 metres (6,500 feet) [6]. Once the fluid flows through to a plant, the steam then powers a generator turbine to produce electricity. Because the overall potential is immense, there are more than a dozen possible high temperature sites dispersed all over the Rift Valley with an appraised potential of 10,000 MW that quadruples the nation’s present output capacity [12, 5, 50]. Additional locations comprise of Homa Hills in Nyanza, Mwananyamala on the Coast and Nyambene Ridges. Besides being at different stages of development, Kenya seems pressed in exploiting its geothermal treasures [51]. In the past decades, it produced 45 MW of power through geothermal energy in 1985 and today generates around 630 MW; virtually 400 MW of that output came online starting in 2014 [5]. Regardless of the volume, that is a substantial load of power production in the geothermal sector. Rapid growth of that scale makes geothermal power a promising source of renewable energy likely to double for a country of 51 million people by 2050 [48, 1, 21, 52, 53]. Further development of those sites could put Kenya on the same levels amongst the major global producers of geothermal power [54, 55, 56]. With the installation of two new production units at Olkaria recently, Kenya doubled its production of geothermal energy to 609 MW. Under an average population yearly change rate of 2.68% from 2000 to 2018, Kenya’s population grew from 31 to 50 million during those periods amidst fluctuating power supply over the years [45, 5]. Serving the daily needs of such a teeming population through the provision of infrastructure still depends heavily on renewable energy access and security [57]. For that, Kenya’s large dependence on hydroelectricity production made the nation susceptible to climate change impacts, in the form of droughts and irregular precipitation patterns. Meeting its set development goals in those circumstances requires a more robust and steady supply of electricity which now rests on the exploitation of geothermal energy [58], while speedily building its base load of electricity output to address growing demands [32]. Given the prospects in recent years, geothermal energy is being glaringly viewed more as one of today’s reliable renewable energy sources crucial in future development plans by decision makers in the country [59, 60]. In that way, the Kenyan government lists access to electricity in the nation among one of its key priorities and intends to increase production by 2020 in order to meet the yearly surge of 11% in demand [10, 26].
2.1. Method Used
The paper uses a mix scale approach involving descriptive statistics and secondary data connected to GIS to assess geothermal energy use and potentials and the related issues in Kenya over the last several years. The spatial information for the enquiry was obtained from several agencies consisting of the World Bank group, the United Nations Environment Program, Geothermal Development Company (GDC), Global Energy Development Institute (GENI), Wallam Energy, and the United Nations Economic Commission for Africa (UNECA) and Global Energy Observatory. Other sources of spatial info emanate from the United States Agency for International Development (USAID), the United Nations, African Development Bank, the Icelandic International Development Agency and the Nordic Development Fund, the African Union and Think Geo Energy. In addition to that, the Government of Kenya, The Japan International Cooperation Agency (JICA), the Organization for Economic Cooperation and Development (OECD) and The European Union (EU) also offered other essential information in the research. Generally, most geothermal indices germane to the Kenya and its regions were obtained from the Kenya National Bureau of Statistics (KNBS), the Kenya Ministry of Energy and Petroleum, Electricity Regulatory Commission (ERC) of Kenya, Kenya Electricity Generating Company and the World Energy Council for some of the years.On the one hand, the International Energy Agency (IEA), International Renewable Energy Agency (IRENA), US Department of Energy (DOE), Energy Information Administration (EIA), Geothermal Energy Association, US-East Africa Geothermal Partnership (EAGP) and United States Energy Association (USEA) provided the secondary data on the ranking, averages, and totals of capacity, percentages and production index. On the other, The Renewable Energy for the 21st Century (REN 21), Global Environment Facility, the OPEC Fund for International Development and the World Bank’s International Development Association (IDA), World Energy Council and Geothermal Energy Association Infrastructure Consortium for Africa offered the time series data, physical information on geothermal stocks on the major sites highlighting the potentials in the country. For additional data needs, the Kenya Electricity Transmission Company, Africa Geothermal International, French Development Bank and World Energy Council were respectively critical in the procurement of information on the availability of hydrothermal prospects, consumption, prices, and econometric data highlighting usages and the changes. Given that the regional and federal geographic identifier codes of the nation were used to geo-code the information contained in the data sets. This material was processed and analyzed with basic descriptive statistics, and GIS with attention to the temporal-spatial trends at the national, state and regional levels in Kenya. The relevant procedures consist of two stages listed below.
2.2. Stage 1: Identification of Variables, Data Gathering and Study Design
The initial step in this research involved the identification of variables required to analyze the extent of geothermal energy availability, output and changes at the national level from 2005 to 2017. The variables consist of socio-economic and environmental information, energy indicators, made up of planned capacity additions for geothermal power, capacity, percentage of additions, averages, new power plants to come online, nameplate capacity, rankings, number of plants, plant types, conventional geothermal potential, percentages, cumulative installed geothermal power capacity, projected capacity and percent. The others encompass geothermal energy production through electricity, the percentage of geothermal electricity production, geothermal countries installed power generation capacity and the rates, current projected geothermal capacity and beyond. Added to that are the sources of electricity capacity, generation, and sources, population and population growth rate. These variables as mentioned earlier were derived from secondary sources made up of government documents, newsletters and other documents from NGOs. This process was followed by the design of data matrices for socio-economic and (energy variables covering the periods from 2005, 2010, 2014 to 2017. The design of spatial data for the GIS analysis required the delineation of county boundary lines within the study area as well. Given that the official boundary lines with the country and its regions remained the same, a common geographic identifier code was assigned to each of the area units for analytical coherency.
2.3. Stage 2: Data Analysis and GIS Mapping
In the second stage, descriptive statistics and spatial analysis were employed to transform the original socio-economic and energy data into relative measures (percentages, ratios, averages and rates). This process generated the parameters for establishing, the extent of geothermal energy potentials, production and projections, and capacities, installed facilities, new plants and established markets driven by rising demands for alternative power supply and the trends sweeping across the country’s regions through measurement and comparisons overtime. While the spatial units of analysis consist of counties, region and the boundary and locations where geothermal power operations and growing use and potentials and prospecting flourished, this approach allows the detection of change, while the graphics highlight the actual frequency and impacts, rankings, outputs, and the intensity of usage and the trends as well as the economic costs. The remaining steps involve spatial analysis and output (maps-tables-text) covering the study period, using Arc GIS 10.4 and SPSS 20.0. With spatial units of analysis covered in the regions and counties (Figure 1), the study area map indicates boundary limits of the units and their geographic locations. The outputs for each county or units were not only mapped and compared across time, but the geographic data for the units which covered boundaries, also includes ecological data of land cover files and paper and digital maps from 2005-2017. This process helped show the spatial evolution of location of various activities and the trends, the ensuing economic and environmental impacts, benefits, as well as changes in other variables and factors driving geothermal energy surge and impacts.
3. The Results
This section of the paper focuses on temporal and spatial analysis of energy trends in the study area. There is an initial focus on the analysis of geothermal potentials, markets and capacities. The other portions highlight installed capacity, regional scope, cumulative power loads, electricity production and others based on descriptive statistics. This is followed by additional components consisting of an impact assessment, GIS mappings, and the identification of factors influencing the emergence of geothermal energy in Kenya and the current efforts.
3.1. Energy Analysis: Potential, Markets, and Capacities
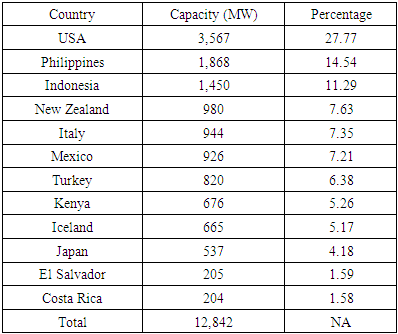
In the context of geothermal market and potentials from 2012 to 2016, note that under developing power markets in 2014, the combined power capacity of the countries stood at 1,302 MW. Based on the countries listed from various areas of the world, the South European nation of Turkey and Kenya not only topped the rankings with 275 MW and 21.12% of all outputs, but Kenya placed second with 257 MW to 19.73% of the intended market in the development of geothermal potentials. Another important point from the table stems from the capacity of the trio of Latin American nations (Costa Rica, El-Salvador, and Nicaragua) and the larger economies like Russia, Portugal and Germany listed below Kenya. In other words, Kenya surpassed all these countries in the actual rankings therein (Figure 2).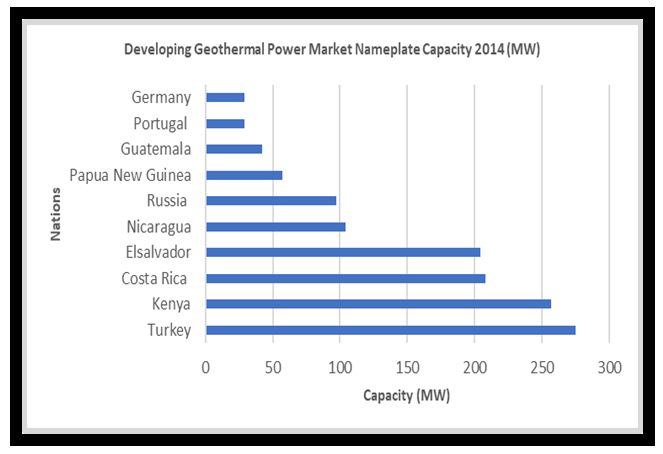 | Figure 2. Developing Geothermal Market Capacity, 2014. Source: GEA 2014 |
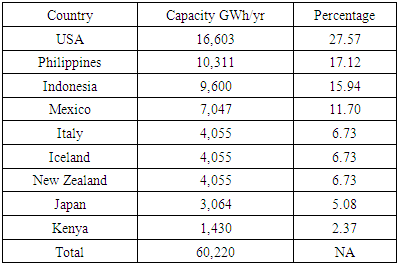
Considering the proximity of some of the nations (US, Philippines and Indonesia) to the Pacific Ring of Fire, it is not surprising to see their average and total distribution of established geothermal markets listed as 1,055 MW to 12,660 MW. Aside from established geothermal market capacity of 3825 MW to 30.21% in the US, both the Philippines and Indonesia also had power loads of 1,915 to 1,380 MW representing 15.12 to 12.21% of the entire markets. Kenya on the other hand, placed eight with 600 MW to 4.73% of the total geothermal market volume. Further down the listing, the East African nation still sits above other nations such as Japan, Costa Rica, Turkey, and El-Salvador as the established geothermal markets in total capacity in 2015 (Figure 3).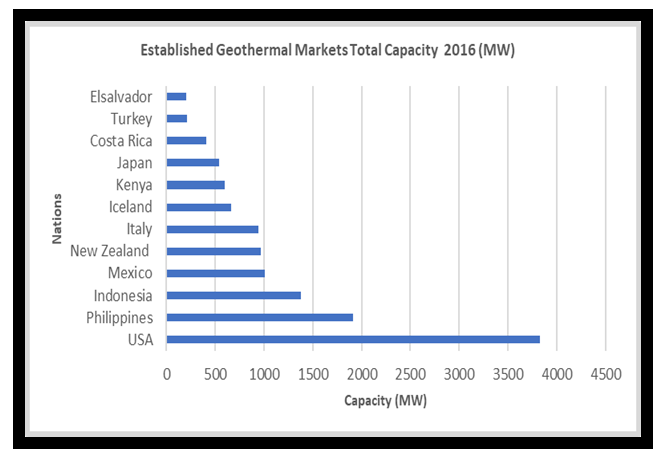 | Figure 3. Established Geothermal Markets Total Capacity 2016 |
3.1.1. Installed Capacity and Additions
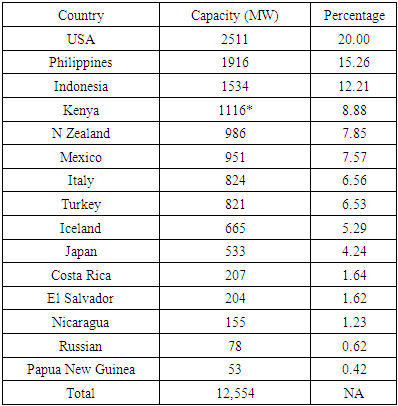
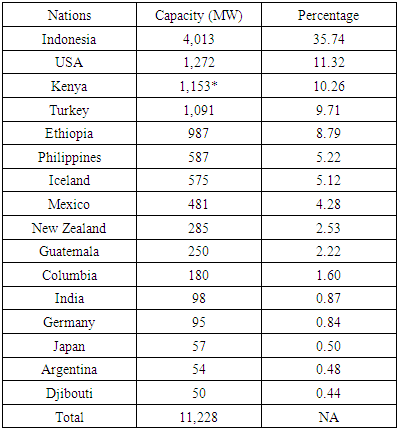
In the fiscal year 2016, Kenya’s position as an emerging player in geothermal energy seemed evident with its ranking in net installed geothermal capacity by country and planned capacity addition. With a trio of nations (USA, Philippines, and Indonesia) accounting for the highest volumes in energy capacity (2,511, 1,916 and 1,534MW) and percentage levels of 20%, 15.6% -12.4%, Kenya held firm to the fifth spot at 1,116 MW to 8.88% in capacity addition as the only African nation on the list. At an overall load of 12,554 MW and average of 830 MW in 2016, Kenya’s planned capacity in that year based on the table, exceeded the levels for New Zealand, Mexico, and Italy measured at 986, 951, 824 MW at percentage levels of 7.85-6.56. The other group of nations (Turkey, Iceland and Japan) listed below Kenya on the geothermal planning indices in 2016 had power production loads of 821, 665 MW to 533 MW. This represents 6.53%, 5.29% to 4.24 percentage points while the remaining nations on the table from Costa Rica to Papua New Guinea rounded up the listing on a much lighter note than the others (Table 2). Again in 2016, note that in terms of planned geothermal capacity additions distribution, Kenya moved a spot further up with 1,153 MW even though below Indonesia and USA, where planned additions of geothermal power in 2016 stood much higher at 4,013-1,272 MW (Table 3).Table 2. Net Installed Geothermal Power Capacity by Nation, 2016
 |
| |
|
Table 3. Planned Capacity Additions for Geothermal Power
 |
| |
|
Looking at the percentage levels for the top nations on the list, Indonesia dominated all with 35.74% as US and Kenya followed with identical levels of 10.26-11.3%. Closer to that, comes Turkey with 1,091 MW and 10.26% of the total. Among the group of African countries listed, both Ethiopia and Djibouti had proposed capacity additions in geothermal power in 2016 estimated at 987 MW to 50 MW representing 8.79% to 0.11%. Once again, many advanced economies from Iceland, India to Germany were listed below Kenya in terms of proposed capacity additions in 2016 (Table 3).
3.1.2. Regional Scope and Cumulative Distribution
At the regional and national level, Kenya boosts of a large network of new geothermal power plants slated to come on line from 2014 to 2015. Being about 302 MW overall in name plate capacity in the Olkaria field area of Nakuru county in the country, the info indicates, of the 4 different fields operated by Ormat and Kengen, in 2014 new binary power plants identified as Olkaria 3 plant under Ormat had a name plate capacity of 220 MW. The remaining group of plants tagged as geothermal cover single flash fields at Olkaria unit 4-5 were operational at similar capacities of 70.0 MW. In the same area, note that Olkaria IV, as the other new plant that came into operation accounted for about 140 MW power capacity [46]. Within the East African zone, see that under the current total and average (18,000 MW to 3,000 MW) loads in geothermal generated potential, Kenya outpaced the other countries. In terms of regional breakdown of the loads amongst nations of East and Horn of Africa in March of 2016, Kenya accounted for 10,000 MW in geothermal potentials. This represents over 55% of current geothermal energy available in the area. While the nearest nation (Ethiopia) in the Horn of Africa side ranked second with about 5000 MW in geothermal energy availability. The nation of Djibouti which finished with 1,200 MW and 6.6% of the combined total stood ahead of a trio of East African neighbours made up of Rwanda, Tanzania and Uganda. These countries based on the info, contained geothermal potentials estimated in the hundreds of MW or low percentage digits far below those in the Horn of Africa (Figure 4).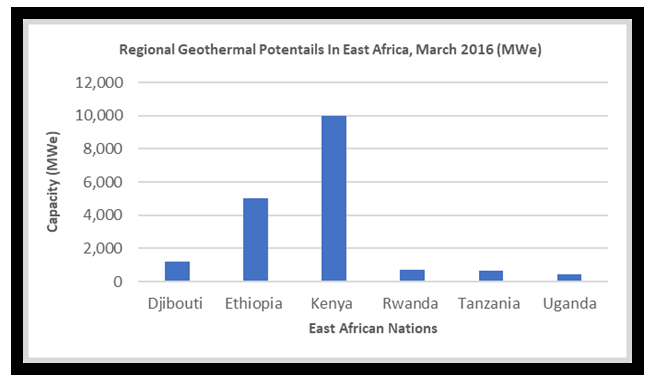 | Figure 4. Regional Geothermal Potential, East Africa. Source: GEA 2016 |
Furthermore, the cumulative geothermal power capacity for Kenya by 2007 to 2017 showed the country used up 3,816 MW at an average of 346 MW in a span of 10 years. From the temporal patterns of the geothermal installations, the power capacity point to notable increases in the first three years from 2007 through 2009. In the same individual periods, Kenya saw its cumulative installations in geothermal power grow from 170-174 MW. During the ensuing years (2010, 2011-2012) came a surge of 209-212 to 217 MW respectively in cumulative installed geothermal energy. The same patterns persist in other periods, (2013, 2014, and 2015) when installed geothermal power capacity jumped from 253 MW, 450 MW to 605 MW. By 2016 through 2017, the capacity of installed geothermal power rose substantially to 676 MW in both periods. This involved a yearly growth rate of 15% for 2017 and 4.7% (Figure 5). At that level, the projected capacity of geothermal in Kenya by 2031 at 5,530 MW will account for the 26% of available (21,620 MW) energy sources in the country in a way that will exceed conventional sources like electricity [46].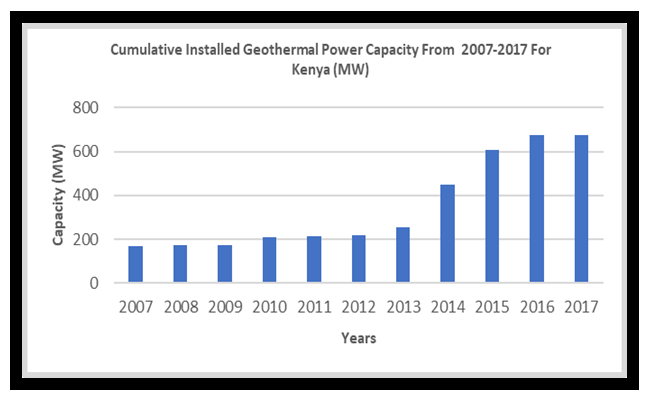 | Figure 5. Cumulative Installed Geothermal Power. Source: BP 2018, IRENA, IGA, TGE |
3.1.3. Dimensions of Electricity Production and Others
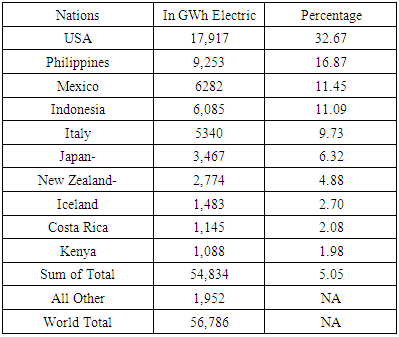
Consistent with the observations so far, the geothermal production volumes for electricity in Kenya all through 2005 to 2010 remained promising. Regarding the top 10 countries globally that had combined geothermal source in the generation of electricity of 54,834 GWhr in 2005. The bulk of the output (17,917 GWh to 92531 GWhr), listed on the data, in the over 6,822 to 6,085 GWhr category were fully concentrated in four countries identified as the USA, Philippines, Mexico and Indonesia. With the elevated percentage equivalence of 32.67%-16.87% and 11.00% in the electricity production among these nations obvious, Kenya on the 10th spot generated 1,088 GWh at 9.98% in geothermal power for electricity production (Table 4). In the ensuing year of 2010, Kenya’s geothermal electricity production rose to 1,430 GWhr at a percentage level of 2.37 (Table 5). Added to that, the amount of installed geothermal capacity for Kenya stood at 676 MW in 2017, a level that outpaced Japan, Iceland and Costa Rica. Even though the installed capacity for Kenya during the same period lagged below the levels for the US, Philippines and Indonesia, Kenya remains a major player given its size, economy and rising population (Table 6). Considering its significance in the East African region and the projected capacity from 2016 to 2025 and beyond. Kenya’s power load is expected to grow from an initial value of 617 MW in 2016 going by rising population and demands for geothermal power. For that, the projected demand for Kenya will rise by 932.16 MW to 1,247.2 MW in geothermal energy by 2025 and beyond [46]. This represents a growth rate of 51.04% to 10% [46]. Looking further down the line, it is also clear once again that the geothermal capacity of Kenya all through the periods 2007 to 2016 increased. From the opening loads of 132 MW to 202 MW during fiscal years 2007 to 2011, the nation’s geothermal thermal capacity jumped from 217 MW and 253 MW in 2012 to 2013. By the ensuing years of 2014, 2015 and 2016, geothermal capacity surge reached maximum levels of 600 MW to 1,091 MW [46].Table 4. Geothermal Energy Production 2005 The Top 10 Countries Electricity Production
 |
| |
|
Table 5. Geothermal Electricity Production 2010
 |
| |
|
Table 6. Geothermal Countries Installed Power Generation Capacity January 2017
 |
| |
|
3.2. Environmental Impact Assessment
3.2.1. Sensitive Ecological Parameters Less Vulnerable
From its novelty and gradual emergence as an essential component of current energy policy framework in Kenya, part of the questions being raised across every nook and corner in regulatory settings among environmentalists touches on the effects of interactions between geothermal energy activities and sensitive ecosystems along the Rift Valley. Among proponents of the emerging technology, geothermal energy is essentially a renewable source obtained from the heat of the earth, chiefly in volcanically active areas. It is a clean energy, or green, because its carbon footprint on the environment is minimal. All in all, geothermal energy comes from a mixture of water and steam under pressure tapped from nearly 2km beneath the earth. Just as geothermal power is widely considered a preferable, low-cost renewable energy source due to low emissions when compared to thermal sources. It is also cheaper than thermal power when used as an alternative to lessen dependence on fading hydropower generation due to pressures from aridity in the face of changing climatic parameters. In the region where geothermal resource lies beneath clusters of ecologically fragile areas in the vast East African Rift Valley [46]. The present production area of Olkaria covers 11 km2 and has an estimated load 400MW with a total of 53MWe of electricity currently being generated therein. In such a setting, the belief is that geothermal explorations should therefore be carried out with minimum negative impacts on the environment and the local communities. Accordingly, in the study area, the socio-economic and environmental impact assessment of Olkaria East geothermal plant, which has been in operation for the last 20 years remains highly indispensable. On the spot assessment of the two decades of activities at Olkaria facility indicated that under suitable organization, geothermal energy production can co-exist with ecological preservation [60].
3.2.2. Environmentally Benign Practices and Benefits
For some time now, the scale of activities at Kenya’s Hell’s Gate National Park, has gradually unlocked the keys of untapped reservoir of a much-needed energy treasures for the East African nation. Known for its rich Maasai culture and its plentiful thermal springs, Hell’s Gate has now emerged as a hotspot for sustainable geothermal energy production in the East African region. The expanding Olkaria geothermal plant located within the park has led the effort to tap Kenya’s geothermal resources. With funding from the World Bank group, the energy facility has excavated vast network of sub terrain pipes running deep to offer carbon-free power to Kenyans. Although geothermal power has led to rapid expansion of electric power access in the zone, there exists some environmental trade-offs. However, there are challenges involved in drilling in Hell’s Gate, a 26-square-mile area among the country’s minor parks classified as UNESCO global heritage site. To that extent, ecologists are against any geothermal energy extraction therein. They grumble that the network of pipes installations and the operations of power plants are destructive to the fragile ecosystem and leave in their wake blemishes to natural process. For the people at Ken Gen, the company conducts environmental assessments and tries to mitigate impact. The organization integrates wildlife locomotion and safety in its development schemes. In the process, KenGen has abstained from drilling in high risk areas of Hell’s Gate habitat that would threaten the plants and animals notwithstanding the presence of major geothermal potential. At Hell’s Gate, the network of geothermal pipes offers major lure for eco-tourists. In that way, KenGen has started a geothermal venture, emulating an Icelandic power firm that developed a recreational aquatic attraction that utilizes water recycled from an adjoining geothermal facility to heat its pools [5].
3.3. GIS Mapping and Spatial Analysis
The GIS analysis covers geothermal assets adjacent to human settlement, potentials on the Rift Valley, the elevation model, geothermal treasures along volcanic paths, and network of renewable facilities across Kenya. Being a lowland region that forms where tectonic plates move starting in Tanzania in the South to the North, the Rift Valley fissure amid built up areas of cities in Kenya constitutes a major topographical feature germane to geothermal sourcing in the country. Considering the network of geothermal assets and potentials as well as the growing presence of human settlements in the study area. It is clear, based on the information from the map that the Rift Valley system passes through a large swath of area stretching across major cities and towns from the Lower Western portion in the Southern edge to the upper North synonymous with rising demand for electricity supply and geothermal development. These configurations in a zone with recurrent energy insecurity adjacent to cities in the map, form part of an intra-continental ridge system that moves north to south in Kenya and further to Uganda and Ethiopia. Aside from the proximity of human settlements to geothermal sources, facilities and other geologic parameters from fault lines, the availability of lakes to volcanic sites makes increased access to electricity power within the fingertips of many communities a possibility. Note also that, the map depicts clusters of areas surrounded by populated centers and geothermal sites between Lake Magadi in the South West to Longonot and Kisumu and Kakamenga, zones coupled with the presence of Lakes such as Lake Bogoria and other natural areas. In other words, while there exists a major connection between the distribution of geothermal sites, the lakes and the rift valley fissure, the existence of network and patches of hydrothermal features run through major population centers and ecological areas and fault lines. Similar patterns also hold for the capital city of Nairobi in the South West not far from the core areas of the fault lines in the zone (Figure 6).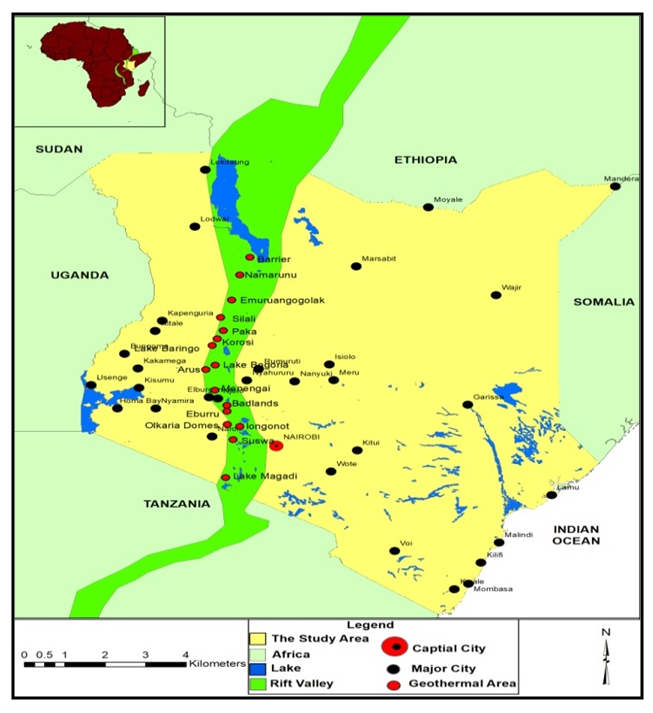 | Figure 6. Geothermal Assets Near Human Settlements |
Pertaining to the potentials of geothermal assets, the mapping provides an interesting perspective. With the potential geothermal assets characterized by a plethora of lakes, water bodies, hydrothermal sites and the rift valley running south to North, it is evident that Kenya’s geothermal sites appear concentrated fully along the Rift Valley zone. Beginning from the Tanzanian border along the Lake Magadi axis adjacent to some network of lakes. Further on the Lower Southwest appears another group of areas (Suswa, Longonot, Olkaria Domes, Eburru) within the vicinity of geothermal sites germane to the daily supply of energy. Along the West or North Central zone emerges a gradual dispersal of the sites characterized in red color with the Rift Valley denoted in light green and slight gaps in between. Towards the North East edge of the map (around Lake Baringo, Korosi, Paka, Silali), the geothermal sites in place appeared closely attached to one and another or fully converged within the same vicinity. That is followed by a sudden spread from Emuruangogolak in the North, to Namarunu and Barrier zones in the Upper North of the country near the Ethiopian border (Figure 7).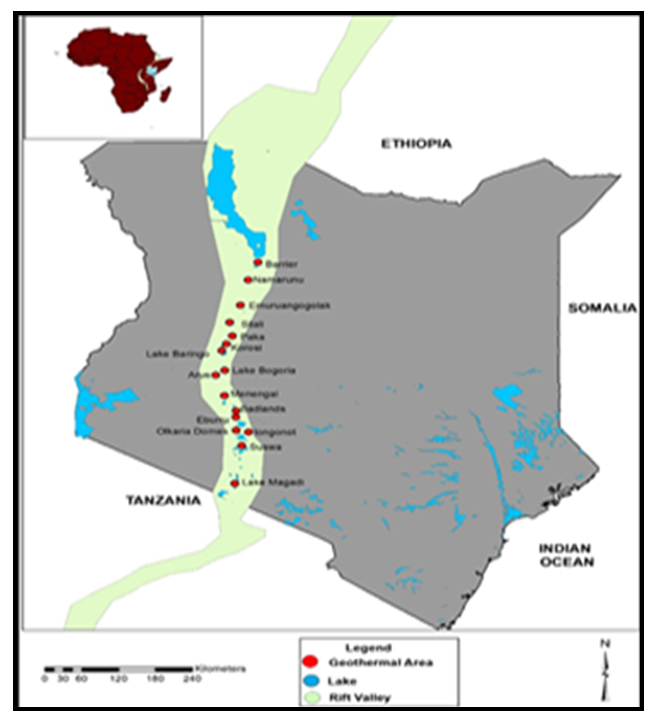 | Figure 7. Distribution of Key Energy Potentials Along the Rift Valley Zone |
Another thing to glean from the geothermal potential in the study involves the geographic distribution of the elevation index and relationship to the sites of geothermal assets in the country. Bearing in mind the information contained in Figure 8, see that, the lowest areas appear concentrated along the coastal south zones of the Rift Valley represented in light red and purple or blue where the scale stands at 0 m. The areas with the most clusters of potential sites as represented in the elevation are the ones in blue, red and yellow. Out there, the highest elevation levels of 4,774 m mostly in yellow color, held firm in some parts of Lake Baringo, Lake Bogoria, Menengai, the Eburu axis and other spots measured at over 4,000 m across the nation. From the model, the spatial distribution of the elevation points (red, blue, and yellow) germane to geothermal prospects seems concentrated along blend of areas representing the central part, the northwest, south west and the south east corner of the map (Figure 8). 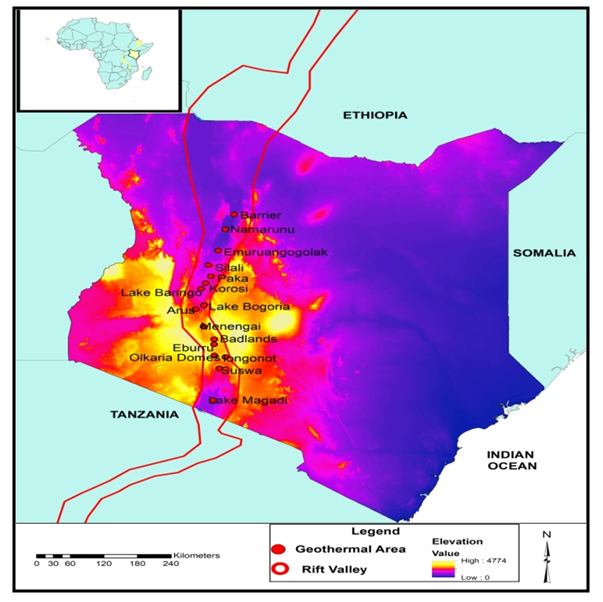 | Figure 8. Elevation in the Vicinity of Geothermal Hot Spots |
Of great importance in the spatial display of additional geothermal prospects and the natural conditions, the map does show that the areas in the Rift Valley contain a mix of fault lines, geothermal areas, lakes and quaternary volcanoes. Regarding the importance of other essential features such as hydrology, the presence of lakes within the lower and the upper portions of the map remains indispensable and does stand out. With volcanic sites and other geologic features like fault lines and lakes dispersed from the South near Lake. Magadi in notable magnitudes. The visible presence of naturally occurring fault lines and geothermal sites along Suswa and Longonot, Naivasha and Nakuru once again reaffirm additional potentials nearby made up of lakes, volcanic zones and fault lines at Eburru and Menengai. Similar geologic features stretch from the North to the Western portion of the map at Lake Bogoria towards the upper North from Korosi to the Barrier axis near Turkana. Having seen that, it comes as no surprise that much of the areas essential for new and ongoing prospects and exploration of new sites run through the rift valley area beginning from the Lake corridors to the Lower South of Kenya to Namarunu (Figure 9).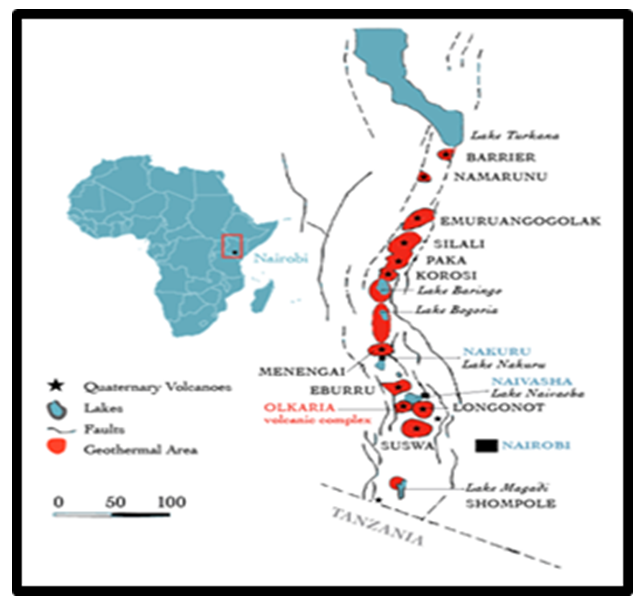 | Figure 9. Geothermal Treasures on Volcanic Paths, Source: GDC |
In terms of the actual individual geothermal facilities and engines driving the sudden economic resurgence of Kenya, look no further than the Olakaria class of sites and their operating well heads too. On the West Central portion of the country, note the presence of facilities within the energy triangle alongside other renewable sources from hydro power to wind. While these sites are in the area, they remain integral part of Kenya’s geothermal energy evolution from 1981-1985 and 2003 and beyond during which Olkaria I-Olkaria II were commissioned with estimated power volume of 45 MW-70 MW. This was followed by the drilling of wells in Olkaria IV in 1999 -2006 as at 2007 to date. During the same period, production and drilling was commissioned in Olkaria 1 and IV in which 60 wells were drilled with over 400 MW capped (Figure 10).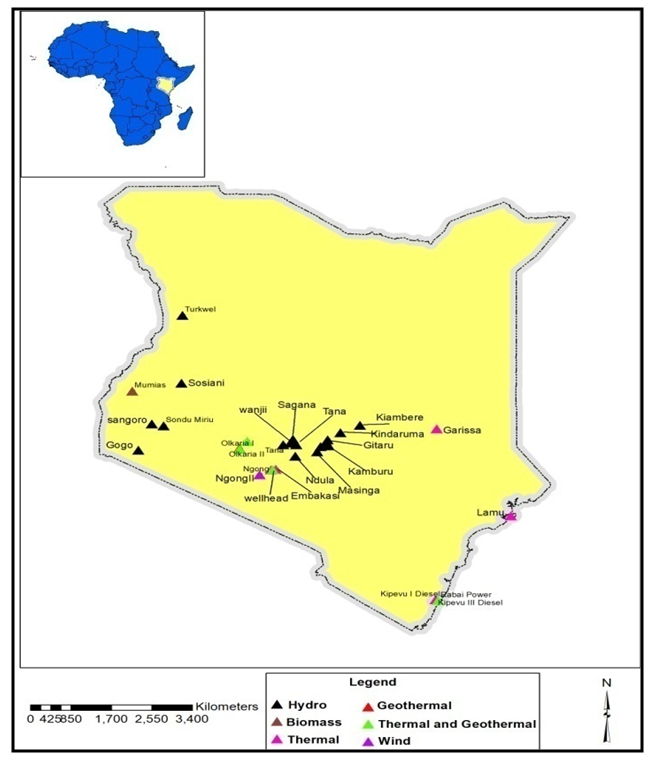 | Figure 10. The Individual Geothermal Facilities and Other Sources |
3.4. Factors Driving the Emergence of Geothermal Energy and Efforts
This section of the paper describes factors and current initiatives driving the sector. In terms of the factors, the emergence of Kenya as the new frontier of geothermal energy in lieu of the dismal state of conventional sources over the years did not occur in isolation. Clearly stated, it is linked to several factors listed below under policy, economic components of rising production and slumping energy price, environmental and physical elements and the preference for geothermal power over hydro. These factors are described in detail in the following paragraphs.
3.4.1. Enactment of National Policy
Being a country fully endowed with geothermal resources mainly located in the Rift Valley with exploitation dating back to the 1950s. The enactment of the nation’s regulations has been quite crucial in providing an enabling environment for geothermal explorations in Kenya. Building from the provisions of government policy in promoting the development of the sector, in 2015, around 20 MW of new power capacity were installed, reaching a total of 600 MW. Because it is estimated conservatively that the Kenya Rift has a potential of greater than 2000 MW of geothermal Power and the fact that Olkaria geothermal field is the largest producing site with total installed capacity in 2014 of 573 MWe from 5 power plants. The proposed 140 MW Akira power plant is expected to be constructed in two phases, with the first 70 MW completed by December 2018. The project is the first private sector Greenfield geothermal development through power purchase agreement (PPP) in Sub-Saharan Africa. Other instances of the role of policy in augmenting geothermal energy sector stems from the government’ ambitious plans to sustain the sector through additional load generation over time. For that, in Kenya's Least Cost Power Development Plan, geothermal power has been identified as a cost-effective power option, and the GDC was set up to fast track the exploitation of Kenya's vast resources in the respective sites. As part of the policy implementation activities, the explorations for geothermal energy in the Rift Valley are now ongoing as stipulated by existing government policy [46].
3.4.2. Rising Production and Falling Energy Price
Government officials have in recent years in Kenya renewed their interest in geothermal energy to reduce the use of expensive electricity from diesel generators and to boost the country's competitiveness and efficiency. Thus, Kenya’s rapid investment in geothermal power in recent years is increasingly paying dividends through the supply of reliable, clean energy and by lowering the cost of electricity to consumers. To further boost production, Kenya added 280 MW of geothermal power generation capacity in June 2013, bringing the total installed power generation capacity of the country from 1,765 MW to 2,327 MW as of December 2016. Drawing from the latest advances in technology and the development in new power plants, geothermal power production has been on the rise since June 2014 in Kenya. While production surged over time repeatedly, Kenya’s government has recently stepped up geothermal development in new fields, including Menengai, run by the GDC. As a result of the government’s investment in geothermal energy, since August 2014, the cost of power to industrial and domestic consumers fell by over 30% [30]. With the rise in the production of both hydro and geothermal power, the difficult periods for consumers now appear to be a thing of the past with the dwindling prices. In September of 2014, homes that once used up 200 kWh spent $36. This represents a drop from $39 in the earlier month [33]. For more on the benefits of geothermal in the flower industry, see the Appendix.
3.4.3. Geology, Physical and Environmental Elements
At a time in which Kenyans are saddled by lethargic power supply through hydro that relies on imported fuel, boosting electricity through alternative sources stands as a key priority for the government. The authorities are aiming at doubling production in 2020, by taking advantage of countless opportunities offered by the presence of massive geothermal assets as characterized by local geology and physical environment of the Rift Valley to meet the intended targets. The Great Rift Valley, a 6,000km terrain stretching through the Eastern Africa zone of Kenya contains vast geothermal reserves at the centre of the nation’s new energy frontier and economic resurgence [20]. At an estimated potential of thousands of MW in multiple sites, geothermal resources in Kenya comes from the Rift Valley’s underground hotspot, harbouring hot water sources and steam at very elevated temperature piped up to the surface from depths of thousands of meters. From such attributes, Africa’s Great Rift Valley better known for its picturesque mountains, escarpments and lakes has become the new source of optimism expected to enable Kenya to meet its energy needs well into the 21st century. Thus, in recent years the geothermal energy potential on the valley floor has triggered influx of major investors poised to tap into an energy treasure that is plentiful, local, renewable and mainly environmentally benign.
3.4.4. Preference for Geothermal Power over Hydro
For many years, Kenya has relied on its hydroelectric network, which last year produced 820 MW. But recurring droughts have rendered this source of energy much less reliable than before with growing preference for geothermal power. Considering the significance of hydro power as a renewable energy with benefits in the development of the country, it remains a very cheap source of power often impacted by drought which sometimes hinders regular assess and security for communities. For that, in the past years when the country had very bad drought resulting in the declining level of major reservoirs, energy policy of the government of Kenya shifted towards the development of geothermal infrastructure in other to turn the development aspirations of the country around. From the frequent outages associated with the supply of energy in a country with teeming population, the reductions in the amount of electricity power generation often occur in a manner different from geothermal power. Given the growing presence, so long as there are wells and production capacity, geothermal plants operate round the clock as very dependable source of power. In that setting, the proliferation of geothermal energy will move forward, while hydropower fizzles out. Going by that premise, it comes as no surprise that the frequency of geothermal installations and capacity loads generated on numerous sites over the years have greatly outpaced hydro power [46].
3.5. Efforts in Kenya
The involvement of international organizations and agencies in the development of geothermal energy infrastructure in Kenya over the years remains instrumental in the growth of the sector. Much of the current efforts include the launch of the US$67million East African Geothermal Risk Mitigation Facility. As a partnership between the African Union Commission and the German development agency KfW, it was intended to offer matching grants towards exploration and to help minimize several of the potential exploration hazards. At the same time, governments and international donors alike have demonstrated a renewed interest in promoting the development of Africa’s clean and renewable geothermal energy resources. In 2012 alone, the US Agency for International Development (USAID) and the Geothermal Energy Association (GEA) launched a new international energy partnership to help bring US geothermal industry expertise and companies into the rapidly expanding East African geothermal markets including those in Kenya.In keeping with the government’s commitment to energy security in the nation, note that during its budget for the fiscal year 2018/2019, the Kenyan Government did set development targets for geothermal power, expecting up to 200-250 MW to come online with additional wells drilled at Bogoria, Silali and Olkaria. Under the published budget of the country, for 2018/2019, the Government of Kenya also shared details on the financial expenditure devoted to geothermal energy development [24, 29]. To the effect, the country has partnered with a local university in creating the African Geothermal Centre of Excellence (AGCE) offering post-graduate training to students across the continent. The Institute offers courses on geothermal technology, including drilling engineering, geosciences, reservoir engineering, environmental management, steam-field management, project management and power-plant engineering. With all courses aimed at building capacity for geothermal development in Africa. The Geothermal Development Company (GDC) will also be tasked to develop new concepts and improve its facilities in geothermal technology in Africa. The training is being implemented with support from the African Union and United Nations Environmental Programme (UNEP) through the GDC and KenGen under the auspices of the Ministry of Energy. As part of the program, a total of 22 students from 11 African countries were trained on various aspects of geothermal development [19].
4. Discussion
From the analysis herein, the study showed a growing frequency in geothermal power indices in terms of generated capacity, market capacity, rankings, production and installed facilities as well as some variations in averages, totals, and changes in growth rates among various indicators over the years. This is driven chiefly by socio-economic and ecological benefits that come with geothermal use and production in the energy sector of Kenya. While mix scale models of descriptive statistics and GIS were on target in the analysis as carried out on the use of geothermal energy in the country. The study area saw the emergence of observable spatial patterns in sync with present usage, sites location and production. In as much as the GIS mapping displayed precise clusters and dispersal forms of the individual geothermal energy indicators made up of assets, elevation values, infrastructure and facilities over time among the selected points in space. The emerging geographic patterns which remained steady in some areas and only to change at times provided a road map and snapshots on activities of the industry in terms of production, ranking, investment, energy consumed and geothermal power facilities in the Rift Valley region, its vicinity and other areas in East Africa. With over 50% of the East African total geothermal energy reserves located in the study area, the nation’s power capacity surpasses those in neighboring countries in the region by a much higher margin in every category from the percentage levels and quantity. This is very important seeing the pertinent roles of geothermal energy in the domains of business and economy, employment generation, global horticultural export, urban and city quality of life, affordable electricity power supply, and CO2 emission abatement. This inference is noteworthy in the face of increasing costs of fossil fuel and lethargic power supply and fading pace of hydro power due to irregular precipitation and the threats of drought and rising potentials of geothermal power throughout the country in the last several decades.Furthermore, geothermal assets and infrastructure in the country not only showed some consistency in the Rift Valley, but there exists clusters of populated areas and geothermal sources along sites from Lake Magadi in the South West and to other zones within the vicinity of natural areas. Further on the Lower Southwest appears another group of areas within the vicinity of geothermal energy sites germane to the daily supply of energy. Turning to market distribution among producers, Kenya remained firmly active on the global ranking at 4.3% of the overall share of geothermal energy trade. The fact that all these involved capacity building, joint ventures and the enactment of government policy in creating an enabling environment to grow the sector through falling tariffs in electricity bills for consumers, businesses and industry. It did add to the continual development of new facilities in the country. Considering that dozens of areas endowed with the resource are now within the vicinity of facilities involved in production and geothermal energy resurgence made possible by local planning and the activities of institutions. The environmental benefits of geothermal energy in the study area as captured in the Appendix are plentiful. To ensure continual surge in geothermal output in the country, the study proffered remedies that are summarized in the concluding part of the paper.
5. Conclusions
This study examined the present state of geothermal power use in Kenya with revealing findings under the following rubric. a) Geothermal energy in abundance; b) fully entrenched as alternative source; c) rising potentials in the sector; d) mix-scale model very effective; e) the surge in geothermal energy predicated on several factors.From the analysis, Kenya boosts of substantial reserves of geothermal energy resources from a network of rugged geologic fault lines and volcanic sites dispersed across the Great Rift Valley vast reserves estimated at thousands of MWs in more than half a dozen locations with economic benefits and minimal impacts on the ecology. This comes at a period in which the nation’s sub terrain in the Rift Valley geothermal hotspot and reservoirs store blistering water sources and steam at elevated temperatures. Of great significance in all these is the increases in geothermal power output and its emergence as the second largest source of renewables sustained by robust infrastructure across the country. For that, of the total volume in geothermal potential in 2016, in the East African region, Kenya accounted for over 50% of the assets more than its neighbors from Tanzania to Djibouti. The assembling of such info on energy index in this enquiry is very essential in natural resources and development area where regular speculation on tradable items serves the needs of market chieftains in key monetary centers of the world. In that case, the study stands out on its merits as a vital tool for both decision makers, resource managers and planners in the renewable energy sector. As specified, the firm rise of the geothermal power sector in the last several years in the Rift Valley region of Kenya attests to its numerus advantages. Aside from the slow usage of geothermal power in Kenya previously, now it has emerged as a fully entrenched alternative source of energy with growing use throughout the country. The existing information on geothermal power production potential in 2013 not only showed growing dependence on geothermal energy in electricity generation, but it has a high availability factor of over 95% with no negative effects on the ecosystem. The belief is that geothermal power now has a notable effect on a nation which for years relied on costly fossil fuel generators to make up for the sluggish power output and shortfall. Thus, geothermal power stands as a more dependable and sustainable energy option in contrast to other conventional sources in Kenya. This is occurring at a time in which hydro-electricity previously a mainstay of the Kenyan power grid, has faded due to irregular rain fall patterns where only 16% of the citizens have electricity. Added to that, Kenya presently has the geothermal potential to address its energy crisis considering the surge in production, capacity generation and new installations and its emergence as the second largest source of renewable power. The ability of this enquiry in outlining the emergent role of geothermal power as dependable alternative, offers a better frame of reference for decision makers focused on showcasing the sector in the development aspirations of the nation.Drawing on the nation’s growing interest on geothermal power and the vast web of new plants that came on line since 2014 through innovative technology to boost competitiveness and efficiency. The geothermal output for electricity in Kenya from 2015 to 2010 grew to higher levels. Regarding the top 10 countries globally in geothermal sources of electricity, Kenya listed 10th in the ranking, accounted for 9.98% of world total. In 2010 alone, Kenya’s electricity output through geothermal power soared at a rate of 2.37%. Regarding the distribution patterns of geothermal installations over the years, the power load suggests notable surge in the first three periods from 2007 through 2009. The uptick in geothermal output and its emergence as the second largest source of renewables together with infrastructure proliferations has catapulted Kenya as the biggest producer of geothermal energy in Africa with an overall global ranking of 8th with 5% of the output. In all these and as expected, the country remains poised to adding more geothermal-sourced power to its grid in the next few years. Such a template could be useful to its neighbours scrambling to harness the resource. Furthermore, the applications of mix scale methods as analytical tool were quite effective and on target. Integrating descriptive statistics and GIS mapping under the model as working devices injected new ideas to the analysis on the state of geothermal energy usage and production. The framework was quite efficient in delineating the study area and categorizing the patterns. This approach is quite vital to researchers and managers charged with the task of undertaking the geo-spatial assessment of the emerging trends in geothermal energy research in Kenya. Moreover, the spatial mapping involving GIS analysis reveals a noticeable presence and spreading of geothermal sources in areas around the Rift Valley zone geologic fault lines where human settlements, production and the emergence of new sites has been increasing. Accordingly, GIS mapping as a planning device remained quite valuable in highlighting the concentration of geothermal power indices, the pace of their diffusion and the evolution across space. This benefit exemplifies a major step to sound planning in present policy which has not fully grasped these potentials in the East African region. From the study, Kenya exhibited noticeable patterns consistent with diffusion of geothermal energy trends from 2000 to 2017. Consequently, the model provides opportunity for highlighting the potentials and state of sector with novel techniques often overlooked in policy making. Thus, the practical applications of mix scale model involving GIS analytics along with geothermal energy index as a tool, advances current knowledge.Additionally, economic and physical factors situated within the larger geothermal energy industry are crucial in assessing the evolution of the state of sector over the years in Kenya given their role in fuelling the resurgence in production and effects in the country. This not only echoed the essence of socio-economic and environmental elements in the nations geothermal power operations, but also it shows the level to which policy drives the proliferation in geothermal activities and how the sector sustains the economy and quality of life among citizens in built up areas. In all these, the geology of the rift valley and the presence of its sub-terrain hot rocks and the catalytic role of geothermal power in the horticultural export market, employment creation, and the population growth rate and rising demand for reliable power supply appears to have spurred the current surge in the sector. As a nation rich in geothermal resources, the promulgation of effective policies was instrumental in creating a supportive atmosphere for geothermal explorations and its affordability as an alternative power source. On the economic front, knowing that the Rift valley axis stands as a geothermal hotspot driving economic revival and energy security in the country. The pressure from population growth rate of 2.68% from 2000 to 2018 on energy consumption amidst fluctuating supply over the years created a craving for energy access and security built on geothermal power. Having seen all the elements and linkages to the surge, the study ushered in a pathway for tracing and understanding their significance amidst rising output. Managers in that setting are provided ample chances to gauge their attributes and significance in energy security over time. Considering the increasing energy needs of Kenya and the prospects of geothermal energy in the East African region specifically, and the challenges associated with dependence on hydro power and fossil fuel and what came out from this enquiry. Policy makers and managers in the country will be required in foreseeable future to search for immediate answers to several relevant queries germane to the future of geothermal energy planning. The questions encompass what other future ecological and economic benefits are expected from geothermal power use in Kenya? How would these benefits be evaluated? What form will the spatial evolution of geothermal energy use and production follow in the country? What new elements will shape the proliferation of geothermal energy? What role will regional and multilateral partnerships assume in the process? Seeing the framing of these questions, there are plenty opportunities from all these for researchers and decision makers charged with exploration of new sites and facility design to refocus the strategy on geothermal power with policies emphasizing sustainable use, production and low carbon foot print in the planning arena. This will ensure that the sector sticks to sustainable renewable energy and green practices consistent with good results and ecosystem quality and energy security in the coming decades. To grow the sector further, the paper suggests the need for education and enlightenment campaign on geothermal power for the general public and decision makers, more use of spatial analysis, regional energy infrastructure and the design of a regional geothermal energy information system and Atlas.
Appendix A
3.4.1. The Benefits of Geothermal Energy in Kenya The benefits come in the way geothermal steam warms greenhouses with electricity generated at two power plants operated by Kenya’s Oserian firm. Therein, geothermal heating system enables the company to sell hundreds of millions of flowers stems each year and grow varieties of roses that would not have been economically possible in the absence of daily heating. Aside from having used cheaper power from its own geothermal power plant for its operations close to the Olkaria geothermal field in Kenya in the past few years. Oserian uses geothermal power for growing flowers coupled with the heating of its greenhouses at night. Another unique feature is that the company taps carbon emissions from the geothermal steam and circulates it through pipelines to the greenhouses since plants need CO2 for photosynthesis. This resulted in 10% growth rate in output in the process. In the same period, Oserian company also utilized the steam to disinfect and remove fungus from the water piped to the plants in a way that discards the need for fungicides. In as much as savings using geothermal energy as opposed to conventional electricity allows Oserian to offer attractive salaries to its employees, another geothermal facility nearby has the capacity to serve 800,000 customers. Given the benefits, the company is planning to increase its geothermal power generation capacity by marketing its surplus electricity power to the national grid.
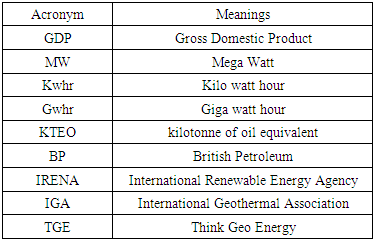
Acronym
References
| [1] | Waruru, M. (2016 June). Kenya On Track to More Than Double Geothermal Power Production. Renewable Energy World. Retrieved May 5th 2018 From https://0x9.me/xWUel. |
| [2] | Energy Regulatory Commission (ERC). (2012). Geothermal Resources, Renewable Energy Portal. Nairobi, Kenya: ERC |
| [3] | Kenya Ministry of Energy (2018). Geothermal. Nairobi, Kenya. Retrieved May 5th 2018 From http://energy.go.ke/geothermal/. |
| [4] | Hassan, D. (2016). Geothermal Energy Helps Power Kenya's Future. Lyon, France: Euronews. |
| [5] | Yee, A. (2018 February). Keynan Flower Company Utilizing Geothermal Power and Heat. New York Times. |
| [6] | Belaud, C. (2016 March). Hot Rocks: Kenya Taps Geothermal Heat to Boost Power. Agence France Presse. |
| [7] | Merem, E. C. (2019). Assessing Geothermal Energy Potentials in the Western Region of the US with GIS. Proceedings of 27th Annual AEHS Conference, San Diego: California. March 2019. |
| [8] | Simiyu, S. (2010). Status of Geothermal Exploration in Kenya and Future Plans for Its Development. Proceedings of World Geothermal Congress, Bali: Indonesia. April 2010. |
| [9] | Barnes, R. (2015 July). Africa Geothermal Energy Report. Construction Review Online. |
| [10] | Proctor, D. (2018 April). Geothermal Generation Growing by Leaps and Bounds in Kenya. Power Magazine. |
| [11] | African Development Bank (AfDB). 2019. Expanding geothermal development in Kenya: A Model for Replication. Abidjan, Ivory Coast: AfDB. |
| [12] | Rothic, A. (2016). Kengen Geothermal Development Status and Future Expansion Plants. Proceedings of the 6th African Rift Geothermal Conference. Addis Ababa: Ethiopia. November 2016. |
| [13] | Bungane, B. (2016 June). Kenya’s Geothermal Energy Status Ranks High. ESI Africa, 1-2. |
| [14] | Energypedia. (2018). Kenya’s Energy Situation; Geothermal Energy. Eschborn, Germany: Energypedia. |
| [15] | Kagiri, D. (2014). Proceedings of Power Africa Geothermal Road Show. Dallo: Ethiopia. September 2014. |
| [16] | Don, R. (1994 September). The Geothermal Fields of The Kenya Rift Valley. Tectonophysics. 236: 1–4:117-130. |
| [17] | Trabish, H. (2010 August). Kenya Geothermal Kenya on the Cusp of a Geothermal Boom. New Energy News. |
| [18] | Njoroge, E. (2012 October). Geothermal Development in Kenya. In Proceedings of Geothermal Resources Council (GRC) Annual Meeting. Reno: Nevada. October 2012. |
| [19] | Geothermal Development Company Kenya (GDC). (2018 April-June). Geothermal Energy Will Boost Food Security/GDC to Improve Training. Nairobi, Kenya: GDC. |
| [20] | Africa News. (2016 March). Kenya Joins World Leaders In Geothermal Energy Production. |
| [21] | Logan, A. (2018). Kenya’s Geothermal Energy Revolution. Seattle, Washington: Borgen Project. |
| [22] | African Review. (2016 October). UK Commits to Kenya Renewable Energy Drive. |
| [23] | World Bank. (2015 February). Kenya’s Geothermal Investment. Washington, DC: World Bank Group. |
| [24] | Richter, A. (2018 June a). Kenya Geothermal Development Targets As Laid Out by 2018/19 Government Budget. Think Geoenergy. |
| [25] | Oyango, L. (2018 June a). Kenya Tops Africa, Ninth Globally In Geothermal Rankings. Business Daily Africa. |
| [26] | Mihai. A. (2014 October). Kenya Opens World’s Largest Single Turbine Geothermal Plant. Zmescience. |
| [27] | Mbogo, M. (2018 June). Kenya Tops Africa and Ninth Globally In Geothermal Rankings. Construction Review Online |
| [28] | Oyango, L. (2018 June b). Kenya Tops Africa, Ninth Globally In Geothermal Rankings. All Africa. |
| [29] | Richter, A. (2018 June b). Kenyan Government Allocates $125 million For Geothermal Exploration 2018/19. Think Geoenergy. |
| [30] | Mutei, E. (2015 April). Kenya's Exploits In Geothermal Energy. Clean Leap. |
| [31] | Fridleifsson, B. (2013 October). Geothermal Energy in Developing Countries and the MDGs. Tokyo, Japan: United Nations University. |
| [32] | Mariita, N. (2015). Status and Challenges in Training on Geothermal Energy in Africa. Proceedings of World Geothermal Congress, Melbourne: Australia, April 2015. |
| [33] | Richter, A. (2018 October c). Geothermal Energy Becoming Predominant Source of Electricity in Kenya. ThinkGeoEenergy. |
| [34] | United States Agency for International Development (USAID). (2013 October). Greenhouses Pre-feasibility Study. Washington, DC. USAID. |
| [35] | Floral Daily. (2019). Geothermal Energy Grows in Kenya. |
| [36] | Richter, A. (2012 December). Kenyan Flower Company Utilizing Geothermal Power and Heat. ThinkGeoEnergy. |
| [37] | Lagat, J. (2010 April). Direct Utilization of Geothermal Resources in Kenya. Proceedings of World Geothermal Congress, Bali: Indonesia. April 2010. |
| [38] | Kisero, J. (2010 November). Kenya: Nation On the Cusp of a Geothermal Energy Boom. The East African. |
| [39] | Kobina, A. (2010 November). Kenya on the Cusp of Geothermal Energy Boom. The East African. |
| [40] | Guest Contributor. (2011 December). Kenya Looking For a Geothermal Boom. Sustainable Enterprises Media, Inc. |
| [41] | Merem, E. C. (2018a). Assessing The Effects of Fuel Based lighting: The Case of Kerosene Use and Disasters In Nigeria. Public Health Research. 8:1: 1-17. |
| [42] | Merem, E. C. (2018b). Assessing Renewable Energy Use In Ghana: The Case of the Electricity Sector. Energy and Power, 8:1: 1-17. |
| [43] | Merem, E. C. (2017a). Regional Assessment of Energy Trends in West Africa Using GIS. International Journal of Energy Engineering. 7: 1:1-27. |
| [44] | Merem, E.C. (2017b). Analyzing Water Management Issues Using GIS: The case of Nigeria. Geosciences. 7: 1: 20-46. |
| [45] | Worldometers. (2018). Population World: Africa Population Sections. |
| [46] | Merem, E.C. (2019). Analyzing Geothermal Energy Use in the East African Region: The Case of Kenya. Proceedings of the 15th International Symposium on the Recent Advances in Environmental Health. Jackson: Mississippi. February 2019. |
| [47] | The Kenya Engineer. (2016 May). Killing a Geothermal Well. 1-3. |
| [48] | World Energy Council. (2018). Geothermal In Kenya. London. UK: World Energy Council. |
| [49] | Anon. (2013). Harnessing Geothermal Energy: The Case of Kenya. UK: Department of International Development. |
| [50] | Mumero, M. (2013 July). Kenya Explores Alternative Uses of Geothermal Power. London, UK: .Alain Charles Publishing. |
| [51] | EU-Africa Union. (2018). Kenya Renewable Energy Potential. The Africa-EU Renewable Energy Cooperation Programme (RECP). |
| [52] | Palmateer, A. (2017). East Africa Geothermal Update: Expanding Capacity Program. Proceedings of Geothermal Organization Annual Meeting. |
| [53] | World Bank. (2018). Kenya. Climate Investment Fund. Washington, DC: World Bank Group. |
| [54] | Power Engineering. (2010 March). Kenya Targets 5000 MW of Geothermal Power by 2030. |
| [55] | Heuwel, S. (2012 October). Kenya Targets 5,000 MW of Geothermal Power by 2030. ESI Africa’s Power Journal. |
| [56] | Mbogo. S. (2012 August). Kenya In Cheaper Geothermal, Option. The East African. |
| [57] | Food and Agriculture Organization of the United Nations (FAO). (2015). Kenya Uses of Geothermal Energy in Food and Agriculture Opportunities for Developing Countries. Rome, Italy: FAO. |
| [58] | Björk, H. (2012 April). Full Steam Ahead to Sustainable Energy Tapping Geothermal Power in Kenya’s Rift Valley. New York, NY: Africa Renewal, United Nations. |
| [59] | Ole, K. (2017). Geothermal Energy and Indigenous Communities: The Olkaria Projects in Kenya. Heinrich Boll Stifung EU. |
| [60] | Mariita, N. (2002). The Socio-Economic and Environmental Impact of Geothermal Energy On The Rural Poor In Kenya. Kenya: the AFREPREN Theme Group. |

 Abstract
 Reference
 Full-Text PDF
 Full-text HTML