Mohamed Mahmoud Ali1, Boudy Bilal2, Nourou Dia3, Issakha Youm4, Mamoudou Ndongo1
1Department of Physics, Faculty of Sciences and Technology, University of Nouakchott Al Aasriya (UNA), Nouakchott, Mauritania
2Department of Electrical Engineering, Ecole Supérieur Polytechnique (ESP), Nouakchott, Mauritania
3Laboratory of Research Applied to Renewable Energy (LRAER), University of Nouakchott Al Aasriya (UNA), Nouakchott, Mauritania
4Center of Studies and Research on Renewable Energies (CERER), University Cheikh anta Diop (UCAD), Dakar, Senegal
Correspondence to: Mohamed Mahmoud Ali, Department of Physics, Faculty of Sciences and Technology, University of Nouakchott Al Aasriya (UNA), Nouakchott, Mauritania.
| Email: |  |
Copyright © 2018 The Author(s). Published by Scientific & Academic Publishing.
This work is licensed under the Creative Commons Attribution International License (CC BY).
http://creativecommons.org/licenses/by/4.0/

Abstract
The aim of this study is to analyze the biogas production by fermentation of Slaughterhouse Waste and Organic waste. Data used are collected through three experiments at ambient temperatures of study site. The method used allows determining the physicochemical characteristics of substrates and the composition of the biogas produced. In addition, a comparative study of six kinetics models of cumulative methane production was carried out. Physicochemical characteristics of the substrates showed that the substrates, which have high content of volatile solids, showed almost no methane production potential, contrariwise the substrates, which have a volatile solids content of about 50%, showed significantly high methane production potential. Cow rumen fluid (CRF) and cow manure (CM) are the only ones that showed significant methane production potential at ambient conditions compared with other substrates. Sheep manure (SM) and Salvinia molesta (SAM) showed the longest delay phase, implying that they are not easily degradable. The digestion temperature has the same profile as the ambient temperature whatever the substrate. Also, the obtained pH range (6.1 - 7.2) is within the desirable operating range. All models has attained significant prediction of the methane potential. The best rRMSE (0.076 and 0.162) and R2 (0.998 and 0.991) were observed for Logistic and Gompertz models, respectively. Hashimoto's model presented the best estimation of kinetic parameters.
Keywords:
Anaerobic Digestion (AD), Methane production potential, Kinetic models, Ambient temperature, Slaughterhouse waste, Salvinia molesta
Cite this paper: Mohamed Mahmoud Ali, Boudy Bilal, Nourou Dia, Issakha Youm, Mamoudou Ndongo, Modeling the Kinetics of Methane Production from Slaughterhouse Waste and Salvinia Molesta: Batch Digester Operating at Ambient Temperature, Energy and Power, Vol. 8 No. 3, 2018, pp. 61-70. doi: 10.5923/j.ep.20180803.01.
1. Introduction
Biogas is a renewable energy produced naturally during the anaerobic degradation of fermentable materials. It can contribute to the sustainable development of both developing and developed countries in the fields of energy, hygiene and the environment [1]. The degradation of organic matter takes place under the action of microorganisms in a process that generally takes place in four biochemical phases (hydrolysis, acidogenesis, acetogenesis and methanogenesis) [2]. The optimization of the various operating parameters of anaerobic digestion (AD) has been the subject of studies in the literature [3-10]. Hajji et al. studied the effect of agitation on AD of household waste in mesophilic condition. The results showed a considerable decrease in biogas production by 62% without agitation compared to continuous or intermittent agitation systems, which is mainly due to the formation of a crust at the surface preventing good degassing [3]. Other experiments with different agitation intensities demonstrated that agitation at low rotational speeds, in the intermittent mode, allows better biogas production. Cathryn et al. investigated using AD of harvested aquatic weeds: water hyacinth (Eichhornia crassipes), cabomba (Cabomba Caroliniana) and salvinia (Salvinia molesta) [4]. Also the pilot-scale digestions allowed to conclud that both water hyacinth and cabomba are presented the highest methane production potential. Contrariwise, Salvinia are presented the weakest methane production potential, because the plant is less readily degradable than the other two. Kheiredine et al. studied the effect of initial pH on methane production from wastewater under thermophilic condition. The result showed that the volumes of biogas produced were 163 mL, 1000 mL, 2000 mL and 1500 mL for pH 4, 5.5, 7 and 9.5, respectively. However, the percentages of methane in the reactors tested are 58.3%, 54.5%, 50.7% and 45.4% for pH 7, 9.5, 5.5 and 4 respectively [5]. They conclude that with a neutral pH the degradation of dairy waste in anaerobic is optimal. Pramod et al. studied the influence of low (25°C), mesophilic (37°C) and thermophilic (52.5°C) temperatures on dairy manure biogas production [6]. Results showed that biogas production under thermophilic conditions could be higher than biogas production at mesophilic and low temperature conditions. During thermophilic digestion, the emergence of biogas was much faster compared to other temperatures and the methane content was also higher at the thermophilic conditions. Mahmoud et al. studied the influence of pasteurization of cattle manure on the production of biogas from slaughterhouse waste mixed in two proportions of pasteurized manure, the highest biogas production rate (2.9 mL/gVS/day) is obtained without pasteurization with a content of 87.4% of methane [7]. Xumeng et al. carried out a comparative study of solid-state to liquid AD of lignocellulosic feedstocks for biogas production, the liquid AD is generally operated at total solids concentration (TS) content of less than 15%, while solid AD is usually operated at TS higher than 15% [8]. Their results shows that liquid AD had higher biogas production than solid AD, while solid AD reaches 5 times more volumetric methane productivity than liquid AD. Maamri et al. evaluated the effect of total solids (TS) concentration on the amount of biogas produced using cow dung inoculum with different total solids (TS) concentrations in a batch digester in thermophilic temperatures (55°C) during a retention period of 15 days [9]. The results have shown that the yield of biogas production increases with the concentration of TS. Manjula et al. evaluated the influence of temperature on anaerobic co-digestion of sawdust mixed with cow dung, in a ratio of 1:3 with water, the experiment is carried out at three temperatures (35°C, 45°C and 55°C), with a retention time of 50 days, without agitation or continuous feeding [10]. The results showed that a high temperature helps to improve AD and thus increases the yield of biogas production. The best biogas production (37.57 mL/mg) is obtained with a temperature of 55°C. Then a modeling study revealed that logistic and Gompertz models showed a better correlation of the cumulative biogas production for all temperatures.Most Experiments for previous works have been conducted in the laboratory at a controlled temperature. In practice, most domestic digesters are installed outdoors, subjecting them to variations in ambient temperature. This situation has not been the subject of previous studies. This research was conducted to contribute solving the problem of slaughterhouse waste and Salvinia molesta using batch digester operating at ambient temperature. Ÿ In the first part, determine the physicochemical composition of the substrates, for the purpose of studying the effect of volatile solid contents on the methane production quality. Ÿ For the second part, analyze the influence of ambient temperature, digestion temperature, digestion pH and biogas compositions (CH4, O2, CO2 and H2S) on the kinetics of methane production. Ÿ Finally, the important data collected during these experiments were used to carried out a comparative analysis of six models (Logistic, Gompertz, Richards, First order, Transference, Hashimoto) of cumulative methane production.
2. Materials and Methods
2.1. Substrates Used
The population migration from villages to the urban areas, due to the drought, is increasing, which increases the number of slaughterhouses and their production to cover the demand for meat. Slaughterhouse waste has been a major problem threatening water environment, the recycling of its waste becomes necessary in order to reduce pollutants and pathogens [11]. The Senegal River, which extends the length of the long border between Mauritania and Senegal, is almost covered by undesireable plants (Salvinia and Tipha). These plants prevented transport between the two banks and are also a threat to agricultural crops. There for, two categories of substrates were used in this study (Figure 1):Ÿ Slaughterhouse wasteŸ Organic waste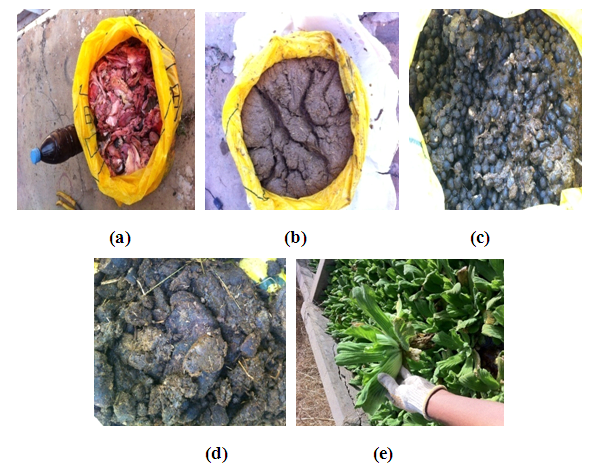 | Figure 1. Substrates used: (a) Meat, Fat and Blood (MFB), (b) Cow Rumen Fluid (CRF), (c) Sheep Manure (SM), (d) Cow Manure (CM), (e) Salvinia Molesta (SAM) |
Slaughterhouse waste consists of meat, fats and blood (MFB), cow manure (CM), sheep manure (SM) and cow rumen fluid (CRF), those wastes were obtained from slaughterhouse in Dakar City. The organic waste consisting of Salvinia molesta (SAM) collected in the garden of the Center of Studies and Research on Renewable Energy (CERER).
2.2. Bio-Digesters Set-up
Figure 2 shows the experimental setup used in the study, the fermentation conditions were established using a batch glass digester of 20 L (A). The installation has two digesters simultaneously-operated. The volume of biogas production was measured with Puxin gas flow meter (JBD-2.5SA, Shenzhen Puxin Technology, Guangdong, China) (B). The biogas production was collected in a 60 L rubber bag (C). The biogas compositions and calorific values were determined by Optima 7 biogas analyzer (410076, MRU Instruments, Inc. Humble, Texas, USA) (D). pH meter with a pH electrode PE 03 (PCE-228, PCE Instruments, Strasbourg, France) (E) and Multi-channel portable thermometer with four thermocouples (PCE-T390, PCE Instruments, Strasbourg, France) (F) were used.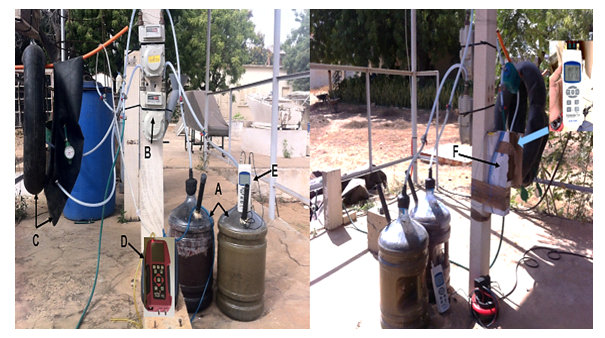 | Figure 2. Experimental apparatus |
Because of biogas contains some hydrogen sulfide (H2S) gas that is toxic, corrosive and has bad smell, we needed to install filter to get rid of H2S from biogas before it will be used, otherwise H2S damages our instruments. PUXIN biogas purifier was used, the main composition of the filter is ferric oxide (Fe2O3) (TLT-B-02, Shenzhen Puxin Technology, Guangdong, China).
2.3. Physicochemical Composition
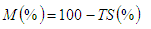
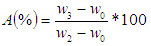
Physicochemical composition for the differences in substrates were conducted to determine the moisture (M), total solids (TS) and volatile solids (VS) contents according to the Standard Methods of the American Public Health Association (APHA 2003) [12]. Total solids were determined by the loss of weight when heating the sample at 105°C for half a day. Eq. (1) was applied to calculated TS. The moisture content (M) of the substrates was determined by Eq. (2), the TS was further ignited in furnace for 6 h at 550°C to determine the Ash (A) by Eq. (3). The volatile solid (VS) was determined based on A by Eq. (4):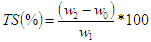 | (1) |
 | (2) |
 | (3) |
 | (4) |
W0: weight of dried empty crucible; W1: weight of sample before heating; W2: weight of sample heated (105°C) and that of crucible;W3: weight of sample ignited (550°C) and that of crucible.
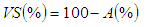
2.4. Approach of Study
Each substrate sample is collected, crushed and dried for 6 hours to remove surface moisture [13]. Table 1 presents the structuring of the experiments as well as the fermentation condition of substrate. Three experiments are carried out: a) the first one uses the digesters D1 (MFB) and D2 (CRF). b) Second experiment uses the digesters D3 (SM) and D4 (CM). c) Last experiment uses the digester D5 (SAM). The digesters are installed in the open air and therefore subject to variations in ambient climate parameters. The digestion temperatures, pH and biogas flow were measured, in two-hour steps from 8 am to 4 pm each day. Biogas production is analyzed daily by determining its composition, pressure and calorific value. The data variations of the ambient temperature are provided, in steps of one hour, by the national meteorological station in Dakar-Senegal.Table 1. Fermentation condition of substrate
 |
| |
|
The inoculum was used only for Salvinia molesta to ensure that a stable methanogenic community was present. It’s been taken from a laboratory-scale, continuous, anaerobic digester that had been treating the cow manure one year. Optimal Substrate/Inoculum ratio of 4.0 was used [4].
2.5. Evaluation of the Performance Model
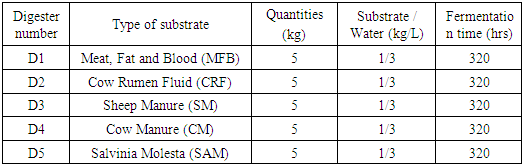
Modeling the kinetics of cumulative methane production was carried out using six (6) growth functions (Logistic, Gompertz, Richards, First order, Transference, Hashimoto) given in Table 2 [2].Table 2. Equation for kinetic models
 |
| |
|
All parameters of the kinetic models (y: cumulative methane production, A: methane production potential, μm: maximum specific rate of methane production, λ: phase delay time, d: curve shape coefficient, k: kinetic parameter dimensionless) were determined using non-linear regressions by IBM SPSS Statistics Software, 2007. Two statistical parameters (relative root mean squared error of prediction (rRMSE), and the coefficient of determination (R2)) were calculated according to Eqs. (3) and (4): [14].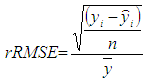 | (3) |
 | (4) |
In Eqs. (3) and (4),  and
and  are the experimental and predicted values, respectively for sample i; n is the number of samples and
  is the mean of the experimental values.
3. Results and Discussion
3.1. Physicochemical Composition
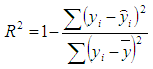
The physicochemical composition of the substrates provides information on the quality of the substrate chosen.Table 3 presents the physicochemical composition of the five substrates studied. SAM showed the highest water content (99.5%). The other three substrates (CM, CRF and SM) have average moisture contents between 96.8 and 97.9%.Table 3. Physicochemical parameters of substrates
 |
| |
|
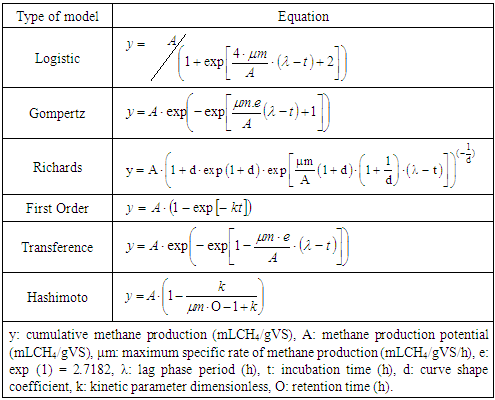
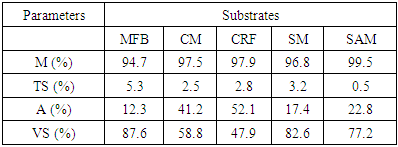
The MFB substrate has the highest volatile solids and low moisture contents (87.6 and 94.7%, respectively) because of its high protein and lipid content. It is followed by SM and SAM substrates with VS between 82.6 and 77.2%. Finally, CM and CRF substrates have the lowest VS contents (58.8 and 47.9%, respectively). It is noted that substrates which have the high content of VS, their potential for methane production is almost zero, because their low speed of degradation, contrariwise the substrates which have a VS of approximately (50%) presented the highest potential of methane production (Figure 3). | Figure 3. Influence of volatile solid content on methane production |
3.2. Analysis of Biogas Production
The variations in biogas production rates for MFB and CRF substrates in experiment 1 are shown in Figure 4. Figure 4 (a) shows very irregular (saw teeth) variations with different amplitudes of variation. The ambient temperature fluctuates around an average value of 29.1°C with a maximum of 36.3°C (66 h) and a minimum of 24.8°C (137 h). The MFB blend has significant production between 18h and 64h with a maximum of 4.56 mL/gVS (37 h). The CRF substrate has a production that fluctuates around a low average (0.24 mL/gVS). Both substrates have similar productions after 64h. For experiment 2 Figure 4 (b) shows that average ambient temperature of the order 28.7°C, is slightly below than that of experiment 1. The SM substrate has a significant production observed between 149-166h, with a maximum value of 0.67 mL/gVS.The CM presents a continuous and very irregular production from beginning to end of experiment 2. The production of CM is more important between 200-250 h with a maximum of 1.19 ml/gVS observed at (241h). The average production rate of CM substrate (0.19 mL/gVS) is greater than that of SM (0.019 mL/gVS). In experiment 3 (Figure 4 (c)), a single substrate was fermented (SAM), the average ambient temperature of 22.7°C, is lower than those of previous experiments (1 and 2). Biogas production is significant only between 28 and 57 h (with two peaks of 0.15 mL/gVS (28 h) and 0.1 mL/gVS (30 h)). Biogas production stopped after 57 h of fermentation. Cathryn et al. noted that SMA has presented phase delay time before the onset of biogas production approximately of 15 d. because it's proved to be less readily degradable [4].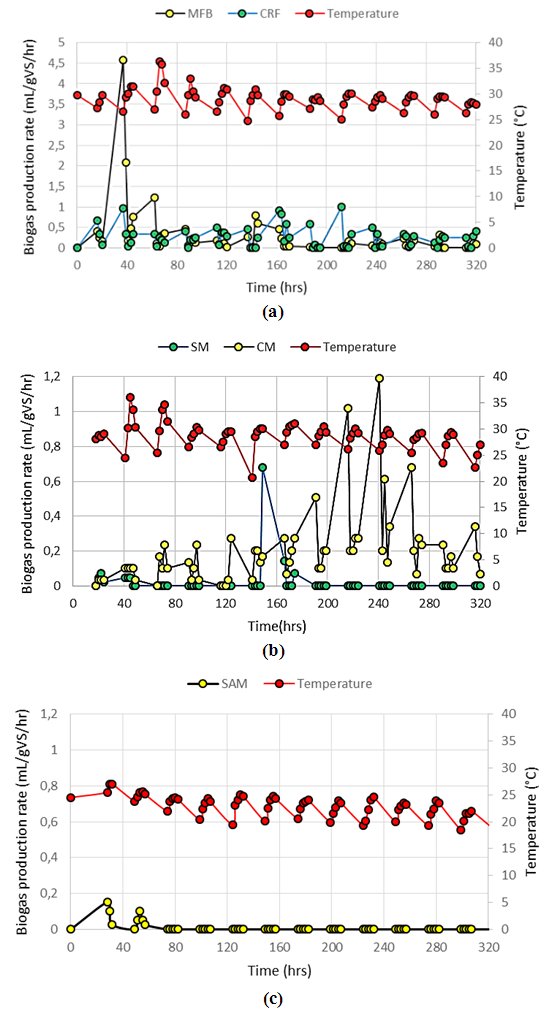 | Figure 4. Biogas production rate as a function of ambient temperature: (a) Exp.1, (b) Exp.2, (c) Exp.3 |
3.3. Analysis of Biogas Composition
Monitoring the composition of biogas evolved (O2%, CO2%, CH4% and H2S ppm) was carried out during each experiment. The results are shown in Figure 5. Comparing the compositions of biogas evolved from MFB (Figure 5 (a)) and CRF (Figure 5 (b)) in Experiment 1, it is observed that a significant production of CH4 for CRF occurred from the third day to fifteenth day (26.5-57.4% respectively), but and a virtually no production of CH4 for MFB during the same period. The virtually zero production of CH4 for MFB is due to high concentrations of H2S and CO2 (2452 ppm and 58.5% average respectively) that inhibit CH4 production. The average concentrations of H2S and CO2 for CRF were significantly lower than those of MFB at 17.1 ppm and 33.1% respectively. With a view to reduce the H2S and CO2 levels in the biogas production of the MFB substrate, an air injection was performed on eighth day. 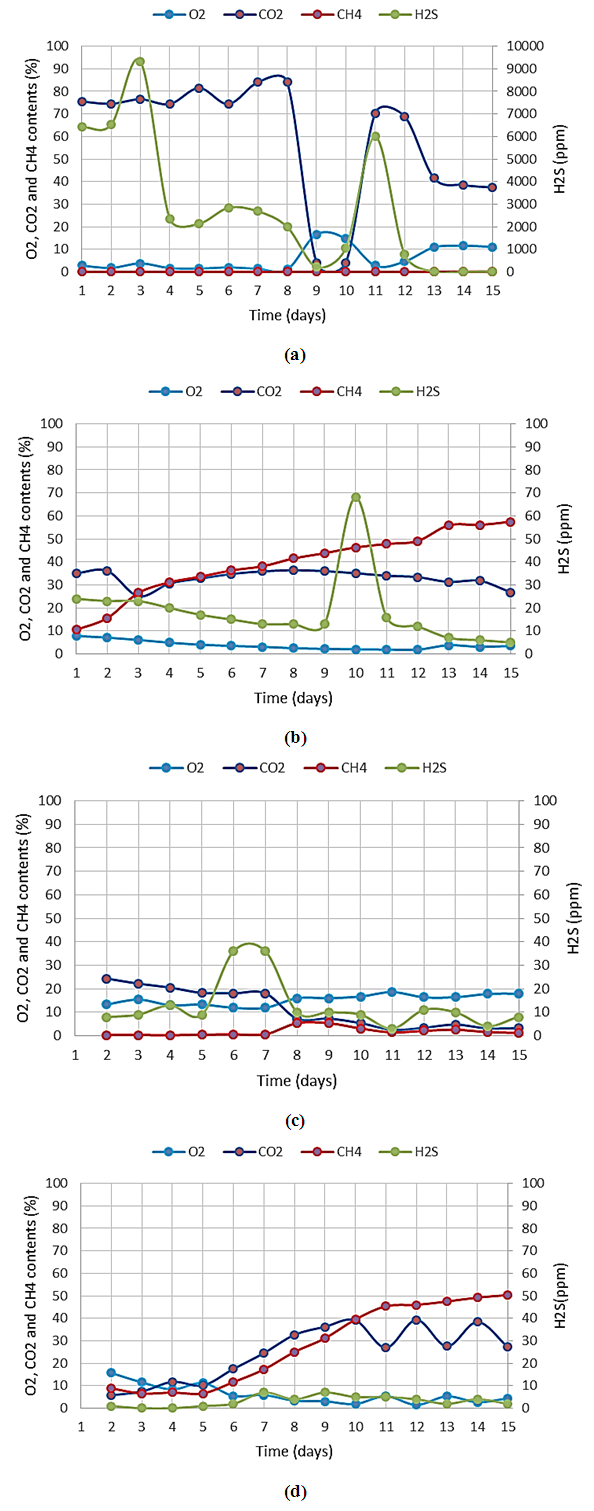 | Figure 5. Curves of evolution of O2, CO2, CH4 and H2S contents: (a) MFB, (b) CRF, (c) SM, (d) CM |
It had the effect in an immediate reduction until ninth day of H2S concentrations (1996 to 214 ppm) and CO2 (84.1 to 4.1%). Both H2S and CO2 concentrations suddenly increased to 6,000 ppm and 70.3%, respectively, on the tenth day. On eleventh day, a biogas purifier was installed for a second test to reduce H2S and CO2 levels in the production of MFB substrate, which resulted in lower H2S levels (6,000 to 13 ppm) and CO2 (70.1 to 41.7%) at thirteenth day with low methane formation (0.14%). The high concentration of H2S generated by MFB co-digestion, was caused by the presence of high protein content [15]. In experiment 2, for SM Figure 5 (c) there is a decrease in H2S (36 to 10 ppm) and CO2 (18.1 to 7.1%) between seventh day until fifteenth day. During this period, there is a slight increase in CH4 from 0.6 to 5.4% that would be due to reduction of CO2. For the CM Figure 5 (d) there observed sharp methane increase of 8.9 to 50.35% with a low presence of H2S (lower to 7 ppm), and a CO2 production that fluctuates around an average 27.3%.
3.4. Calorific Value
Figure 6 shows the histogram of CH4 productions and the calorific value of biogas for the five substrates studied (MFB, CRF, SM, CM, SAM):Ÿ Biogas from MFB has an insignificantly calorific value, on the order of 0.1 MJm-3 because of the very low methane content (0.19%) due to the high content of H2S which remains on average higher than 2000 ppm.Ÿ Biogasses from SM and SAM have very low calorific values of on the order 0.5 and 2.1 MJm-3 due to their low methane contents at 1.23 and 4.89%, respectively (rapid shutdown of biogas production). Ÿ Biogasses from CRF and CM have significantly highcalorific values of 24.4 and 28.8 MJm-3, respectively, because of their high methane contents of 57.49 and 50.35%, respectively.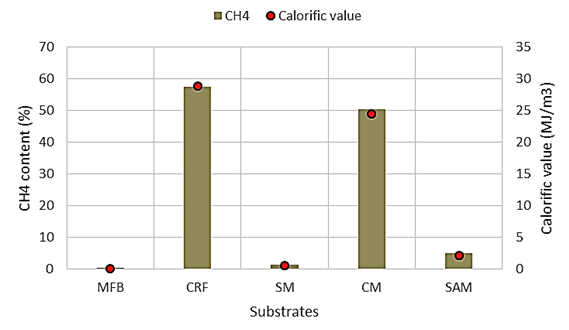 | Figure 6. Calorific value |
3.5. Influence of Temperature and pH Profiles on the Methane Production Rate
Two substrates (CRF and CM) were chosen in this part of study because they have high levels of methane production. Figure 7 shows the temperature (digestion and ambient) and pH variation curves, and their influence on methane production. Figure 7 (a) and Figure 7 (b) show that the digestion temperature has the same profile as the ambient temperature regardless of the substrate, whereas productions of CH4 fluctuates very much. 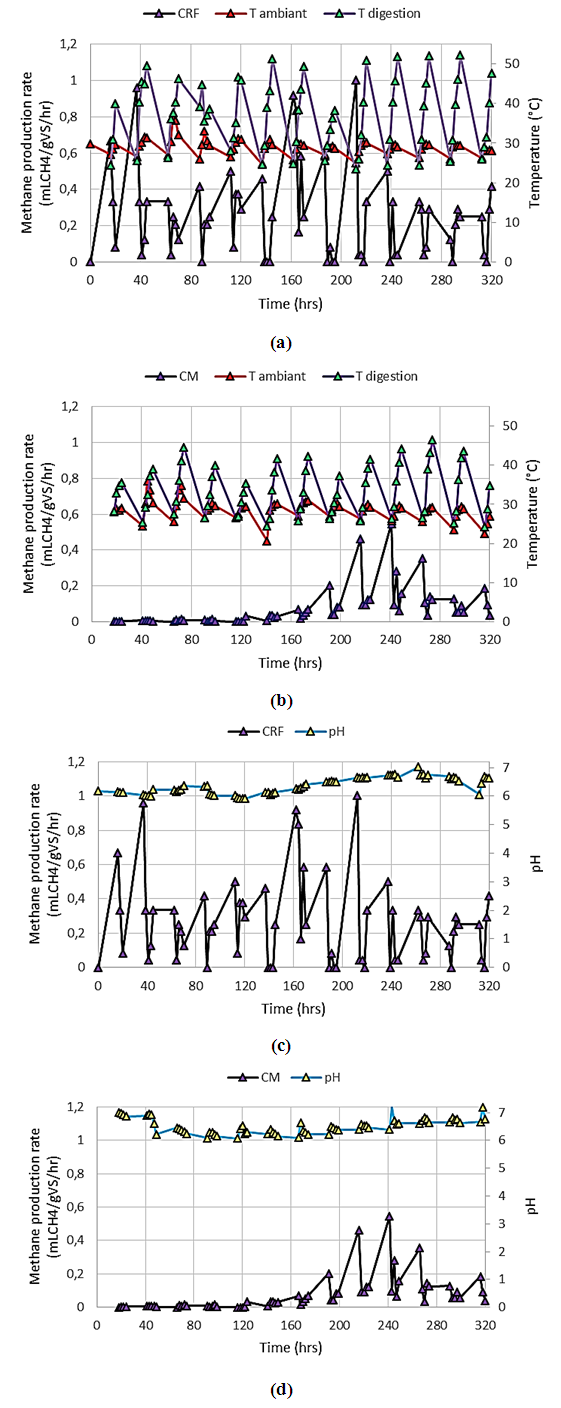 | Figure 7. Methane evolution curves according to operating parameters: (a) and (b) Evolution of methane as a function of digestion temperature and ambient for CRF and CM. (c) and (d) Evolution of methane as a function of digestion pH for CRF and CM |
Figure 7 (a) (CRF) shows an average ambient temperature of 29.11°C with a maximum and minimum temperatures of 36.3°C and 24.8°C, respectively. The digestion temperature varied around the average of (37.1°C) with maximum of 52°C and minimum 23.4°C. The average ambient and digestion temperatures, and the average methane production were 28.6°C, 33.5°C and 0.054 mL CH4/gSV, respectively, as shown in (Figure 7 (b)).Standard deviations of digestion temperature and methane production are 7.4°C and 5.3°C, and 0.07 and 0.05 mL CH4/gSV for CRF and CM, respectively. The small values of SD for methane production indicate that methane production was stable for both substrates. Figures 7 (a) and (b) shows that the evolution of methane for CRF and CM as a function of pH. As shown in Figure 7, methane evolution was not influenced by the pH, which remains in the range 6.1 - 7.2. It is sepculated that pH remained within optical range (between 6.1 and 7.2) due to the low substrate to water ratio of 1:3.
3.6. Modeling the Kinetics of Cumulative Methane Production
The data obtained by CRF and CM substrates were used for modelling, because they have produced an acceptable quantity of methane for validation tests. Table 4 presents the prediction models, the methane production rates measured, the predicted rates, the kinetic parameters estimated as well as the statistical indicators of the cumulative methane production curves of the two substrates studied. 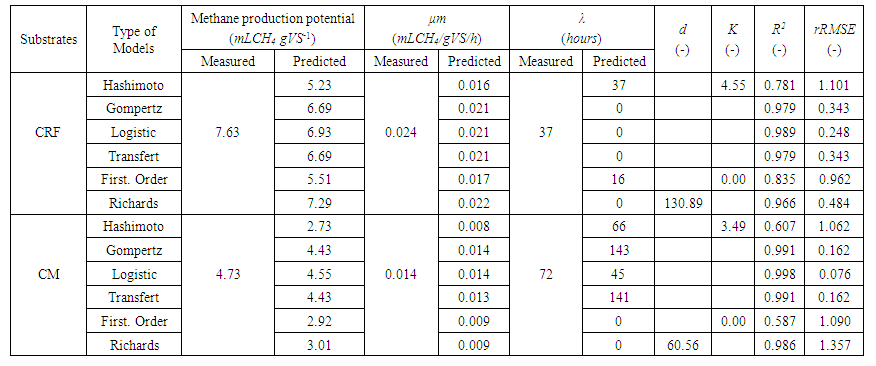 | Table 4. Kinetic parameters of cumulative methane production models |
As summarized in Table 4, CRF yield the higher methane production potential than CM (7.63 and 4.73 respectively). The lag phase periods for CRF and CM are 37 and 72 hours, respectively. The maximum specific production rates of methane for CRF and CM were 0.024 and 0.014 mL CH4/gVSh, respectively.All models predicted the methane production potential and the rate of methane production for both substrates adequately, Gompertz, Logistic and transfer models yielded the best predicted values. Hashimoto's model presented the best estimate of Kinetic parameters for both substrates. For CRF Richards model showed the smallest relative error, however, the model made a poor estimates of the lag phase period, λ and the maximum specific rate of methane production, μm. In terms of performance indicators of the models identified, Richard model is less efficient than the Logistic, Gompertz and Transference models. R2 and rRMSE for Richards, Logistics, Gompertz and Transference models are 0.966 and 0.484, 0.989 and 0.248, 0.979 and 0.343, and 0.979 and, 0.343, respectively. For CM, the Logistic model presents the lowest relative error rRMSE of 0.07 with a good estimate of the kinetic parameters λ and μm and best coefficient of determination R2 of 0.998. It is followed by the models of Gompertz and Transference.Figure 8 shows the cumulative methane production for both substrates measured and estimated by Gompertz, Hashimoto, Logistic, Transference, First Order and Richards models. The Logistic model presents the highest coefficients of determination (R2 = 0.989 and 0.998) and the lowest relative root mean squared error (rRMSE = 0.248 and 0.076) for CRF and CM substrates, respectively. It is followed by Gompertz and Transference models that show the same results both substrates studied (R2 = 0.979 and 0.991) and (rRMSE = 0.343 and 0.162) respectively. The Hashimoto model present lowest R2 and highest rRMSE for CRF and CM substrates. It is, therefore, the least suitable for evaluation the cumulative production of each of these substrates. Based on the results of the study on the difference between measured and predicted methane production potential and statistical indicators (R2 and rRMSE), Logistic model followed by Gompertz model is the best model adapt to model the kinetics of methane production and the estimation of methane production potential.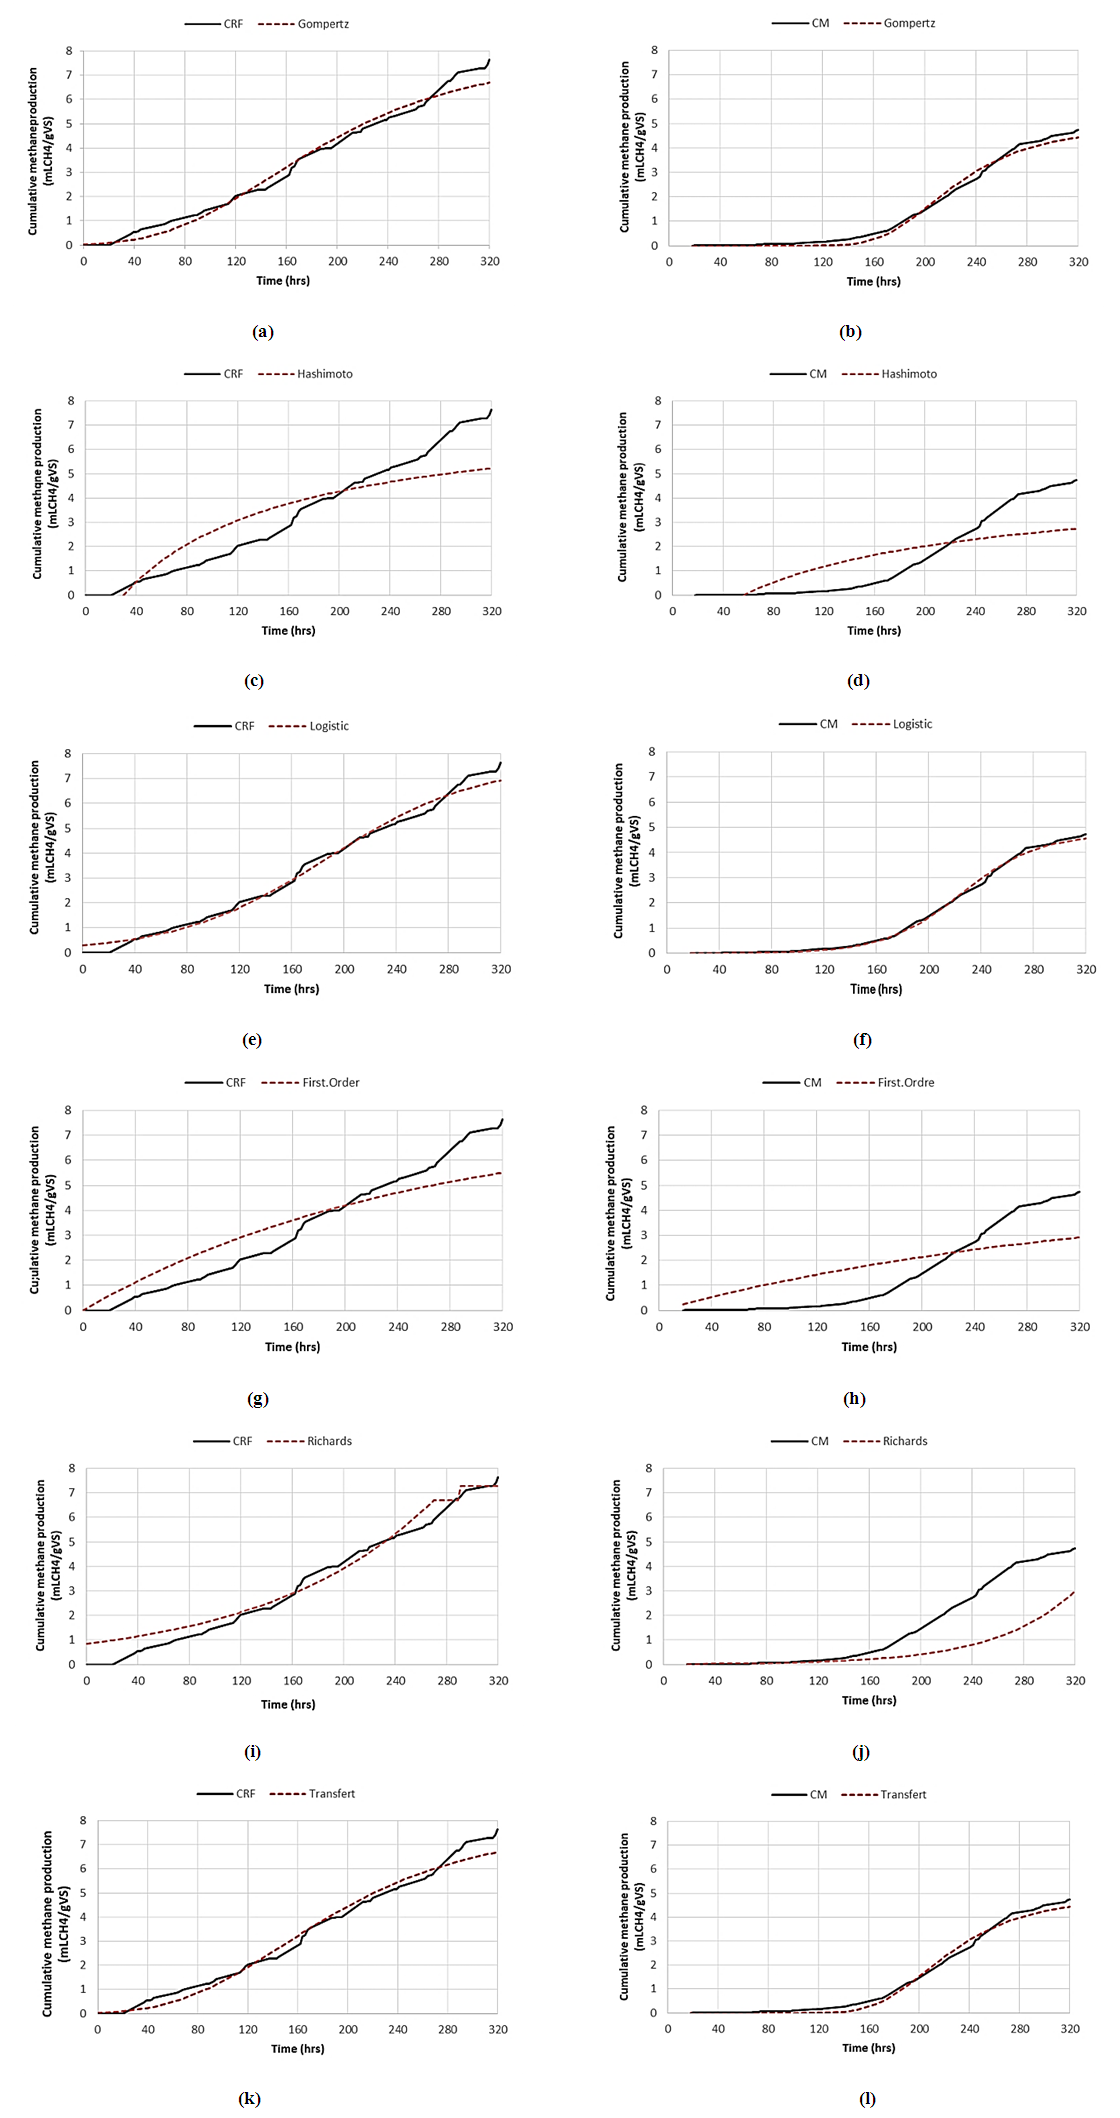 | Figure 8. Cumulative methane production curves measure and predict as a function of time for CRF and CM substrates using: (a) and (b) Gompertz model, (c) and (d) Hashimoto model (e) and (f) Logistic Model, (g) and (h) Transfert Model, (i) and (j) First Order Model, (k) and (l) Richards Model |
4. Conclusions
The physicochemical parameters of substrates investigated, MFB, CRF, SM, CM and SAM, were determined and used to indentify parameters of 6 mathematical models for kinetics of the AD process. The following were observed experimentally; 1) MFB yielded the highest biogas production (16.94 mL/gVS) among the five substrates investigated. Whereas the lowest biogas production (0.51 mL/VS) was observed with SAM. 2) High H2S concentration inhibited methane production. MFB yielded the largest biogas production, but its methane content was very low at 0.19%. H2S concentration in the biogas was around 2000 ppm during the period. 3) CRF and CM showed moderate biogas production with the highest methane concentrations at 57.49 and 50.35%, respectively. H2S concentrations remained below 70 ppm during the experiment. 4) SM and SAM yielded low biogas production and CH4 concentration due to low biodegradability or insufficient inoculum. 5) The digestion temperature follows the same profile as the ambient temperature regardless of the substrate. The pH range (6-7) obtained with the substrate to water ratio of 1:3 is optimal and has no influence on the production of methane. 6) The comparative study carried out by the six models, Gompertz, Logistic, Richards, Transference, First order and Hashimoto, showed all the studied kinetic models agreed well with the experimental data with coefficients of determination, R2, values greater than 0.966 except the Hashimoto and First Order models with R2 values less than 0.835. Among the six kinetic models studied, Logistic model predicts the cumulative methane production of CRF and CM better than the other models with rRMSE and R2 of 0.076 and 0.998, respectively. This experimental study makes the following recommendations: As a result of this study, the following recommendations are made:Ÿ Avoid the fermentation of substrates that contain a high quantity of proteins (meat, blood, etc.) that contribute to generating a high content of hydrogen sulphide;Ÿ Stay in the following optimal operating ranges:0ppm ≤ H2S content ≤ 70ppm20% ≤ CO2 Content ≤ 40%0% ≤ O2 Content ≤ 10%06 ≤ pH of digestion ≤ 724.4°C ≤ temperature of digestion ≤ 35°CŸ Install the digester in a location that is not sensitive to changes in ambient temperature;Ÿ Protect the gasometer against solar radiation to avoid the consequences of gas dilatation (loss of substrate through orifice, explosion).In the following, it would be interesting to carry out an analysis of the influence of the climatic parameters variation on the reliability of the devices used for the production of the biogas. A performance analysis and the optimization modelling of this kind of devices taking into account the degradation of digesters remains of great interest for biogas technology.
References
| [1] | Córdova O, Santis J, Ruiz-Fillipi G, Elvira Zuñiga M, Fermoso F, Chamy R (2018). Microalgae digestive pretreatment for increasing biogas production. Renewable and Sustainable Energy Reviews. |
| [2] | Mohamed Mahmoud A, Nourou D, Boudy B, Mamoudou N (2018). Theoretical models for prediction of methane production from anaerobic digestion: A critical review. International Journal of Physical Sciences 13, 206-216. |
| [3] | Hajji A and Rhachi M (2016). Effect of agitation on anaerobic digestion of household and similar waste under mesophilic regime. Journal Mater Environ Science 11:4136-4143. |
| [4] | Cathryn O, Beth R, Alistair G, William C, James U (2010). Anaerobic digestion of harvested aquatic weeds: water hyacinth (Eichhornia crassipes), cabomba (Cabomba Caroliniana) and salvinia (Salvinia molesta). Ecological Engineering 36:1459–1468. |
| [5] | Kheiredine B, Derbal K, Bencheikh M (2014). Effect of Starting pH on the Produced Methane from Dairy Wastewater in Thermophilic Phase. Chemical Engineering Transactions 38: 511-516. |
| [6] | Pramod K.P. and Michelle L.S (2012). Impacts of Temperatures on Biogas Production in Dairy Manure Anaerobic Digestion. Agricultural and Biosystems Engineering 4:629-630. |
| [7] | Mahmoud H.O. and Saadelnour A.A (2015). Enhancing of Biogas Production from Slaughterhouse and Dairy Farm Waste with Pasteurization. Los Angeles USA Apr 4:03-04. |
| [8] | Xumeng G, Matsumoto T, Keith L, Li Y (2014). Biogas energy production from tropical biomass wastes by anaerobic digestion. Bioresource Technology 169: 38-44. |
| [9] | Maamri S and Amrani M (2014). Biogas production from waste activated sludge using cattle dung inoculums: Effect of total solid contents and kinetics study. Energy Procedia 50: 352-359. |
| [10] | Manjula D.G and Mahanta P (2014). Comparison of kinetic models for biogas production rate from saw dust. International Journal of Research in Engineering and Technology 3:248-254. |
| [11] | SEHee-Jun K, Chan-Hee W, Hyun-Woo K (2018). Pathogen Deactivation of Glow Discharge Cold Plasma While Treating Organic and Inorganic Pollutants of Slaughterhouse Wastewater. Water Air Soil Pollut 229: 237. |
| [12] | APHA, (2003). Standard Test Methods for Direct Moisture Content Measurement of Wood and Wood Base Materials. Washington: American Water Works Association, and Water Environment Federation. |
| [13] | Hongqiong Z, Lina L, Wenzhe L, Xiangyou W, Yong S, Yongming S, Weijia G (2017). Optimization of mixing ratio of ammoniated rice straw and food waste co-digestion and impact of trace element supplementation on biogas production. Journal of Material Cycles and Waste Management. |
| [14] | Strömberg S, Nistor M, Li J (2015). Early prediction of Biochemical Methane Potential through statistical and kinetic modelling of initial gas production. Bioresource Technology 176: 233–241. |
| [15] | Porselvam S, Soundara V, Srinivasan S.V (2017). Enhanced biogas yield by thermo-alkali solubilization followed by co-digestion of intestine waste from slaughterhouse with food waste 3 Biotech 7:304. |

 Abstract
 Reference
 Full-Text PDF
 Full-text HTML