E. C. Merem1, Y. Twumasi2, J. Wesley1, P. Isokpehi1, S. Fageir1, M. Crisler1, C. Romorno1, A. Hines3, G. S. Ochai4, S. Leggett4, E. Nwagboso5
1Department of Urban and Regional Planning, Jackson State University, Jackson, MS, USA
2Department of Urban Forestry and Natural Resources, Southern University, Baton Rouge, LA, USA
3Department of Public Policy and Administration, Jackson State University, Jackson, MS, USA
4Department of Health Policy and Administration, Jackson State University, Jackson, MS, USA
5Department of Political Science, Jackson State University, Jackson, USA
Correspondence to: E. C. Merem, Department of Urban and Regional Planning, Jackson State University, Jackson, MS, USA.
| Email: |  |
Copyright © 2018 Scientific & Academic Publishing. All Rights Reserved.
This work is licensed under the Creative Commons Attribution International License (CC BY).
http://creativecommons.org/licenses/by/4.0/

Abstract
For years, renewable energy access and usage have played significant roles in the development of many nations in the Sub Saharan African (SSA) region. Currently, energy access continues to be the economic engine driving growth in Ghana and its various regions where energy sources, including hydroelectricity power and the generation of electricity form the backbone of the nation’s energy sources. However in the face of changing demographics and development activities sweeping across the country, the demand for renewable energy has grown so much that it is exceeding supply due to rapid population growth, industrial development, and domestic usage among households and others. Meeting the growing needs for electricity in these settings require more energy infrastructure in order to raise current capacity and with that, has come concerns about power outages and limited access to electricity in the country often compounded by physical, environmental and socio-economic factors. Despite ongoing efforts through different initiatives, the problems persist with rising tariffs. At the same time, very little exists in the literature to analyze renewable energy trends in Ghana from a temporal spatial perspective using Geographic Information Systems (GIS) and descriptive statistics under mix scale methodology. In the absence of such an approach, formalizing an effective policy with the right support tools for improved access becomes a daunting task. In light of these challenges, this paper will focus on the analysis of renewable energy trends in Ghana with emphasis on the issues, trends, environmental analysis, impacts, factors and efforts in the electricity sector. Regarding methods, the research adopts mix scale techniques of descriptive statistics connected to GIS to map the spatial dimensions of renewable energy use, distribution and the potentials. The results show growing changes in the form of gains and declines in the renewable energy variables from electricity demands to capacity generated while the GIS mappings reveal a gradual dispersion of renewable energy elements spread across the country over time. Added to that, the changes in renewable energy use in Ghana seem not farfetched; they ranged from policy, socio-economic forces and environmental and physical elements. To address these challenges, the paper offered several recommendations; they include the need for more design of energy infrastructure, improved policy, effective monitoring, and regular use of spatial information systems and the design of a national energy information system. The expectation is that this will strengthen current measures towards energy security with improved access.
Keywords:
Renewable energy, Ghana, Hydro, Access, Energy Security, GIS, Factors
Cite this paper: E. C. Merem, Y. Twumasi, J. Wesley, P. Isokpehi, S. Fageir, M. Crisler, C. Romorno, A. Hines, G. S. Ochai, S. Leggett, E. Nwagboso, Assessing Renewable Energy Use in Ghana: The Case of the Electricity Sector, Energy and Power, Vol. 8 No. 1, 2018, pp. 16-34. doi: 10.5923/j.ep.20180801.03.
1. Introduction
In many places in the Sub Saharan African region, access to electricity power in combination with vigorous industrialization is the main catalyst for economic development. As Ghana, moves to unlock her seemingly abundant energy potentials in a region dubbed the new frontier of energy in the continent in the face of mounting challenges prompted by energy insecurity. Electricity remains a fundamental component of daily activities required to sustain security, law and order, health care delivery, air and road traffic safety and the distribution activities essential to the markets [1-3].For that, renewable energy access has played major roles in the development of many nations in the Sub Saharan African region. In the case of Ghana, where the energy sector stands as the lifeline of progress [4], renewable access continues to be the economic engine driving growth in its regions where hydro power and the generation of electricity account for much of the sources [5-9]. At that, Ghana ranks high amongst the most dynamic economies in West Africa with over 14% GDP growth rate during the 2011 fiscal year. In the process, the demand for power continues to rise at 10-15% annually; however, unreliable production capacity in the country has precipitated economic growth downturn to the extent that in 2014, the nation incurred losses estimated at $320-$924 million in productivity and economic growth [1]. Essentially, power outages led to a 1.9% drop in the GDP in 2006 [10], but this resulted in 2-6% loss in Ghana’s GDP based on other estimates [1]. Because the bulk of Ghana’s electricity comes from hydropower, there exists a high propensity to drought, and this makes the nation even more dependent on costly oil for generation [10]. Considering that current projections puts the annual average growth in demands over the next decade at 6%, consumption of electricity reached 9,300 GWh in 2010. According to the Ministry of Energy, Ghana’s current electricity demand of over 2,000 MW requires annual capacity additions of about 200 MW in the country. At an electricity demand annual growth rate of 10%, it is estimated that Ghana requires capacity additions in order catch up with increasing usage in the medium to long term [1, 12].As expected, the projected electricity trends do bring other problems. The challenges that come to mind are so many that it raises additional woes for the country including emerging economic, financial, social, and environmental issues prompted by electricity use with far reaching implications. Accordingly, based on the changing demographics and development activities sweeping across the country, the demand for renewable energy has grown to the extent that it is exceeding supply due to rapid population increases. Other elements straining power supply consists of industrial development and production, domestic usage among households and other segments of the economy. Just as the nation’s energy sector has been bedeviled with the inability of power producers to meet demand, the current state of the sector seems reminiscent of the trends in 1982, when drought events resulted in a decrease in the generation capacity of Akosombo dam, the main power plant [13]. With time, the nation saw some improvements in 1986 followed by notable recurrences in 1994, 1998 and 2006. This has been interrupted since 2010 through the gradual worsening of the situation by drought induced decreases in electricity power capacity [13-16]. To address the problems, in the past 15 years, Ghana has not only added 1000 MW of thermal generation capacity [11]. However, inadequate and unreliable power supply remains a major constraint to future economic growth. Despite ongoing efforts, the problems persist with rising tariffs and price distortions through subsidies and incompatibility between current transmission networks [17], remoteness of resources from key markets, weak institutions and the lack of skilled personnel and low-tech infrastructure [18]. However, being in an emerging energy frontier in the SSA region, Ghana possesses an abundance of natural endowments backed by other alternative renewables to help unlock her renewable energy potentials if properly harnessed [2]. In that way, as part of the match towards universal access, Ghana strives to add 3,000 MW of power onto installed capacity in line with a three phase action plan aimed at mitigating the challenges hindering the nation’s power sector by 2020 [19-21].At the same time, with the exception of a recently concluded research [22] focusing on regional energy trends in the ECOWAS area. Very little has been published in the literature using Geographic Information Systems (GIS) and descriptive statistics to fully analyze renewable energy trends in Ghana from a temporal spatial perspective via a mix scale method. Related studies in the literature that highlighted the use of GIS as a decision support tool for energy management germane to Ghana have also emerged over the years. This includes the Geography of wind energy and accounting for oil and gas [23, 24]. The other studies where GIS as an assessment tool found valuable use in energy resource analysis consists of the monitoring of fossil fuel emissions from and oil and gas[25]. Added to that is the analysis of the ecological effects of mining [26]; the evaluation of oil and gas liabilities [27]; and the impacts of petroleum activities [28]. In the absence of such a variety of applications to boost management, formalizing an effective policy for improved renewable energy access becomes a daunting task in Ghana. In light of these challenges, this paper will build on the common voids as identified in the literature by focusing on the analysis of renewable energy trends in Ghana with emphasis on the issues, trends, environmental analysis, impacts, factors and efforts using a mix scale model of GIS connected to descriptive statistics. The key significance of the study stems from the potentials to generate decision support tool for managers in Ghana’s renewable energy sector.For that, the research has five parts. The first section covers the background information and the introduction and issues related to renewable energy trends in Ghana. Section two highlights the materials and methods with the study area analysis. The third section describes the results of the enquiry based on energy analysis, coupled with factors, impact assessment and efforts. Section four presents the discussions of the findings and section five covers the conclusions and recommendations of the research. In addition, the study has five objectives. The first one is to assess the issues and the efficacy of renewable energy in Ghana. The second aim examines the state of Ghana’s renewable energy services with focus on electricity while the third objective is centered on the evaluation of the role of state agencies in addressing electricity sector challenges. The fourth objective focuses on devising a decision support tool for policy makers; the fifth one on the other hand involves the development of an index for gauging energy insecurity.
2. Methods and Materials
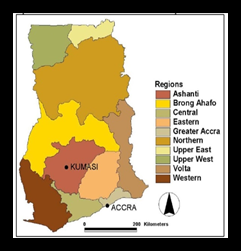 | Figure 1. The Study Area of Ghana |
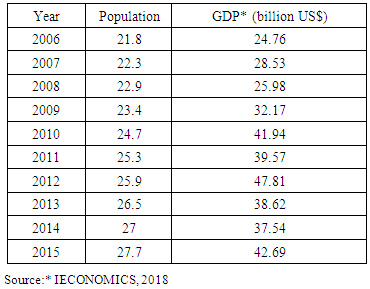
Table 1. The Population and GDP of Ghana
 |
| |
|
The study area Ghana in Figure 1 is located in West Africa off the Gulf of Guinea with a population of approximately 27 million (Table 1), that spans an area of 238,535 km2 with an Atlantic coastline that stretches 560 km towards the Ocean to its south. The country has vast grasslands mixed with southern coastal shrub lands and forests, with the southern part of Ghana being a primary location for the mining of industrial minerals and timber [8]. Ghana encompasses also plains, waterfalls, low hills, rivers and Lake Volta, the world's largest artificial lake essential to the generation of hydroelectricity in the south. The Northern region being adjacent to a vast desert ecosystem has great potentials for the generation of solar power. In addition to being known for its lush forests, different animal habitats and life forms, and miles of sandy beaches along a picturesque coast, the drainage system is dominated by the Volta River basin, which includes Lake Volta [29, 30]. On the other hand, most of the other rivers, such as the Pra, the Ankobra, the Tano, and a number of smaller ones, flow directly south into the ocean from the watershed formed by the Kwahu Plateau, which separates them from the Volta drainage system. Interestingly, energy use in the country in 2009, fell under three categories of biomass, petroleum and electricity with biomass constituting a major source. In as much as Ghana’s supply of electric power comes primarily from hydropower generated at Akosombo and Kpong dams and two thermal plants at Aboadze in the Western Region. Power supply in the nation also originates from other renewable energy sources in particular, while solar energy comes from remote rural communities in the country as well [8, 31-34, 16, 35, 36]. Just as the key entities in the Ghanaian electric power industry such as the electric commission of Ghana have indicated, Ghana’s total installed capacity stands at 28,845 MW, but electricity supplied in the country has not been meeting public demand and it is implicated in the ongoing power crisis. For that, Ghana’s Electricity usage soared at 10-15 % yearly in the past 20 years to a level where it its projected that the average demand growth over the next decade will be about 6% per year. As a result, electricity use reached 9,300 GWh in the 2010 fiscal year [31]. Without concerted efforts from state entities to remedy current patterns of energy supply, the projected electricity consumptions could have serious socio-economic and environmental implications for the country. Furthermore, the essential justifications for selecting Ghana as the study area, stems partly, from its potentials and the significance of energy activities in a country where electricity accounts for about 11% of the nation’s final energy consumption. With a customer base of approximately 1.4 million, it has been estimated that 45-47% of Ghanaians, including 15-17% of the rural population, enjoy access to grid electric power with a per capita usage of 358 KWh. With much of the regional capitals all linked to power grid connections at that pace, the consumption rates in the rural areas points to elevated levels along coastal and forest ecozones of 27% -19% compared to 4.3% in the Savannah [17]. Given that 70% of Ghana’s population has electric power access, the other 30%, numbering 5 million, are scattered in remote locations where off grid options are the best way to go. Even with that, of great concern is the fact that Ghana's renewable energy power sector faces periodic losses in grid line transmissions (Fig 3). Considering the growing needs for power supply in the country in 2004, Ghanaians not only consumed about 5,158 GWh of electricity, but it is estimated that about half of this amount is used by residential consumers for household purposes, while commercial and industrial users account for the rest [17]. The growing pace of electricity consumption in the country also coincides with a rising population of 21.8 million in 2006, which later rose to a record high of 27.7million citizens in 2015 and a GDP increase of $24.76 to $42.69 billion during the same period (Table 1) [37]. Whereas Ghana’s total installed capacity is 2,884.5 MW, electricity supply still does not meet the rising demands, hence the ongoing power crisis. Analyzing it herein with the latest techniques in mix scale methods is critical to an improved energy policy for the country.
2.1. Methods Used
The paper uses a mix scale approach involving descriptive statistics and secondary data connected to GIS to analyze the issue of renewable energy trends in Ghana with focus on electricity use in the Sub Saharan African nation. The spatial information for the research was obtained from the United Nations Industrial Development Organization (UNIDO), Global Energy Network Institute (GENI), the African Energy Data base, the Energy Commission of Ghana (ECG) and The Northern Electrification Department (NED). Other sources consist of the Ministry of Energy, the Volta River Authority (VRA) and the Electricity Company of Ghana, the World Bank Group, and the United States Agency for International Development (USAID), the United States Energy Information Administration, International Energy Agency and the German Agency for International Cooperation. The actual renewable energy indicators based on consumption, production, export and import came from the Energy commission of Ghana and the Ministry of Energy while the electricity commission of Ghana was instrumental to the procurement of power data for different users from residential to industrial operators. The ECOWAS Center for Renewable Energy and Energy Efficiency followed up with the partial provision of the solar thermal information. The UNIDO, The Global Energy Network Institute (GENI) and the Ministry of Energy group offered some of the maps and information on renewable energy and electrical network and hydro-energy potential, while the regional and federal geographic identifier codes of the nation were initially used to geo-code the info contained in the data sets. This information was processed and analyzed with basic descriptive statistics, and GIS with attention to the temporal-spatial trends at the city and regional levels in Sub Saharan African nation. The relevant procedures consist of two stages listed below.
2.2. Stage 1: Identification of Variables, Data Gathering and Study Design
The initial step involves the identification of variables required to appraise renewable energy use with emphasis on electric energy consumption in the Sub Saharan African nation of Ghana. The variables consist of the electricity generated, electricity consumed, petroleum products consumed, biomass consumed and electricity generation by plant per installed capacity, electricity import, export and net import. Additional variables of importance in that category comprises of electricity consumption by customer class covering residential, non-residential, industrial, street lighting, and total, the average annual growth in power demand by users, customer population and energy consumption, electricity purchases and sales by ECG and NEDC, GDP constant in 2006 prices. The others includes biomass resources, installed capacity, average annual energy, identified mini hydropower sites in Ghana, installed capacity, average annual energy, Gross Wind resource potential of Ghana, and small-scale solar PV systems in Ghana and grid power transmission loss %. Of great significance among the variables are the existing power generation sources, dependable capacity, available capacity, fuel type, and availability factor, wood for charcoal, wood for firewood and total wood Supply. Additionally, access to databases that are available within the federal and regional, national archives in the Sub Saharan African nation of Ghana and other agencies quickened the search process. The process continued with the design of data matrices for socio-economic and environmental and energy variables covering the periods from 2000, 2006, 2008, 2010, 2012 and 2016. The design of spatial data for the GIS analysis required also the delineation of national and regional boundary lines of Ghana. With boundary lines unchanged, a common geographic identifier code was assigned to each of the units to ensure analytical coherency.
2.3. Stage 2: Step 2: Data Analysis and GIS Mapping
In the second stage, descriptive statistics and spatial analysis were employed to transform the original socio-economic and renewable energy of electricity data and others into relative measures (percentages/ratios). This process generated the parameters for estimating and assessing the trends, the rates of consumption, generation, capacity, electricity import, export and net import from Ghana to other areas in the West African region, wood for charcoal, wood for firewood and total wood Supply. This was facilitated by measurements and comparisons of the trends over time. While this approach helps track the levels of consumption, power distribution grid line losses, the prices, the tables and graphs highlight electricity consumption by customer class covering residential, non-residential, industrial, and average annual energy. It did compute the identified mini hydropower sites in Ghana, installed capacity, average annual energy, and gross wind resource potential of Ghana, small-scale solar facilities and the environmental and economic costs for the purposes of analysis. The remaining steps involve spatial analysis and output (maps-tables-text) covering the study period, using Arc GIS 10.4 and SPSS 20.0. The spatial units of analysis under a mix scale consist of cities, region, and the boundary and locations of renewable energy activities. The geographic data for Ghana which covered its boundaries and regions, also includes ecological data of land cover files, and paper and digital maps from 2002-2016. The outputs of the spatial data were mapped and compared across time from the 2000s to 2016 to see the dispersion of the trends in electricity use, consumption and generation capacity, export import, net import, sectorial use among households, industrial and street lighting. The same procedure was extended further to cover the population numbers, other renewables made up of biomass, solar, wind and hydro-electricity and power generation, the pricing, and the socio-economic factors associated with power fluctuations in the county through the study area.
3. The Results
This section of the paper focuses on temporal and spatial analysis of energy trends in the study area. There is an initial focus on the analysis of electricity consumption (sectorial use), biomass, and petroleum distribution. The other portions highlight electricity generation at various plants, electricity export, import, and sectorial usage based on descriptive statistics. This is followed by other components of the section consisting of an impact assessment, GIS mappings, and the identification of the factors fuelling renewable energy problems in Ghana and the current efforts.
3.1. Energy Analysis: Electricity Use and Other Sources
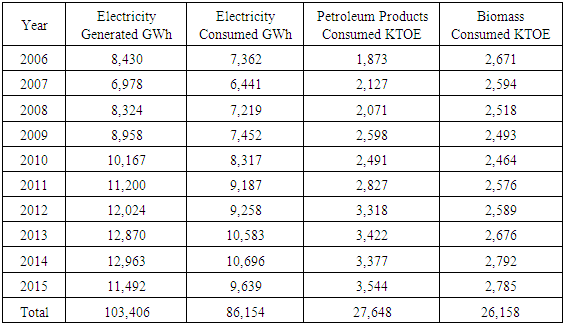
The energy indicators for Ghana from 2006-2015, showed that the total volume of electricity generated and consumed stood at 103, 406-86,154 GWh. All through the first four years of 2006-2009, electricity generated changed from 8,430-6,978 GWh. The trend continued in 2008-2015 when production fluctuated further down the lines at 8324 -8958 GWh. In the following five years, 2010-2014 the load of generated power rose from 10,167, 11,200 and over 12,000 GWh. This continued onto the fiscal years 2013-2014 until a sudden drop to 11,419 GWh in 2015. Another thing to glean is that of all the years, the period of 2012-2014 outpaced the others in the volume of generated electricity to the extent that, the trend reflects an average of over 12,000 GWh. This was somewhat higher than the overall average of 10,341 GWh power load for the entire country. Of the 86,154 GWh in consumed electricity nationwide, Ghana saw a surge in the volumes of power usage among consumers in the entire country over the years. This came in the face of some fluctuations beginning at 7,302-6,411, 7,219-7,542 GWh from 2006 through 2009. From then on, electricity usage not only increased year after year until 2014, but the breakdown indicates that the volumes moved from an opening level of 9,187 to 10,196 GWh (Table 2).Table 2. Energy Indicators of Ghana 2006-2015
 |
| |
|
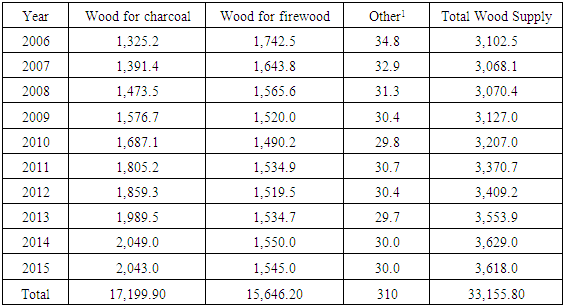
Regarding petroleum products and biomass materials usage in the country, there exist sizable activities while both energy sources share identical totals (27, 648-26,158 KTEO) in power loads during the years. Aside from the 1,873 KTEO in consumed petroleum products in Ghana as shown in 2006, the level of hydrocarbon consumption held firm at over 2,000 KTEO mark under a level much lower than the 2,423 KTEO average from 2007-2011. Despite these variances, Ghana maintained an average biomass consumption of 2,616 KTEO in a setting where the yearly distribution never exceeded the 3,000 KTEO mark [38]. Even though the usage level for 2006 stood at 2,671 KTOE, the periods of 2014 – 2015 with 2,792-2,785 KTEO emerged as the highest points in biomass consumption alongside 2013 at of 2,676 KTEO (Table 2). Taken together, of all the years, despite the total wood supply of 33,155.80 KTEO, the volume of wood supply rose year after year with the exception of a sudden drop from 3,629.0 KTEO-3,618.0 during 2014-2015. In distinguishing the various wood fuel sources (wood for charcoal, wood for firewood and other mostly saw dust, sawmill residue) for the country between 2016-2015. Many Ghanaians saw more supply wood for charcoal with overall 17,199.90 KTEO compared to the 15,646.20 KTEO for firewood and the 310 KTEO for other, which includes sawdust, and sawmill residue. From the table, it is clear that Ghanaians are major users of charcoal wood and firewood of biomass energy. This shows that wood for firewood in the country has grown most of the time and has also remained firm, if not for the slight fluctuations of 2,049.0-2,043.0 for the periods of 2014 to 2015 (Table 3).Table 3. Wood Fuel Supply (ktoe) in Ghana
 |
| |
|
3.1.1. Electricity Generation among Various Plants
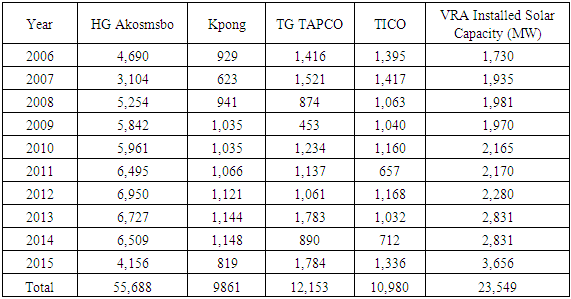
In the context of electricity generation, the activities in designated plants, and generated capacity among some of the top sites and solar power sources scattered across the country between 2006-2015 highlights the level of usage (Fig 7). Amongst them, the HG Akosombo facility in all the years listed accounted for 55,688 GWh in total volumes of generated power. While it exceeded the capacity in three other facilities from Kpong to TICO, the individual plant powerloads of 12,153-10,980 GWh for TG TAPCO and TICO surpassed the generated load for TG Kpong at 9,861 GWh. With an average generation level of 5,669 GWh, the HG Akosombo’s capacity went from 4,690 GWh in 2006 to 3,104 by 2007. From there on, the electric plant produced an average of 5,686 GWh of power from 2008-2010 and by 2011-2015, the average power generated at the facility topped 6,167 GWh. Elsewhere Kpong power plant which started closely at 926, 636, and 949 GWh from 2006-2008 picked up steam slightly all through 2009-2014 at 1,030-1,148 only to slide slightly in 2015. Notwithstanding the changes of 1,416-1,521 GWh as evidenced at TG TAPCO and the 872-453 in 2006-2009, the installed capacity generation for TICO varied from 1,395-1,417 and 1,063-1,040. Given TAPCO’s power load increases of 1,234-1,784 MW, the capacity for TICO also surged by 1,160-1,336 during 2010-2015 (Table 4). Of notable importance also in all these is the distribution patterns for VRA in total installed solar capacity during 2006-2015 out of the overall total 23,549 MW at an average of 2,354 MW nationwide (Figure 8). Accordingly, the value of solar capacity for Ghana’s VRA not only surged consistently beginning at 1,730 MW-1,970 MW from 2006-2009, but the average for that span of time at 1,904 MW seemed lower than the 2,656 MW for 2010-2015.Table 4. Electricity Generation by Plant (GWh) per Installed Capacity (MW)
 |
| |
|
3.1.2. Other Renewable Energy Sources
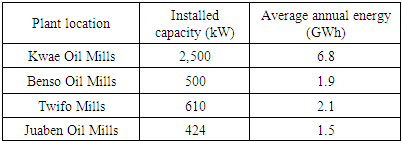
Regarding modern energy sources from biomass to solar, Ghana seems quite well endowed given the vast array of plant locations spread across the country and their installed capacity. Of the capacity of four biomass plants in the country over the years, the Kwae oil mills has 2,500 kW of energy along with 6.8 GWh while the Bensia oil mills produces about 500 kW and 19 GWh in installed capacity. Elsewhere, the outputs for Twufor and Juwaban mills covers 610 kW, 424 GWh to 2.1-1.9 GWh respectively (Table 5). In addition to the total of 63 identical mini hydropower sites in Ghana, the nation has about 7,736 kW in minimum load and 24,505 in potential power kW. Table 5. Modern Energy from Biomass Resources
 |
| |
|
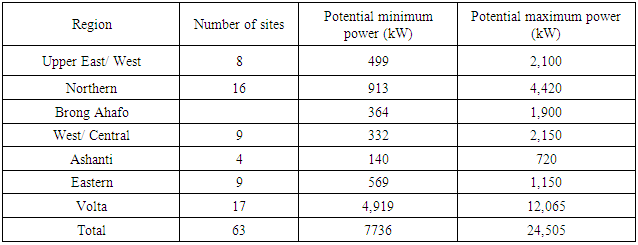
Among the seven regions, both Volta and the Northern region had more sites (16-18) compared to the 9-8 sites of hydro power situated in the Western and Central and Upper East and Upper West areas of the nation. The same can be said of the potential minimum power load distribution where Volta alone had accounted for 4,919-12,065 kW (Table 6). Added to that, bear in mind that vast wind resources potentials in the country come under different scales of moderate to excellent at various classes of 3,4,5,6.Table 6. Identified Mini Hydropower Sites in Ghana*
 |
| |
|
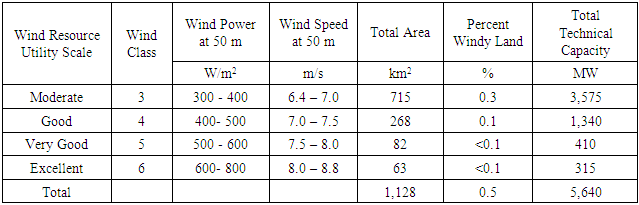
Of these, note that the wind power distribution under the 4 classes at 300-400,600-800 extends to a total area of 1,128 km2 in which moderate and good scale held on to the top level of 715-268 km2. Along these lines, the technical capacity measured in watts stood at 5,640 MW. That was followed by the moderate and good utility scale, which accounted for 3,575-1,340 MW while the excellent scale stood at 410-315 MW respectively (Table 7). Solar PV Systems potential in Ghana on the other hand at an estimated total of 793 showed a broad spectrum of users that are active within the built environment (Figure 2). Amongst these, rural, home system, water pumping and telecommunication were listed as the top users. The breakdown of the individual systems points to rural homes with 450 kW followed by water pumping and telecommunications at 120-100 kW individuals. The average annual production at GWh also reflects the capacity loads (kW) with average annual production of 70-0.90GWh.Table 7. Gross Wind Resource Potential of Ghana
 |
| |
|
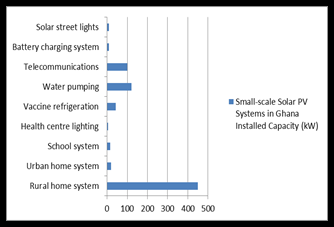 | Figure 2. The Distribution of Small Scale Solar PV Systems |
3.1.3. Electricity Export and Import and Use among Consumers
The observable trend from electricity usage in Ghana highlights the export and import dimensions in Ghana’s energy market and the volume of power usage among residential, nonresidential, industrial and streetlight. When it comes to import vs. export, Ghana appears to have exported more electricity in the span of 10 years when it imported power from 2006-2015. In comparing both markets, the total imported electric power load of 2,151.3 GWh seemed substantially lower when compared to the export load of 6,258 GWh in the same periods. While imported electricity power load stood out significantly in the first two years of 2006-2007 at 629 GWh-435 and 278 in 2008, note that they faded in the subsequent years until a rebound of 233 GWh in 2015. Other than that, electricity export stayed robust with 754 GWh and 754 GWh in 2006-2008 followed by an all-time high of 10.36 GWh in 2010. Even though it did slide to 691-667 GWh and to an average of 529-534 GWh for 2013 through 2015, in 2006-2009, the average for that span of time at 1,904 seemed lower than the 2,656 MW for 2010-2015. This is quite significant when compared to imported power loads in the same periods. Furthermore, the differences as shown in the import column indicate the disparity between them with the exception of 2007 when net import reached 189 GWh (Figure 3). 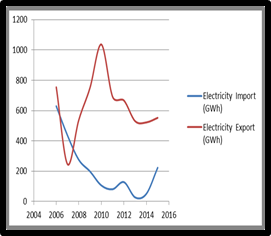 | Figure 3. Import and Export of Electricity Power over the Years |
3.1.4. Electricity Usage among Different Consumers
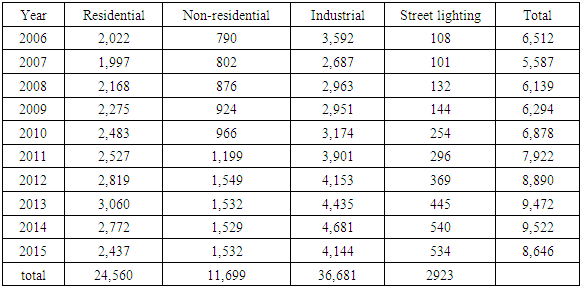
Interestingly, among the electricity consumers in the built environment in Ghana all these years from residential to street lighting in the zoned areas of the built environment, the most notable users such as industrial and residential community outpaced the non-residential and street light corners by 36,681 GWh-25,460 to 11,699-2,923 GWh of electricity power. At seemingly predictable averages of 2,189-3,073 for residential and industrial followed by 871.6 and 147.8 GWh for non-residential and street lighting. The averages for the other periods (of 2011-2015 at 2,723-42,263 GWh) exceeded the previous years for non-residential which averaged 1,468 GWh, and the 436.8 GWh for streetlight in the latter years of 2011-2015. Overall, Ghana saw more usages in electricity power load in entire categories of uses in the built environment all through 2011-2015 at levels higher than the periods of 2006-2010. Under that scenario in terms of annual growth rate in power demand between 2000 through 2013, the non-residential and residential area consumption levels out grew industrial users from 2010-2013 by 8.9-62, 16.5-7.8% and by 33-15.4 % in 2013. Within the same period, the industrial sector saw growth levels of 2.2-9.7 to 1.7% between 2008 through 2013 (Table 8).Table 8. Electricity Consumption by Customer Class (GWh)
 |
| |
|
3.2. Impact Assessment
From the foregoing analysis, it is obvious that Ghana experienced notable impacts with policy implications over time. In the years 1983-1984, 1997-1998, 2003 and 2006-2007, the country not only suffered from serious electric power rationing, but during the 2006-2007 fiscal year, electricity power rationing, equating to about 24 hrs in 48 hrs represented the severest power rationing ever witnessed in Ghana with catastrophic consequences. Out of the 1,180 MW generated at that time by two hydropower dams, only about 400 MW was produced. This affected all sectors of the economy including industry, mining and domestic users. For that, manufacturers were reducing output, shortening the workweek and even contemplated investment in power generators while revenues to the state dwindled due to shortfalls in production by several million dollars in 2006. In the process, power rationing left factories idle and wide-ranging strips of Accra and other cities dark at night with the most feared result that years of efforts spent creating an image of Ghana as receptive to foreign investment could be jeopardized. In view of that, most people went without electricity for at least 12hrs every other day and that was compounded further with insufficient rain to keep hydro stations functioning. Furthermore, the water level of Lake Volta, the largest man-made lake in West Africa which normally supplies 60% of Ghana’s energy needs, was at an all-time low of 234.96ft below the critical minimum level. The lack of water in the lake created a 300 MW power shortfall and weather forecasters predicted drought in all three Northern regions of Ghana where the sources of the rivers that supply the lake Volta are located. With the costs of power from fossil fuels high, the state spent close to $42 million monthly to fuel the generators. The accumulated deficits in regular power supply to consumers in the country has left the authorities with little or no choice but to mitigate the challenges as shown in the section dealing with efforts.
3.3. GIS Mapping and Spatial Analysis
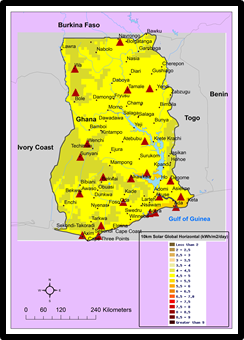
The GIS analysis covers renewable potentials of solar power, the vast network of transmission systems and hydropower and biomass energy infrastructure stretched across various regions of the country over the years from the north to southern part. Of the existing renewable energy sources in Ghana over the years such as solar energy potentials, from the map, note that DTI solar dryer test facilities have been deployed and put into use in selected places in the country. Based on the spatial distribution patterns, there seems to be a lower southern flavor attached to the exercise in the fiscal year 2002 with many of the test sites clustered around coastal areas located around Apam, Winneba and Teshie. Despite their seemingly notable vicinity to each other among the selected test sites in 2002, the focus for solar kiln stayed visibly present around Mankoadze, followed by solar crop dryer at Pokuase along with solar fish dryer at Tema (Figure 4). In a world in which solar energy is barely used, it continues to find currency in Ghana in multiple ways. For that, in tropical nations like Ghana with abundance sunlight, the design and concentration of solar power (CSP) plants forms an integral part of the solar energy infrastructure. Considering that the capacity to direct the reflection and conversion of the sun's energy via solar mirrors, to high temperature and, eventually, to power is vital to energy delivery. Identifying the time, the location and amount of sunshine as done herein remains vital in order to plan such large solar power systems. Solar radiation emitted by the sun, can be captured and converted into useful forms of energy such as heat and electricity. In terms of distribution levels, the global total radiation kWh/m2/day for Ghana points to higher values for the upper Northern portions of the country with numbers ranging from 5.3-5.6 kWh/m2/day compared to the 5-5.3 on the central plain, further along the lower south coastal areas came fluctuation levels measured at various frequencies of 4.6-4.5-5 (Figure 5).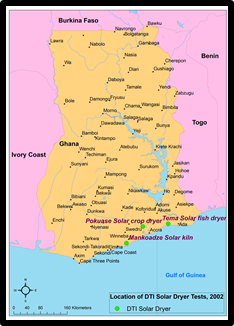 | Figure 4. Locations of DTI Solar Dryer Tests, 2002 |
 | Figure 5. Global Solar Irradiation for Ghana |
Since off grid communities are the functioning of systems in remote areas independently without connection to electrical power grid and not vulnerable to outages. The map highlights off grid areas served with power from differing solar radiation scales measured at 4.5-4.8 (kWh/sq.m/day), 4.9-5.2(kWh/sq.m/day), 5.3-5.6(kWh/sq.m/day) and represented in green, yellow and red colors. Based on the spatial details, the recommended off grid communities indicating solar radiation levels and small hydro sites stretches across the different regions of Ghana. Under the three classifications estimated at different scales, aside from three spots in the upper North spread across individually in the upper East and West and Northern region highlighting small hydro facilities. The geographic presence of off grid communities as denoted in green triangular form shows a very notable concentration with huge clusters measured at 5.3-5.6 kWh/sq. m/day in the Northern part of the country denoted in red. From there on to the central areas of Ghana comes, gradual reappearance of pockets of small hydro sites in yellow and at sizable radiation level estimated at 4.9-5.2(kWh/sq.m/day). Moving further onto the lower South, one notices a minor network of small hydro sites followed by off grid communities under radiation scales of 4.5-4.8 (kWh/sq.m/day at levels lower than the concentration levels in the Northern part of Ghana (Figure 6). The other aspects of solar energy potentials, involves the spatial cluster of solar concentrators, solar PC (power voltaic), and solar global horizontal spread across the country with many in the lower South and the some in the North. These scales range from the 10km solar global horizontal (kWh/m2/day), 40km Solar PV (kWh/m2/day) to the 40km solar concentrators (kWh/m2/day) (Figure 7,8, 9). | Figure 6. Off Grid areas with Solar Radiation Scales |
 | Figure 7. 40km Solar PV (kWh/m2/day) |
 | Figure 8. 40km Solar Concentrators kWh/m2/day |
 | Figure 9. 10km Solar Global Horizontal kWh/m2/day |
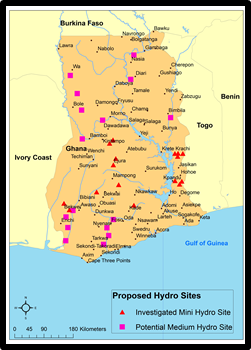
In the context of energy infrastructure, a vast network of interconnected system of power distribution run deep across the different areas of Ghana and into its borders with extensive concentration along the Southern half of the nation. With more transmission lines spread across the Northern and Southern parts of the country, international power links of varying loads stretches through multiple cities in different countries from Ivory Coast to Burkina Faso (Figure 10-11). The spatial distribution of hydro sites for both the investigated mini and potential medium types and their corresponding electricity power loads in Ghana once again reaffirms the dominance of the coastal and lower Southern region of Ghana followed by the Northern region and some in the central portions of the country. By common counting alone, the areas adjacent to the lower South of Enchi, Sekondi and Takoradi not far from Accra had about 4-8 potential sites coupled with additional investigated medium hydro sites clustered towards the central region as well. The same can be said of the distribution patterns near Bola, Wa, Nasia, and Daboya and others in North with over 5 potential hydro sites. In the same vein, note the gradual dispersal of additional investigated mini hydro sites estimated at 3 each on the eastern areas of Krete Krachi and Kpandu which underscores the potentials in the region. Above all, despite the sites in North, the Southern region appears to have more presence of investigated sites than the former (Figure 12).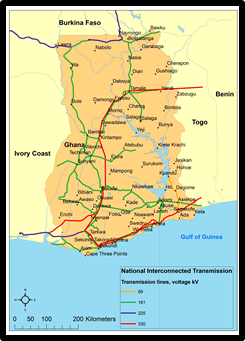 | Figure 10. National Interconnected Transmission System |
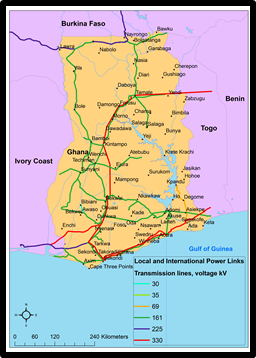 | Figure 11. Local and International Power Links |
 | Figure 12. Proposed Hydro Sites |
The map in Figure 13 typifies a miscellaneous distribution of different renewables such as biomas, hydro, and solar. The unique nature of the map shows areas where these renewable sources are prominent across Ghana. Among them, the spatial diffusion of renewable energy sources made up of palm oil mill points to visible concentration at Benso, Jemba, Kwaei, and Twinfu solely located on the Southern part of Ghana along the cities of Kumasi and metro areas of Accra, Cape Coast, and the Takoradi axis. On the one hand, based on the above spatial analysis of palm oil mills distribution, there seem to be a huge regional disparity with most mills in the Southern region than the Northern part. On the other, the major hydro power stations such as Akosombo, Kpong, in the South coupled with Bui in the Central region, the network of major solar power stations also showed multiple presences at Nzema and Goma Onyaneze in the South near to Accra, the Cape Coast and Takoradi. In comparison, this is different from the single site in the uppermost North identified as Ngarrago near the city of Bolagataga in the North East (Figure 13). Another dimension to the distribution network of renewable energy resources in the nation involves the vital importance of the central part and the presence of Volta Lake as a key hydropower source. The lake remains fully responsible in fueling the operations of the power stations at Kpong, and Akosombo with further spread onto the central region and the lower Southern part in the distribution of energy across the country (Figure 13).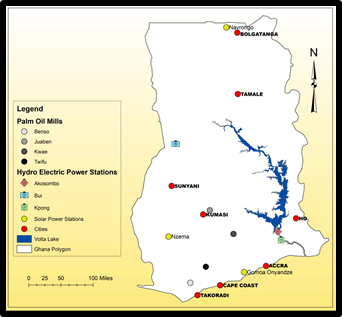 | Figure 13. Hydro Electric and Solar Power Stations |
The geographic distribution of renewable energy infrastructure in terms of river basins and medium hydro sites in the country and the proximity to major population centers once again shows a mix of North-South even split with 6 of the sites concentrated in the Central and Northern areas, the South and Western parts of the Ghana showed similar patterns. The uppermost part of the map not only highlights the cities of Bakwu on the North East and Wa along the North West and Tamale in the same region, but there is the presence of Volta River in the zone. The other features consist of the Sisidiu, Kalwani, as well as Black Volta and Oiti River Basins spread across the adjoining cities with essential energy services. Further down the South comes a network of several river basins serving medium hydropower sites in which river basins such as Bia, Tano, Afram and ofkiu in the Southwest serve the cities of Sunyuna and Kumasi. In the lower South, emerges the spread of two other major River basins of Pra, and Volta with much of the energy production and distribution activities further tied to the coastal areas along Takoradi, Cape coast, Accra, and Ho (Figure 14).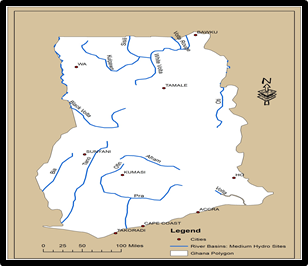 | Figure 14. River Basins Medium Hydro Sites |
3.4. Factors Responsible for the Energy Problems and Efforts
This portion of the paper describes the factors and efforts put in place through initiatives. In the case of factors, the renewable energy issues especially electricity power outages in Ghana do not operate in a vacuum. On the one hand, they are associated with a set of factors listed below under policy, socio-economic and ecological themes. On the other, several measures are being put in place as part of concerted initiatives aimed at improving renewable energy access nationwide in Ghana. These elements are described one after the other in the following paragraphs.
3.4.1. Weak Policy Framework
In the absence of commonly defined policy standards to adhere to in the enforcement of the nation’s energy policy framework, attainment of efficient policy remains elusive. This stems from the government’s ineffectiveness to reform and drive the sector forward in the midst of uncertainties that accumulated over the years. In that light, it comes, as no surprise that the current energy policy in the country has some weaknesses and notable ambiguities. Under the anomalies embedded in the policy, there are different tariffs for industrial, commercial and residential areas. Considering that the government of Ghana subsidizes lifeline consumers by US $1monthly, in those circumstances it is unable to make prompt remittances to utilities. At the same time, total subsidies owned by the government to distribution utilities by the end of 2003 ranged from US $400,000 to US $1.4M. The average tariff for electricity was below 5 US cents per kWh until 1998 when it rose 5.2-8.2cents but regionally lower. Because such tariff level is not attractive enough to high-level commercial and industrial usage, as a result, the industry often subsidizes residential areas. The lopsided forms of these kinds of distortions in policy hampers the development of an industrial base in Ghana that can compete in regional and global markets in the 21st century, hence the role of weak policy as a factor.
3.4.2. Socio-Economic Elements
Another element is the changes in purchases and sales of electricity carried out by power suppliers (EEG and NEDC). From the available information, the buying and selling or demand and supply of electricity has grown from the periods of 2006 to 2015. Based on the demand for 681,617-500-458 GWh from the ECG and the remaining 7,199-5,488 GWh, it is clear that population pressure which grew alongside the GDP prompted rising demands beyond the capacity of the nation’s energy sources. Considering the links between mounting demands for power supply by residential, industrial consumers and the health sector coupled with the interactions between various segments of the economy in light of the changing demographics that occurred over the years. The pressures from a population rise of 21.8 to 27.7million with a GDP surge of $24.76 billion to $42.69 billion in 2015 may have prompted major volatilities strong enough to affect supply and demand. Knowing that the spillovers from a teeming population and rising GDP translates into more demands for energy supply, new settlements and the need for sustained development and growth requires the provision of energy services. Thus, it comes as no surprise that such changes did spark the rising distribution and exchange of goods and services nationwide, which likely spurred more demand for electricity [38]. Without that, there would have been little demands for petroleum products, biomass, and hydro and solar power over time in the country.
3.4.3. Environmental and Physical Factors
The grid power transmission at an average of 4.07% in losses since 2008 in Ghana fluctuated from 2008 through 2009. During that period, variations reached about 3.7-3.8 % and continued (to 4.6-4.3 in 2011 to 2014) until a drop to 3.8% in 2015. This was substantial enough to impede continued access and supply. Also Ghana has occasionally been experiencing harsh weather conditions such as flooding and hydrological droughts at a scale that disrupts continual access for essential services in every nook and corner of the country [13, 14, 16, 40]. With part of the hitch attributed to low water levels in Volta Lake due to climatic variability, the supply of energy to consumers across the country under such conditions resulted in lethargic power distribution, economic loss and periodic interruptions that sent shock waves across the industrial sector. Because both major hydro power plants in the country had been and currently operating far below their capacity. This resulted in energy deficits, which plunged the country into a power rationing exercise from August 2006-09 and 2007. Additionally, during these years, the average domestic demand for electricity also rose at 7% annually due to rapid urbanization and rural electrification ventures nationwide. This in turn accelerated the rising demands that piled up pressures on the sector.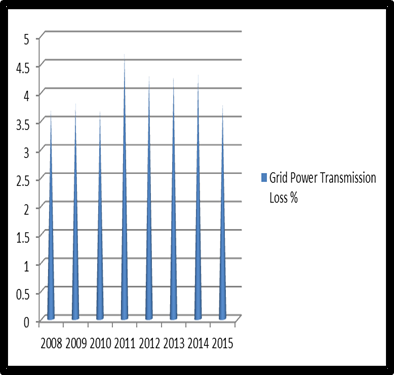 | Figure 15. Grid Power Transmission Line Percentage Declines, 2008-2015 |
3.5. Government Policy Efforts in Ghana
Given the extent and nature of the challenges in place, renewable energy features prominently in Ghana’s long term energy strategy document with a provision of up to 50% partial capital subsidy for renewable energy power systems startups. Part of the initiatives also involves total commitment towards the exploitation of several renewable energy resources like bioenergy, wind, solar and small hydro etc. There is likewise a serious focus on the removal of import duty on renewable energy technology equipment as well as the solicitation of funding from international donors to support local agencies promoting ongoing renewable energy ventures. With that, the government of Ghana is interested in the provision of subsidies to cover initial high costs of renewable energy technologies particularly those located in rural communities, coupled with the introduction of Compact Fluorescent Lamps (CFLs) by utilities for energy efficiency. Such an approach will save approximately 124.2 MW in peak demand while ensuring 429,525 MWh of electricity and the elimination of 150,000 tons of CO2 emissions per annum. Another dimension to governmental efforts stems from a proposed decision aimed at enforcing through legislation an appliance efficiency labeling law for imported energy items and the use of inefficient electricity consuming equipment and appliances. Under broad government policies dedicated to the power sector, Ghana has sought to increase generation from about 2,000 MW to 5,000 MW in 2015 by exploiting thermal and renewable energy technologies followed by a set target of achieving universal electricity access rate by 2020. Aside from a national plan to improve the distribution of infrastructure through efficient service delivery and the reduction of system losses by 18% in 2015, the government has also committed itself to the development of a West African Power Pool (WAPP), where the generation capacities can be expanded among the 16 West African member nations of the ECOWAS.Additionally, while the efforts towards energy security in Ghana involves the commissioning of the largest photovoltaic PV and biggest solar energy complex in Africa, the Nzema project in the country will supply electricity to over 100,000 households [10, 35, 13, 39]. In a nation where many areas take in 5-8 hours of sunlight daily at 1Kw/m2, [18], the authorities have plans to initiate a nationwide roof top solar energy program projected to deliver 200,000 roof tops in the second stage of its power scheme [19]. There is a full pledge towards the production of electricity through wind power given the official goal of the energy sector to generate 10% of Ghana’s energy loads from renewable sources other than hydro by 2020 [40]. In light of that, Ghana maintains about 4-6 wind energy resources and sites along the large wind locales like Nkwanta, the Accra Plains, Kwahu and Gambaga mountains. With such potentials, the maximum power that could be harnessed from Ghana’s existing wind power for electricity now stands at 500-600 GWh/year [40].
4. Discussion
Going by Ghana’s potentials and heavy reliance on renewable resources energy [41], hydropower and electricity generation remain central to its development. With the nation’s yearly electricity demand growth rates estimated at 10%, the quest for renewables has risen so much that it is surpassing the supply levels in the face of teeming population, drought and other elements. Essentially, the challenges are compounded by the recurrent outages and the incapacity of the power operators to meet consumer demands in the last several years. Even though in the last decade and half the country’s output rose with the addition 1,000 MW of thermal generation capacity alongside total installed capacity of 2,884.5 MW, scarce and erratic power supply pose a foremost limitation to future economic progress. For that reason, the paper offered in-depth analysis of renewable energy usage based on a mix scale approach using temporal-spatial techniques of descriptive statistics and GIS based on socio-economic, and energy data at the city and regional levels in Ghana. With Ghana’s major renewables and conventional usage classified along three types made up of electricity generation, biomass and fossil fuel, out of the overall 86,154 GWh in used electric power, the nation experienced an increase in power consumption over time. This occurred in the midst of gradual variations (starting at 7,302-6,411, 7,219-7,542 GWh) between 2006 through 2009. While electricity consumption subsequently showed notable increases annually until 2014, the variations involved initial loads of 9,187 to 10,196 GWh. Just as the nation’s quest for energy resulted in ample usage of petroleum products and biomass materials, Ghana still maintained an average biomass use level (of 2,616 KTEO) that did not surpass the annual supply volume of 3,000 KTEO mark. Additionally, vast use of biomass energy made up of charcoal wood and firewood in the country, grew much of the time with the exceptions of minor variations (2,049.0-2,043.0) all through 2014 to 2015. Considering the recurrent level of demands for renewable energy over the years, the physical presence of critical energy infrastructure scattered around the nation serves a vital purpose. This is evident with the high volume of activities pertaining to electricity generation in the designated plants and the generated capacity within some of them in major locations in Ghana from 2006-2015. In a country where many citizens and businesses still face the discomfort of lethargic power supply. The prospects of augmenting current supply of power by tapping into vast reserves of contemporary energy sources from biomass to solar as shown in the enquiry is not only promising, but it shows an ample manifestation of endowed assets and vast networks of plant sites spread across the country and operating within installed capacities to serve the public. In the context of alternative energy potentials, the supply patterns for the VRA in total installed solar capacity from 2006-2015 out of the overall total 23,549 MW at an average of 2,354 MW in the country bodes well for managers in light of the analysis herein. Given these prospects and the stakes in the regional energy market place, Ghana’s has been active in import and export ventures. For that, the country exported significant loads of electricity power in a decade from 2006-2015. In as much as the most prominent consumers like manufacturing and suburban community surpassed the non-residential and street light corners by 36,681 GWh 25,460 to 11,699-2,923 GWh in electricity power loads. Based on the enquiry, it is clear that the nation of Ghana still saw widespread impacts in electric power fluctuations with policy repercussions over the years (1983-2007) due to power rationing.While the GIS mapping reveals clusters of areas with the presence of renewable energy activities and amenities related to solar and hydro and other indicators scattered throughout Ghana over the years, the issues leading to the declining supply and challenges originate from the different socio-economic, policy, environmental and physical factors located within the larger energy sector and the growing demands. With rising fluctuations as shown in the use of renewable energy variables of electricity demands, capacity of electric power installed, capacity generated, as well as volume consumed, the analytical proficiency of mix scale tools of descriptive statistics and GIS remained overly effective in pinpointing the emerging trends in renewable energy use across Ghana. This entailed taking into account the activities and use levels in electricity generated and consumed, petroleum and biomass distributions, modern energy sources including solar, the import and export of electricity and power use among different consumers. In view of that, the paper highlighted the geographic dispersal of renewable energy indicators and types beginning with the nation’s solar drier facilities, solar radiation levels, and the concentration of hydropower and biomass production amenities. Interestingly, while the regional distribution of the renewables reveals visible presence of solar facilities based on the assigned scale values fully in Northern Ghana, the hydropower infrastructure both current and pending showed more prominence in the South. Applying GIS in that fashion to assess the extent of renewable energy use, the amenity potentials and the distribution patterns regionally and nationwide considering the ecological and socio-economic impacts of their fluctuations on the built environment and the vulnerable communities as well as the challenges from power rationing, outages and drought, enhances our understanding of the essence of energy security. This in turn provides a context for assessing the issue of renewable energy deficits and availability, and consumption levels and the distribution patterns of the indicators over time nationwide. Other points already outlined in the enquiry encompass electricity export and import, other consumers (like residential, industrial users and street lighting component), solar energy, renewable energy oil mills, the various electricity power plants in operation, and countless discomforts associated with erratic supply and imminent losses incurred by households and businesses nationwide. The importance of these indicators remains vital considering the growing level of electricity consumption, among households, the volume of biomass products, and charcoal distribution, electricity generation, the capacity among the operating plants as well as solar and oil mills. This is evident with variations in the distribution volumes. Seeing that the effectiveness of GIS herein stems from its ability in pinpointing the scale and distribution patterns of renewable energy indicators, it was instrumental in showing the regional highlights of solar driers, solar irradiation and hydropower loads, electricity generated, potentials and the capacity of oil mills. The research not only identified present efforts through new schemes to enhance power production and energy security, but it offered solutions to remedy the challenges identified with suggestions ranging from the need for more design of renewable energy infrastructure nationwide to the strengthening of regulations and the promotion of energy efficiency and regular use of spatial information system. See Appendix A for the details of the recommendations.
5. Conclusions
This enquiry analyzed the current level of renewable energy use in Ghana’s electricity sector in an SSA region tagged the new energy frontier with some of the illuminating outcomes listed in the following order. a)energy use on the rise with impacts; b) electricity production trends growing ; c) renewable energy resources in abundance; d) mix-scale model quite proficient in highlighting spatial dispersion of various renewables; e) the fluctuations in energy use linked to many factors.An important finding that arose from this enquiry, which stands also as a significant research contribution, involves information highlights specifying the increasing level of renewable energy consumption as shown from the various indicators in Ghana in the past several years. In the periods of 2006 through 2015, the overall capacity of electricity consumed along with biomass stood at 86,154 GWh and 2,618 KTOE. Of these indicators, while Ghana saw an increased capacity in power use among consumers in the entire nation over the years. The pace of usage continued in back to back fashion in 8 of the 10 years from 2007 -2014 when electricity consumption rose from 6,441 GWh to10,696 GWh despite some fluctuations. Given that electricity power use among various groups (industries, households and nonresidential) in the urban areas from 2011-2015 exceeded the levels in 2006-2010. The yearly growth rate in power use during 2000-2013, shows that the non-residential and residential area consumption levels outgrew industrial users. Another vital point worthy of note in the other renewables stems from the highest consumption levels of 2,792-2,785 KTEO in biomass energy during the periods of 2014-2015 coupled with the wood for charcoal volumes of 17,199.90 KTEO compared to the 15,646.20 KTEO for firewood. The intermittent knowledge significance of these variations in renewable inventories as presented in this enquiry for decision makers’ is that it offers opportunities for assessing the resultant deficits or gains while dealing with public concerns on state of the sector. With renewable energy the engine powering the economic growth in Ghana, the energy sector, regulators and power suppliers will be fully tasked to strengthen production capacities while meeting the rising demands among consumers based on the findings herein. Understanding of these trends in this research remains vital in augmenting renewable energy policy in a nation still battling with growing demands in electricity power supply and other renewables. This does stand out in a decade in which many in Ghana including households, industries and businesses constantly deal with the periodic discomfort of erratic power supply and outages leading to reduced industrial output. Seeing that Ghana’s annual electricity power demands grows at the rate of 10% and the production capacity running further down. Knowledge of such challenges in the daily supply volumes of power for consumers and industries can elevate renewable energy further apart in the arena of public policy in Ghana in accordance with the development aspirations of the country as an emerging economy in the West African region during the 21st century. In developing these indices with the aim of enhancing supply and sustainable use, the research does make a major contribution in a critical area of need. This will ensure a speedy assessment in the presentation of info highlighting (opening and closing accounts) deficits and surpluses in renewable energy use during critical periods. In challenging times, this model can provide decision makers a structure for encouraging energy preservation. As a preamble for gauging consumption levels, the outcome herein is of great benefit to managers in assessing the emerging configuration and their effects nationwide. Keeping policy makers informed of fluctuations patterns in that mode improves their capability to monitor deficits, assess the efficacy of present production, and supply systems in meeting the needs of consumers.The study showed the growing patterns of renewable energy production occurring under a vast network of electricity generation plants and through the export market and others in the country essential to continual access for consumers in Ghana and the neighboring nations in the West African region. With the level of renewable energy challenges faced by industries, consumers and households in Ghana and the central role of electricity power generation evident over the years. The relevance of renewables as the engine for development in the country, which has resulted in growing production, holds promise, even though it still has not completely mitigated energy insecurity in the country. For that, in meeting the mounting needs of the country, during the periods of 2006 through 2015, the overall capacity of electricity generated stood at 103,406 GWh. Of these indicators, even though the total electricity power volume surpassed the usage by 17,252 GWh. The distribution patterns in production in 2007-2009 showed notable surge in volumes (of 6,978- 8,324 and GWh). In the ensuing periods in 2010-2014, the capacity of generated electricity for the country increased by 10,167-11,200 GWh and above the 12,000GWh mark respectively. Further, along those lines, the frequency of electricity power production on the different plants operating in the country during 2006-2015, showed the dominance of Akosombo power facility as the biggest source compared to the others. Amongst these plants, the HG Akosombo facility throughout the entire periods under analysis delivered about 55,688 GWh in overall volumes of generated power. Being the leading source, Akosombo’s power generation production level not only outpaced the capacity within other facilities from Kpong to TICO. However, the (plant) total volumes of 12,153-10,980 GWh for TG TAPCO and TICO surpassed the load levels for TG Kpong at 9,861 GWh. Aside from the known challenges, the nation’s output level in electricity can be further buttressed by the volume of trans-boundary and regional market side of production from 2006-2015. Driven by the robust export demands for trans-border electricity power from its ECOWAS neighbors, under a 10-year span Ghana’s export load of 6,258 GWh exceeded import levels listed as of 2,151.3 GWh. Such activities in turn reaffirm the growing market confidence in local generation capacity necessary for continual investment in the renewable energy sector of Ghana. Bearing in mind the current level of renewable energy sources in Ghana, open information on the production capacity as presented in this enquiry reiterates the importance of yearly display of renewable energy portfolio of Ghana. Being in the West African region currently touted as emergent frontier of energy, highlighting renewable energy profile especially electricity power production crucial in the economic development trajectory of Ghana through its industries, households and consumers remains a major upside for all and sundry. Pointing out these existing capacities in renewables to the advantage of Ghana characterizes new modes of presenting opening and closing physical accounts in energy production. It is so vital in energy planning that access to and scrutiny of them in the context of market stability can lure potential financiers into future ventures in the sector.Displaying the abundance of renewable energy potentials in Ghana in a manner different from other studies does confer some novelty to this enquiry. Fundamentally, the enormous volumes of available energy resources in the nation based on the research are of notable importance in turning all facets of economic development around. Regardless of the challenges linked to access and inability to meet consumer demands over the years, Ghana has ample possibilities to harness its (unknown) potentials of different kinds of renewable energy. For that, looking at it from the temporal distribution, the enquiry revealed that the study area of Ghana has vast abundance of all renewable energy sources, which can be scaled up to fuel economic growth. While these potentials come from the available deposits of modern energy sources such as biomass, solar and wind power devices operating in selected areas of the country. The breakdown of renewable energy endowments of Ghana among the various indicators consists of the distribution levels for VRA in total installed solar power capacity during 2006-2015 estimated at 23,549 MW. With the solar capacity for Ghana’s VRA rising steadily from 1,730 MW-1,970 MW from 2006 to 2009, the Solar PV Systems potential in the country assessed at 1,793 MW covers a wide-ranging level of users located in major urban centers. Of these also, small towns, domestic systems, water pumpage and communication users emerged as major clients. Additional potentials in modern energy biomass revolve around the vast group of plant locations concentrated in the country alongside the installed capacity within them. From the volume of power distribution stored in four biomass plants in the nation in the past, the initial set of two sites (Kwae, Bensia) has sizable volumes of energy in installed capacity (2,500 kW-6.8GWh and 500 kw-19 GWh). That was followed by the loads produced by Twifo and Juaben mills with estimated values of 610 kW, 420kW and average energy value of 2.1-1.9 GWh respectively. In other areas, note also that notwithstanding the presence of 63 identical mini hydropower sites nationwide, there exists 7,736 kW in minimum of kW and 24,505 in potential power kW. The regional distribution indicates that both Volta and the Northern region stayed ahead with more sites (16-18) when compared to the 9-8 sites of hydro power located along the Western and central and upper East and upper West zones of Ghana. From all these, the huge wind energy potentials in the country flow through various scales of moderate to excellent at calibrated points of 3,4,5,6. The assemblage of energy indices in this research not only stands out as a crucial analytical device in decision making that improves the capacity of resource managers to measure the state of renewables and production activities and the potentials. It also provides endless possibilities towards the development of renewable energy index and atlas. The expectation is that this would raise the awareness of the public and the sector in terms of trends and the adoption of efficient measures for achieving access and energy security. Keeping citizens cognizant of these inventories and capabilities in that mode creates an arena for disseminating emerging ideas on renewable energy potentials in decision making at the national level.The use of mix scale method as analytical tool remained quite effective. Using descriptive statistics and GIS as working techniques ushered profound ways of understanding the analysis of renewable energy trends in the country. The model was very effective in delineating the study area and recognizing the patterns, coupled with the compilation of information on factors, socio-economic variables and various energy indicators from electric power generation to biomass, solar and hydro. With the analysis pointing to noticeable concentration in clusters of areas with growing presence of modern energy indicators including solar driers and solar radiation on varying scales alongside hydro power potentials and power transmission networks over the years. The method emerged as an indispensable device that would be assisting researchers tasked with analysing the geographic scopes of renewable energy use in Ghana. Consequently, GIS as analytical and planning tool showed its versatility and proficiency in pinpointing the diffusion of renewable energy indicators and the pace and scale of their progression across space. This upside epitomizes a substantial step towards efficient management and improvements in existing policy that is yet to explore such capabilities. Judging from the research, Ghana saw visible patterns highlighting scales, site locations, the operating capacities of respective power facilities from solar to hydro and others coupled with the spatial concentration of renewable energy amenities, the potentials and the forms since 2002. While these patterns are indicative of the continual evolution of energy trends and the scales, their occurrence may not have emerged in isolation. With time, the GIS mappings identified spatial patterns highlighting facility presence, capacity, potential projects, distribution network and usage over the years. The capability of GIS in pinpointing the forms of usage and infrastructure presence and potentials over the years is vital considering the significance of renewable energy in the development trajectory of Ghana in a region currently branded as emerging energy frontier in Sub Saharan Africa. Locating these potentials augments the proficiency of managers, multilateral organizations, the sector and the ECOWAS region in ranking renewable energy as an essential dimension of future planning and policy. In so doing, the model offers valuable prospects for highlighting the potentials of untapped renewables long ignored in the policy domain.As a result, the practical use of a mix scale methodology comprising of GIS mapping of energy use and amenities as a device, increases our knowledge of the state of the renewable energy industry in the existing literature. While this is essential in the design of energy index and atlas, it improves policymaking capabilities among planners associated with shaping the contours of emergent discourses, the directions and market opportunities in Ghana’s energy sector.The present changes in renewable energy use in Ghana as presented in this study does not occur in isolation, they are linked to policy, socio-economic, and physical factors located inside the larger energy structure of the country. Even though this enquiry reiterated the importance of various socio-economic elements germane to the nation’s renewable energy sources, it also shows the extent to which the daily requirements of various sectors such as health, economy; urban infrastructure, households and others rely on the renewable energy industry. Just as effective policy and regulatory instruments have great importance in the delivery and fulfillment of the objectives of government programs. The research revealed the significance of efficient and probably laid out regulatory framework and common standards in the implementation of national energy policy in Ghana. With the limited observance of coherent standards in energy policy implementation, the nation’s policy has not been effective enough to move the sector forward in the midst of volatilities encountered in the last several years. Under the anomalies entrenched in the nation’s weak energy policies, there are separate tariffs set as aside for businesses and households while the backlog of unpaid subsidies owned by government to distributors continues to affect supply. The challenges are made worse by the growing demand for electricity over the years, at levels exceeding the capacity of the nation’s energy sources, coupled with the pressures from teeming population and climatic variability leading to drought and depth fluctuations in major rivers in the country hampering the capacity of hydropower flows. Emphasizing these linkages considering their exclusion in the literature, did insert factors situated in the larger renewable energy sector onto the center of deliberations on energy resources and security in Ghana. In their absence, understanding the influence of various elements in renewable energy access among communities in Ghana could have been quite arduous. Therefore, in presenting the socio-economic, policy and physical and environmental factors influencing renewable energy trends in the country, the research identified modes of showing these components as road maps for boosting our knowledge of the potentials and issues. Managers in that circumstance are accorded the possibility to assess these characteristics over time by evaluating their significance in energy security and use in the country.Bearing in mind the increasing energy needs of the country, its growing potentials, and the issues hindering energy security and what came out of the enquiry, decision makers and managers in Ghana will be hard pressed in the near future to elicit immediate answers to several demanding queries that are pertinent to renewable energy planning. The questions consist of which other problems are likely to surface from renewable energy production? What factors can influence the temporal-spatial patterns of electricity power supply? What forms will the regional dimensions of renewable energy amenities take in the country? How would future policies shape the directions of the energy sector? From the design of these queries, there are abundant opportunities in all of them for researchers and decision makers to refocus the approach on national and regional trends in renewables in Ghana.
Appendix
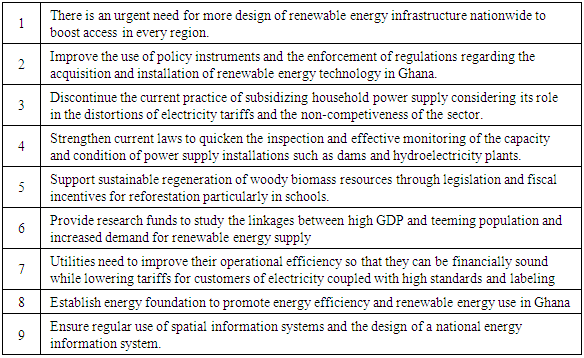
4.1. Recommendations Table 9. Suggestions for Future Lines of Actions
 |
| |
|
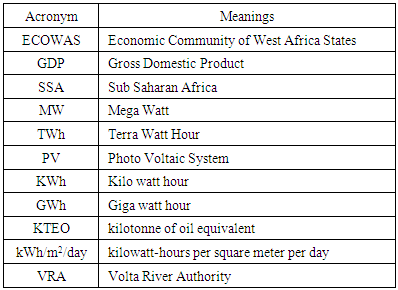
Acronym
References
| [1] | Eshun, M. (2016). A Review of the Trends In Ghana’s Power Sector. Energy Sustainability and Society. 6:9; 1-18 2-18. |
| [2] | Merem, E. C. (2017a). Regional Assessment of Energy Trends in West Africa Using GIS. International Journal of Energy Engineering. 7:1: 1-27. |
| [3] | Ouedraogo, N. (2012 March). Energy Consumption and Economic Growth; Evidence from the Economic Community of West African States. ECOWAS. Energy Economics. 36:637-647. |
| [4] | Ghana Investment Promotion Center. (GIPC). (2016). Energy Infrastructure. 1-2. Retrieved on 18th December 2017 From. http;www.pipcghana.com/invest-in-Ghana/why-ghana/infrastructure/energy-infrastructure.html. |
| [5] | Ahiataku-Togbo, W. (2006). Hydro Power Development in Ghana. Accra, Ghana: Ghana Ministry of Energy. |
| [6] | Proeexca in Spanish (2011). The Sector of Electricity in Ghana. Canary Island. Retrieved On 23th April 2013. |
| [7] | The World Bank Group. (2013). Consumption of Electrical Energy kWh per Capita. World Bank. Retrieved On 23th April 2013. |
| [8] | Merem, E. C. (2017, March b). Analyzing Renewable Energy Use in Ghana: the Case of the Electricity Sector. Proceedings. Race, Gender and Class Conference. New Orleans, LA. |
| [9] | Pearce, F. (2013 May). Will Huge New Hydro Projects Bring Power to Africa’s People. Yale Environment. 360.1-7. |
| [10] | Blue Energy. (2015). Africa’s Largest Solar (PV) Power Plant. Blue Energy, Cheshire UK. Retrieved on 18th December 2017 From http://www.blue-energyco.com/africas-largest-solar-pv-power-plant/. |
| [11] | Energy Ghana (2014 June). Delighting Ghanaians, the State of Ghana’s Power Sector. Energy Ghana. Retrieved on 17th December 2017 from http://www.energyghana.com/post.php?508c75c8507a2ae5223dfd2faeb98122=2014061219. / 1-5. |
| [12] | International Energy Agency and IRENA. (2012). National Electrification Scheme Global Renewable Energy; Ghana National Energy Policy. IEA/IRENA Joint Policies and Measures Data Base. Abu Dhabi, United Arab Emirates: IEA/IRENA. |
| [13] | Bekoe, E.O. (2013). The Impacts of Droughts and Climate Change on Electricity Generation in Ghana. Environmental Sciences 1:1:13-24. |
| [14] | Kodina, A. (2007 August). Hydro Power Crisis Getting Worse. 1-6. IRIN Association. Retrieved On 17th December 2017 http://www.irinnews.org/news/2007/08/03/hydro-power-crisis-getting-worse, Geneva, Switzerland. |
| [15] | French, H. (1994 September). Drought Cuts Hydropower In Ghana. New York Times. Retrieved On 17th December 2016. From http://www.nytimes.com/1994/09/16/world/drought-cuts-hydropower-in-ghana.html. |
| [16] | Miescher, S. (2009/2010). Hydro Power and the Promise of Modernity and Development in Ghana; Comparing the Akosombo and Bui Dam Projects. Ghana Studies 12:13:15-53. |
| [17] | Resource Center for Energy Economics and Regulation (RECEER). (2005 July). Guide to Electric Power in Ghana. Legon, Accra: Institute of Statistical, Social and Economic Research, University of Ghana Legon, 1-56. |
| [18] | Gymfi, S. (2016). Improving Electricity Supply Security in Ghana the Potential of Renewable Energy. Sunyuni, Ghana: The University of Energy and Natural Resources (UNER), 1-7. |
| [19] | Dasmani, L. (2016 March). Ghana Seeks 3,000 MW Power Generation Capacity by 2020. West Africa. The Africa Report 1-4. Retrieved on December 19th 2017. From https://0x9.me/tCMdp. |
| [20] | Kpekpena, J. (2015 May). Status of Clean Energy Development Programs in Ghana. Presented at Global Workshop on Clean Energy Development, Washington, DC: USA. |
| [21] | International Energy Agency/IRENA. (2014). Global Renewable Energy; Ghana National Energy Policy. IEA/IRENA Joint Policies and Measures Data Base. Abu Dhabi, United Arab Emirates: IEA/IRENA. |
| [22] | Merem, E.C. (2016a). Regional Assessment of Energy Trends in West Africa. Proceedings of the 13th International Symposium on the Recent Advances in Environmental Health. Jackson, MS. |
| [23] | Merem, E. C. (2016b). The Geography of Wind Energy Use in the Mid-West Region of the US. Journal of Energy and Power. 6:1: 1-15. |
| [24] | Merem, E. C. (2011). Environmental Accounting for Oil and Natural Gas a North American Case Study. New York, NY: Edwin Mellen Press. |
| [25] | Merem, E. C. (2007). GIS Applications in Global Environmental Protection: The Case of Environmental Monitoring of Fossil Fuel Emission From Oil and Gas Activities in Africa. World Resources Review. 19:3: 657-680. |
| [26] | Merem, E. C. (2017c). Assessing the Ecological Effects of Mining in West Africa: The Case of Nigeria. International Journal of Mining Engineering and Mineral Processing. 6:1: 1-19. |
| [27] | Merem, E. C. (2017). Assessing Ecosystem Liabilities of Oil and Gas Activities in Southern Nigeria. Public Health Research. 7:1: 3-26. |
| [28] | Merem, E. C. (2010). Using GIS in Environmental management: Green assessment of the impacts of petroleum activities in the state of Texas. International Journal of Environmental Research and Public Health. 7:5: 2101-2130. |
| [29] | Volta River Authority (VRA). (2016 a). Profile of The Volta River Authority. Accra, Ghana: VRA 1-3. Retrieved on 19th December 2017. From http://www.vra.com/about_us/index.php. |
| [30] | Volta River Authority. (VRA). (2016 b). Power Generation Facts and Figures. Accra Ghana. Retrieved on 19th December 2017 From http://vra.com/resources/facts.php. |
| [31] | PV Magazine. (2015). Solar to Play Key Role in Ghanas US $230 million renewable Energy Program. Retrieved on 19th December 2017 From https://0x9.me/9J0zK. |
| [32] | Asente, F. (2007 July). Ghana’s Electricity Industry. ESI Magazine. Ghana’s Electricity Industry Retrieved on 19th December 2016 From https://www.esi-africa.com/news/ghana-s-electricity-industry/. |
| [33] | Mahu, S. (2012 April). Opportunities In The Ghana Renewable Energy Act 2011 (Act 832). Accra, Ghana: Ghana Ministry of Energy, 1-29. |
| [34] | Mbendi Information Services. (2016). Electrical Power In Ghana Overview. Retrieved on 19th December 2016 From http://www.mbendi.com/indy/powr/af/gh/p0005.htm. |
| [35] | Ware, G. (2013 May). Solar Solutions in Ghana. Retrieved on 19th December 2016 From http://www.theafricareport.com/West-Africa/solar-solution-in-ghana.html. |
| [36] | World Rivers Review. (2001 August). Bui Dam Ghana. International Rivers. Berkeley, CA: 1-2. Retrieved on 19th December 2016 From https://www.internationalrivers.org/resources/bui-dam-ghana-3608. |
| [37] | Ghana Statistical Services. (2015). National Population Census. Accra, Ghana: Ghana Statistical Services. |
| [38] | Energy Commission of Ghana. (2016). National Energy Statistics 2006-2015. Strategic Planning Division, Accra, Ghana: Energy Commission of Ghana. |
| [39] | Adam, Vaughn. (2012 December). Africa’s Largest Power Plan to Be Built In Ghana. The Guardian London Retrieved On 23th April 2013. |
| [40] | Arakis Group. (2013). Renewable Energy –What is Ghana’s Wind Power Potential. Retrieved On 23th April 2013. |
| [41] | International Renewable Energy Agency. (2015 Nov). Ghana Renewables Readiness Assessment. 1-60. Retrieved on 19th December 2017. http://www.irena.org/DocumentDownloads/Publications/IRENA_RRA_Ghana_Nov_2015.pdf. |

 Abstract
 Reference
 Full-Text PDF
 Full-text HTML