A. Guwaeder, R. Ramakumar
Electrical and Computer Engineering, Oklahoma State University, Stillwater, USA
Correspondence to: A. Guwaeder, Electrical and Computer Engineering, Oklahoma State University, Stillwater, USA.
| Email: |  |
Copyright © 2017 Scientific & Academic Publishing. All Rights Reserved.
This work is licensed under the Creative Commons Attribution International License (CC BY).
http://creativecommons.org/licenses/by/4.0/

Abstract
Recent significant downtrend in the cost of photovoltaic (PV) modules has accelerated their deployment around the world on a large scale. This paper presents a study of some of the potential impacts of the entry of grid-connected PV on the Libyan power system. Further, it also presents a brief description of the Libyan power system with its past and current state of generation and transmissions infrastructure and potential solar power plans.
Keywords:
PV, Solar radiation, Fossil fuel power plants, Libyan power system
Cite this paper: A. Guwaeder, R. Ramakumar, A Study of Grid-connected Photovoltaics in the Libyan Power System, Energy and Power, Vol. 7 No. 2, 2017, pp. 41-49. doi: 10.5923/j.ep.20170702.02.
1. Introduction
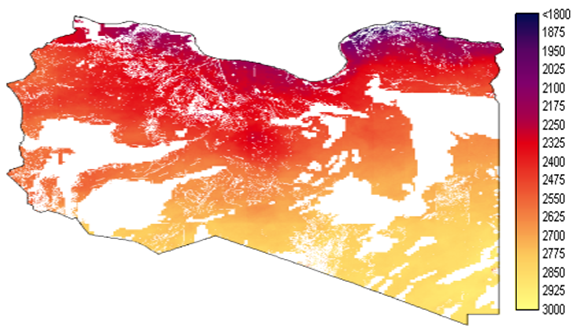
Global interest in curbing greenhouse gas emissions, especially carbon dioxide, is on the rise as exhibited by the unprecedented accord arrived in Paris in December 2015 by 196 delegates from all around the world, known as COP 21. The goal was to take measures to limit average warming to no more than 2 degrees Celsius above pre-industrial temperatures, with a desire to strive for 1.5 degrees Celsius if possible.Libya, a North African country, has significant potential for harnessing solar energy. In the coastal regions, the daily average solar radiation on a horizontal plane on an average is 7.1 kWh/m2/day and in the southern region, it is 8.1 kWh/m2/day as shown in Figure 1 (CIA, 2016). According to Libyan renewable energy authority, the average duration of sunlight is more than 3,000 hours per year as shown in Figure 2. This is equivalent to a layer of 25 cm of crude oil per year on the land surface (Saleh, 2006).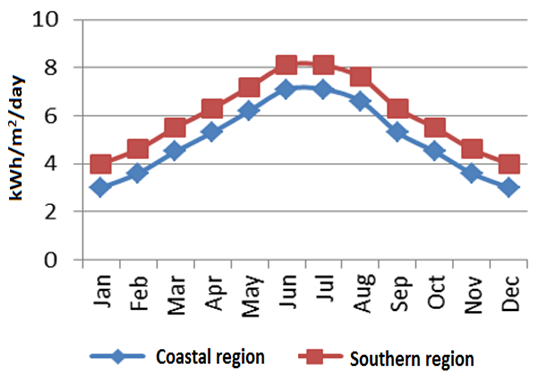 | Figure 1. The average monthly Daily global radiation on a horizontal surface (Trieb, 2011) |
 | Figure 2. The average global radiation on the horizontal plane (Trieb, 2011) |
Moreover, outputs of PV system can vary slowly or rapidly depending on climate conditions such as cloud cover, squall lines, etc. As a first step, grid-connected PV systems can be considered as negative load because of its uncontrollable features. Ultimately, economics will play a significant role in determining the viability of adding large-scale PV in the Libyan system. However, economic considerations should incorporate the positive elements of reducing carbon dioxide emissions on a local and global scale. With this background and limited literature we discuss the large-scale entry of PV in the Libyan power system. Techno-economics feasibility of introducing large-scale grid-connected PV power plants (PV MODEL) into the Libyan power system and the impact on the reduction of carbon dioxide emissions as it replaces to some extent conventional power plants are also presented.
1.1. Site Characteristics
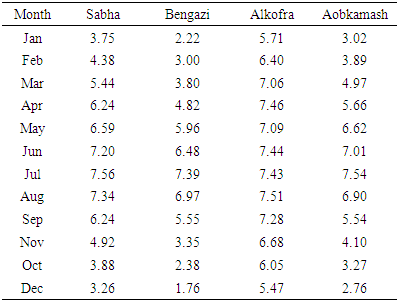
Libya is a crude oil exporting nation and the second largest North African country with an area of 1,759,540 square km and located around Mediterranean Sea with about 1900 km of coastline and 6 million inhabitants. Almost a hundred percent of its territory is land area. Libya has virtually no accessible water resources on the earth's surface, consisting of more than 90% of desert or semi-desert (CIA, 2016). Libyan climate ranges from Mediterranean along the coast line to extremely dry in the interior towards south. Most prominent natural resources are petroleum and natural gas and these resources are the main driving factors for the Libyan economy. It is also due to the abundant fossil resources that Libya has always enjoyed a fairly high international interest and relevance (CIA, 2016). Libya's economy is dominated by the oil sector, around 95% of export revenues is generated by the energy sector. In terms of solar energy, it could be argued that solar energy is the most important renewable energy resource, as Libya enjoys a high level of insolation. Solar energy is considered to be one of the main resources due to the location of Libya on the cancer orbit line with exposure to the sun’s rays throughout the year and with long hours during the day, Table 1 shows the Average monthly solar radiation values kWh/m2/day in four Libyan locations. Table 1. Average monthly solar radiation values kWh/m2/day in four Libyan locations (CSERS, 2009)
 |
| |
|
1.2. Renewable Energy Resources
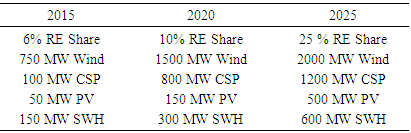
The advantage of utilizing both renewable and traditional energy sources is that the deficiency in one source can be filled by the other one in a normal or controlled mode. Renewable energy cannot be dependable universally due to its variable nature. Integration of renewables will decrease the overall reliability of the hybrid system. Conventional sources integrated with renewable sources will result in compensation of the weaknesses of renewable sources. In order to reduce its dependence on fossil fuels and to promote renewables, the Renewable Energy Authority of Libya has established targets up to 2030. Long-term plans are to meet 25% of Libya’s energy supply by renewable energies by the year 2025 and rising to 30% by 2030 (REAL, 2016). Intermediate targets are 6% by 2015 and 10% by 2020 as shown in Table 2.Table 2. Renewable energy share
 |
| |
|
1.3. PV Application in Libya
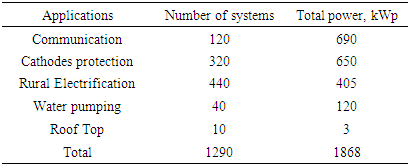
Photovoltaic conversion of insulation is a well established technology. Libya is one of the developing countries in which PV was first put into operation in 1976 to supply electric power. The total installed capacity of PV was only 5 MW in 2012 (RCREEE, 2016). Small PV projects have been in operation since 1976 in Libya. At first, solar systems were used to supply cathodic protection for the oil pipelines. Later, in 1980, a PV system was used in the communications sector to supply power to the microwave repeater station near Zalla. By 2006, 120 stations supplied by PV in the field of communications have been established in Libya. By the end of the year 2005, the total installed photovoltaic peak power was around 690 kWp (Saleh, 2006). In 2012, it rose to 950 kWp (RCREEE, 2016). By 2012 the total capacity of PV water pumping system was 120 kWp (RCREEE, 2016), as shown in Table 3.Table 3. Total installed PV capacity in Libya in 2006
 |
| |
|
The use of PV systems for rural electrification in Libya was initiated in 2003. By 2006, the total number of remote systems installed by General Electric Company of Libya GECOL reached 440 with a total capacity of 405 kWp. In 2012, rural electrification PV systems in Libya had an aggregated capacity of 725 kWp (Saleh, 2006). The Renewable Energy Authority of Libya is planning to implement a grid connected 14 MW photovoltaic power plant near the town Hun in Libya, a 40 MW project in Sabha, and a 15 MW power station in Ghat.
1.4. Electricity Grid
The Libyan national electric grid consists of a high voltage network of about 12,000 km, a medium voltage network of about 12,500 km and 7,000 km of low voltage network. Some villages and remote areas which are located far away from these networks cannot be connected to the grid due to economic reasons. Those locations with small populations and a small amount of energy demand use diesel generators as a power supply, requiring regular maintenance and supply of fuel (Saleh, 2006). There is an operating grid interconnection at 220 kV voltage level to Egypt with a capacity of 240 MW which is 180 km long and the interconnection between Libya and Tunisia was completed in 2009, also at the 220 kV level (RCREEE, 2016). Figure 3 Shows the Libyan national grid at 220 kV and 400 kV levels.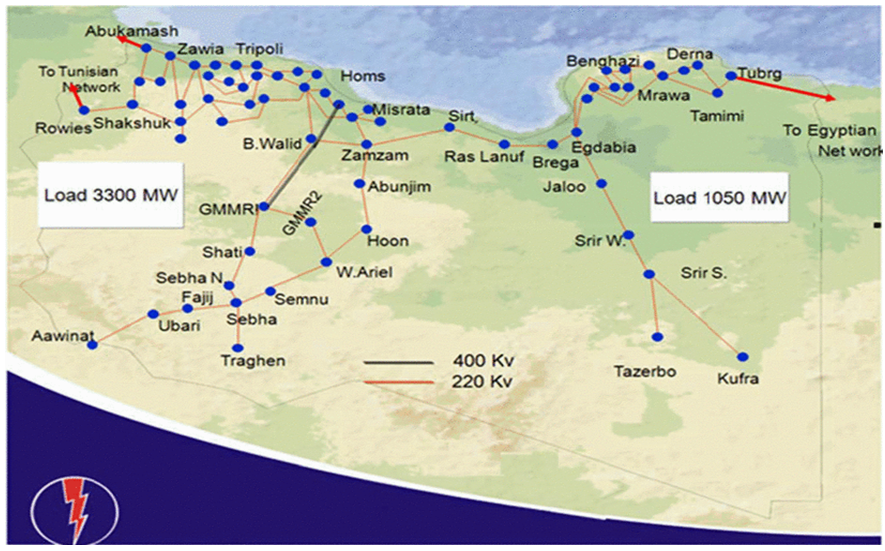 | Figure 3. Libyan national grid (220 & 400 kV) (Patel, 2006) |
2. Methodology
2.1. Electricity Demand
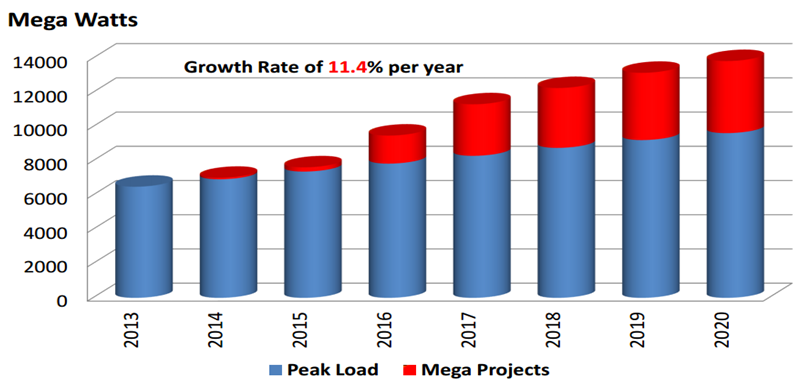
Due to high economic growth and greater investment in the oil and natural gas sectors, electricity generation almost doubled from 2003 to 2012. The peak load increased from 5,282 MW in 2009 to 5,981 MW in 2012 as shown in Figure 4 (Patel, 2006). Figure 5 shows the load growth from 2013-2020, during which the total installed generated capacity increased to 8907 MW (GECL, 2010). Despite growth in electricity generation and a high electrification rate, the country suffers from regular outages and the oil sector is also affected by power supply issues.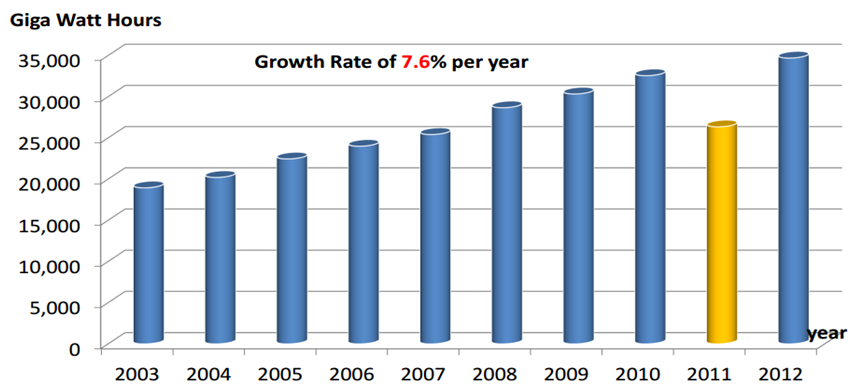 | Figure 4. The peak load growth within 2003–2012 shows an increase of 6.7% per year (GECOL, 2010) |
 | Figure 5. Load growth within 2013 – 2020 (GECOL, 2010) |
2.2. Electricity Consumption
In 2012, electricity consumption in Libya aggregated to 32.96 TWh, this corresponds to 4,850 kWh per capita compared to only 2,650 kWh in the year 2000 as shown in Figure 6 (GECL, 2010). Most of the electric power network is concentrated in the coast, where most of the inhabitants live. Figure 5 shows the electricity per-capita consumption in Libya (IEA, 2011). For the region of Alkofra the electricity consumption per capita is about 3.59 kWh.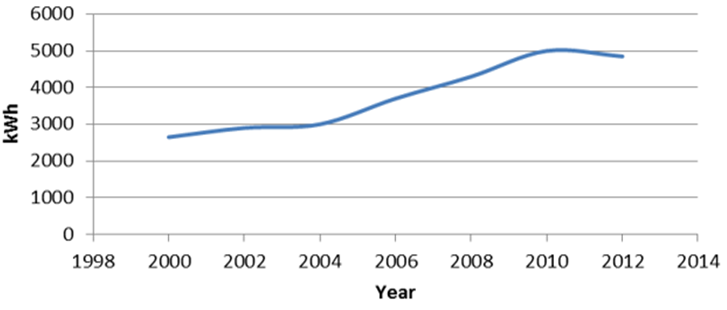 | Figure 6. Electrical power per–capita consumption of Libya (GECOL, 2010) |
2.3. Enviromental Effects
The major emitters of CO2 in Libya, as shown in Figure 7, are fossil fuel burning power plants at 40%, in the transport 22%, and in manufacturing 10% and all others combined 28%. Carbon emission from petroleum products stand at 58% and from natural gas 42% (Patel, 2006). Increasing dependence on natural gas will lead to less carbon emissions. Libya‘s contribution regarding CO2 emissions has increased due to growth in energy sector over the years.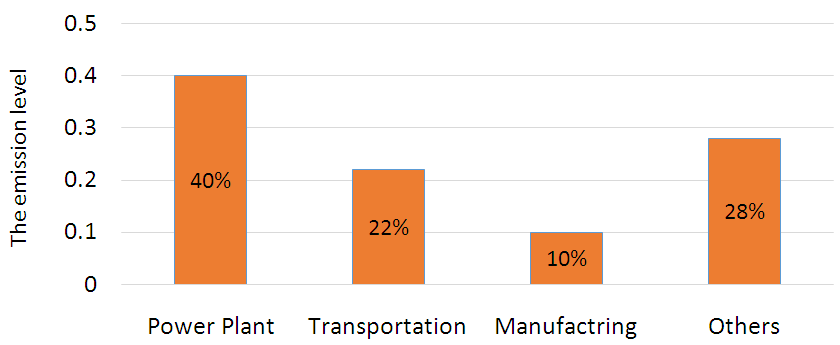 | Figure 7. CO2 emission by sectors in Libya (GECOL, 2010) |
Continued combustion of fossil fuels for power generation leads to very high environmental pollution and global warming problems since currently more than 70% of the power is generated using fossil fuels. Fast depletion of traditional fuels with limited resources is another matter of concern about growing energy demand. Development of renewable energy is promoted as a green solution in some developing countries such as Libya with the aim of mitigating emission issues and satisfying upcoming energy demand. Recently renewables accounted for 15–20% of the world’s total energy needs (Eltawil & Zhao, 2010). Libya is taking steps towards major actions in the country such as approving the Kyoto protocol to the UN convention on climate change and having a target of achieving 10% renewable energy power generation by 2020. One possible approach in Libya is employ smart integrated renewable energy systems (SIRES) (Maheshwari & Ramakumar, 2017).
2.4. Baseline Model
The developed countries have supplied electric power generated in large centralized plants transforming and transmitting at high voltages to regional consumers, step it down to distribute it locally and deliver it to customers as seen in Figure 8. A combination of electricity generation by means of PV, used to replace some amount of electricity where conventional energy sources are expensive or rarely available, is expected to improve the prospects for harnessing the free and clean solar energy in an economical way. The integration of these items together can reduce the overall heat rate of the entire generation system significantly. This would reduce the cost of the generated electricity compared with what can be achieved with stand-alone conventional units. In addition, lower rates of emissions per unit of electricity produced would be beneficial to the environment. Direct generation of power from fossil fuel fired power plant has several negative effects on the environment since CO2 emissions contribute to greenhouse effect.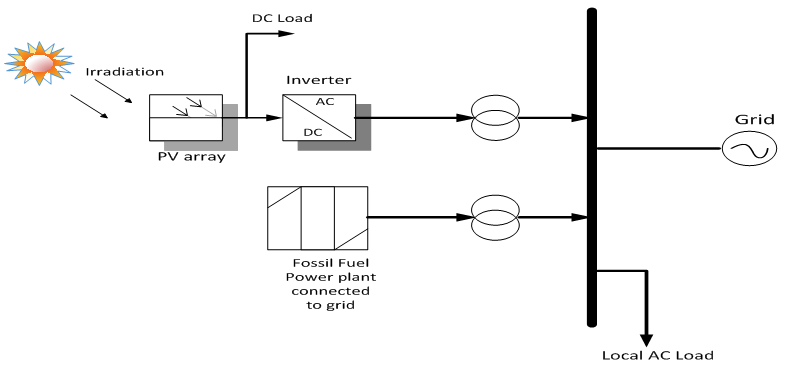 | Figure 8. Hybrid Photovoltaic and fossil fuel system |
2.5. PV Model
The model employed in this paper is developed using Power World Simulator. It is a Windows based software that has been developed by the Power World Corporation at Champaign, Illinois, USA. The software is an interactive power system simulation package designed to simulate high-voltage power system operation on time scales ranging from several minutes to several days and contains a highly effective power flow analysis package capable of efficiently handling systems of up to 250,000 buses.This system consists of photovoltaic (PV) power plants to generate clean electricity by using solar energy, incorporated with fossil fuel power plants and feed-in the generated electricity into the grid to supply the growing peak demand of customers as shown in Figure 8. The random variable solar irradiance can be modeled using the Beta probability density function (Z. M. Salameh, June 1995). The probability density function for solar irradiance can be expressed as follows: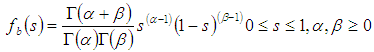 | (1) |
where  is the Beta distribution function of s, and s is the random variable of solar irradiance in kW/m2,
  and
and  are parameters of
  which can be found using the mean (µ) and standard deviation (σ) as follows:
 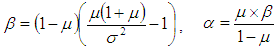 | (2) |
The output power from the PV module is dependent on the solar irradiance and ambient temperature of the site (J. H. Teng 2013):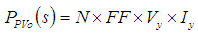 | (3) |
Where N is the number of modules and FF is the fill factor given as: 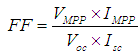 | (4) |
In which VOC and ISC are the open circuit voltage and short circuit current of the module and VMPP and IMPP are the voltage and current corresponding to the maximum power point.Also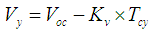 | (5) |
and  | (6) |
 | (7) |
Where Tcy and TA are cell and ambient temperatures respectively, Ki and Kv are current and voltages temperatures coefficients respectively, NOT is the nominal operating temperature of a cell. The capacity factor of a PV module can be defined as the average output power divided by the rated power as expressed (Y. M. Atwa 2010):  | (8) |
3. Results and Discussion
3.1. Technical Analysis
Simulation results obtained using the power world simulator and the Newton Raphson approach are summarized in this section. The buses used in power world simulator were classified as generation bus, load bus and slack bus. The system under study shown in Figure 9 is a typical distribution system and it displays the model of a sample twelve –bus network built using the power world simulation. The information consists of bus voltages for every node assumed to be within the acceptable range between 0.95 and 1.05 per unit. Bus 1 is considered as the slack bus, buses 2, 3, 4, 5, 6, 8, 9, 10, 11, and 13 are load buses. The system has a total active and reactive power load of 173.54 MW and 84.08 MVAR respectively. The generator at bus one generates 182.51 MW and the transmission lines connected between buses are shown in the block diagram. The generators real and reactive power are assumed to vary within certain limits to meet a particular load demand with minimum fuel cost based on Optimum Power Flow (OPF). Optimal power flow plays an important role in power system operations and planning, under normal operating condition, OPF is used to determine the load flow solution, which satisfies the system operating limits with minimum the generation costs.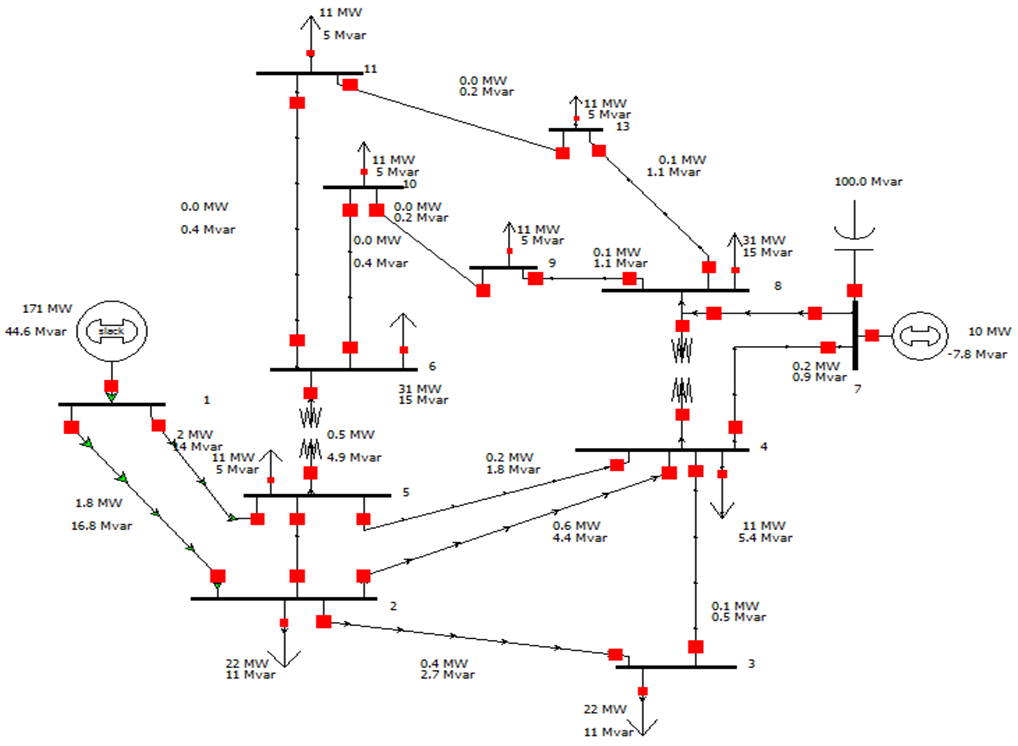 | Figure 9. Proposed PV Model consisting ten substations and one existing power generation station |
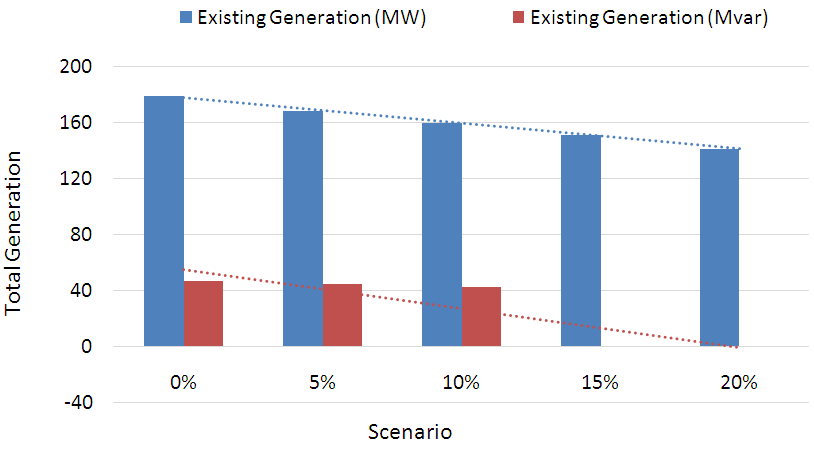
Distributed photovoltaic generation dispersed throughout the network supplies the power demanded by the load. Varying percentages of photovoltaic penetration level are considered in this study using power world simulator to simulate the system. A power flow analysis is run for each of the scenarios. Evaluation of the performance of the proposed system is done by comparing every scenario with the base scenario (with no PV) in terms of total losses and total generation and the results of the simulation are illustrated in Figure 10 and 11.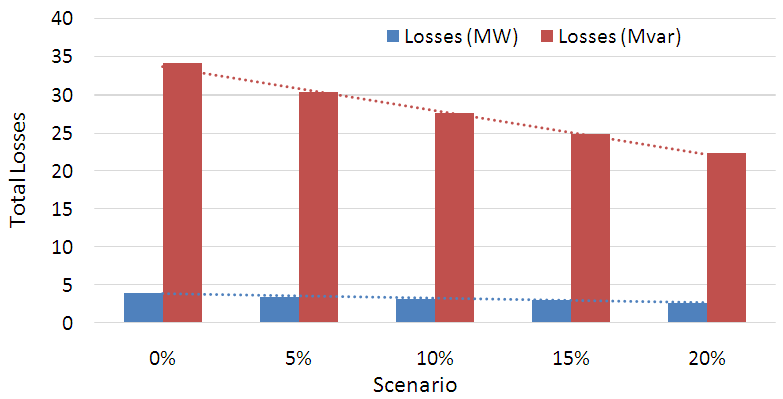 | Figure 10. Total losses of the system for different scenarios |
 | Figure 11. Total existing generation for different scenarios |
To evaluate the impact of PV penetration, the following scenarios are considered:Scenario 1: A PV of 5% (10 MW).Scenario 2: A PV of 10% (18 MW).Scenario 3: A PV of 15% (27 MW).Scenario 4: A PV of 20% (36 MW).In each case the PV system is assumed to be at bus 7 as shown in Figure 9. Compared to the base scenario, the PV Model resulted in a reduction of total existing generation from 178.51 MW to 167.91 MW, 159.71 MW, 150.61 MW, and 141.11 MW for the scenario of 1, 2, 3, and 4, respectively, as shown in Figure 11. In addition, Figure 10 also shows the total losses obtained from the simulation of the system, which decreased from 4.0 MW to 3.4 MW, 3.2 MW, 3.1 MW and 2.1 MW for the scenario of 1, 2, 3 and 4 respectively.
3.2. Cost-benefit Analysis
The primary advantage of renewable energy is the absence of fossil fuel cost and uncertainties in conventional fossil fuel cost makes this technology attractive. Moreover, PV has low operation and maintenance cost as compared to other traditional technologies. It is a solid-state power plant, which is easy to install and expand, and has the potential for long lifetime of over 20 years. PV systems operate with no pollution and high reliability. These advantages make them suitable for remote or isolated locations. PV has a few disadvantages also, such as high initial cost and low conversion efficiency. With a capital cost of 4,183 USD/kWp and Operational and Maintenance (O&M) cost of 27.75 USD/kw-year (EIA, 2013), PV can reduce the system losses, as depicted in Figure 11, and creates some financial benefits. Corresponding to a PV capital and O&M cost of 4,183 USD/kWp and 27.75 USD/kW-year, the average electricity price of 0.5 USD/kWh, the natural gas price of 4.0 USD/MMBtu, the annual PV operating hours (solar availability) of 2,628 hours, the combined cycle power plant (CCPP) heat rate of 8,500 Btu/kWh, the payback period of the PV system is approximately 2.3 years. Figure 12 shows the cost-benefit analysis of PV model, based on scenarios of 1-4.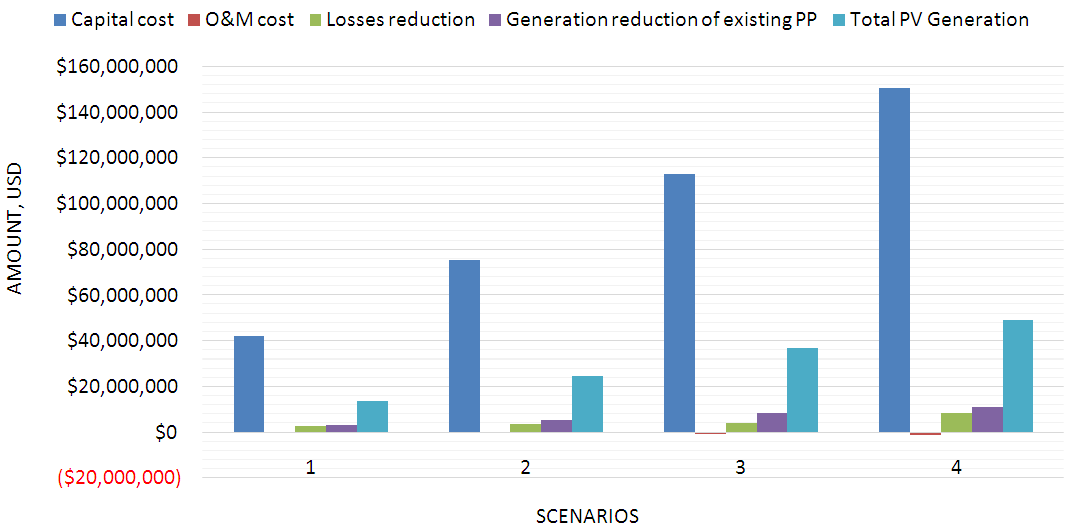 | Figure 12. The cost-benefit analysis of PV Model based on scenario of 1-4 |
4. Concluding Remarks
A detailed study of grid-connected photovoltaics in the Libyan power system will be very useful for those interested in the massive dynamic of PV economics, as most of the companies can increase their revenues and/or lower their cost. It has been found that photovoltaics could provide an alternative source of energy and provide an opportunity to generate financial profits as well as decrease the consumption levels of oil and natural gas. In addition, it has been found that energy demand is increasing in Libya and that PV could be the solution to cover some of this demand without the need to build new fossil fuel power plant stations due to the high availability of insolation amounting to about 8.1 kWh/m2/day. The effect of integrating solar distributed generation into the grid resulted in a reduction of total amount of power generated by existing generation in the network. However, losses obtained differ for the different scenarios, from 4.0 MW (scenario 1) to 2.1 MW (scenario 4). The results obtained on a 12 bus test distribution system indicated additional benefits with impacts on decision-making on integrating PV units into the power system. Inclusion of these benefits in the study can lead to faster investment recovery with a high benefit cost ratio and a short payback period.
ACKNOWLEDGMENTS
This work was supported by the Engineering Energy Laboratory, Oklahoma State University, Stillwater, Oklahoma and the PSO/Albrecht Naeter Professorship in the School of Electrical and Computer Engineering.
References
| [1] | CIA. (2016). The World Factbook. Washington D.C: Central Intelligence Agency. Retrieved from https://www.cia.gov/library/publications/the-world-factbook/geos/ly.html. |
| [2] | CSERS. (2009). Tripoli: Centre for Solar Energy Research and Studies of Libya. |
| [3] | EIA. (2013). Updated Capital Cost Estimates for Utility Scale Electricity Generating Plants. Washington D.C: US Energy Information Administration. Retrieved from https://www.eia.gov/outlooks/capitalcost/pdf/updated_capcost.pdf. |
| [4] | Eltawil, M., & Zhao, Z. (2010). Grid-connected photovoltaic power systems: Technical and potential problems-A review. Renewable and Sustainable Energy Reviews, 14. |
| [5] | GECOL. (2010). General Electric Company of Libya. Tripoli: General Electrical Company of Libya. Retrieved from https://0x9.me/SIXP5. |
| [6] | IEA. (2011). Indicators in Libya 2011. Paris: International Energy Agency. Retrieved from http://www.iea.org/statistics/statisticssearch/report/?country=LIBYAnproduct=indicatorsyear=2011. |
| [7] | J. H. Teng, S. W. (2013, May). Optimal charging/discharging scheduling of battery storage system for distribution systems interconnected with sizeable PV generation system. IEEE Trans. Power System, 28, 1425-1433. |
| [8] | Maheshwari, Z., & Ramakumar, R. (2017). Smart Integrated Renewable Energy Systems (SIRES): A Novel Approach for Sustainable Development. energies, 10(8), 1145. |
| [9] | Patel, M. (2006). Wind and solar power systems: design, analysis, and operation (2nd ed.). Florida: CRC. Retrieved from http://www.fanarco.net/books/misc/Wind_and_power_Solar_System.pdf. |
| [10] | RCREEE. (2016). Provision of Technical Support/Services for an Economical, Technological and Environmental Impact Assessment of National Regulations and Incentives Renewable Energy and Energy Efficiency. RCREEE. Retrieved from http://www.rcreee.org/. |
| [11] | REAOL. (2012). Renewable Energy in Libya (The Future Prospectives). Amman: Arab Union of Electricity. Retrieved from auptde.org/Article_Files/Mohamad%20Zrouq-Gecol.ppt. |
| [12] | Salameh, Z. M. (1995., June). Photovoltaic module-site matching based on the capacity factors,. pp. 326-332. |
| [13] | Saleh, I. (2006). Prospects of renewable energy in Libya. International Symposium on Solar Physics and Solar Eclipses (SPSE), 153-161. Retrieved from data.irsol.ch/spse/spse-download.php?pid=20. |
| [14] | Trieb, F. (2011). Project Manager for the TRANS-CSP and the associated AQUA-CSP and MED-CSP report. |
| [15] | Y. M. Atwa, E. F.-S. (2010, Feb). Optimal renewable resources mix for distribution system energy loss minimization. IEEE Trans. Power System, 25, 360-370. |
| [16] | Z. M. Salameh, B. S. (June 1995). Photovoltaic module-site matching based on the capacity factors. (pp. 326-332). IEEE Trans. Energy Convers. |

 Abstract
 Reference
 Full-Text PDF
 Full-text HTML