-
Paper Information
- Paper Submission
-
Journal Information
- About This Journal
- Editorial Board
- Current Issue
- Archive
- Author Guidelines
- Contact Us
Energy and Power
p-ISSN: 2163-159X e-ISSN: 2163-1603
2017; 7(1): 1-9
doi:10.5923/j.ep.20170701.01

Theoretical Modification of a Methodology for Determining Steam Turbines Thermal Performance Lossin a Combined Cycle with Cogeneration
 Abstract
 Reference
 Full-Text PDF
 Full-text HTML
Luiz Fernando Valadão Flôres, Marco Antônio Rosa do Nascimento, Lucilene de Oliveira Rodrigues, Fagner Luis Goulart Dias
Federal University of Itajubá -.UNIFEI, Itajubá, MG, Brazil
Correspondence to: Marco Antônio Rosa do Nascimento, Federal University of Itajubá -.UNIFEI, Itajubá, MG, Brazil.
| Email: |  |
Copyright © 2017 Scientific & Academic Publishing. All Rights Reserved.
This work is licensed under the Creative Commons Attribution International License (CC BY).
http://creativecommons.org/licenses/by/4.0/

The growing need of use of more efficient and less costly thermal power plants, given its proposal for electricity generation in Brazil which increased significantly in recent decades ultimately encourages the development of technologies to monitor its operation. Thus improvements in thermal performance of steam turbines will help gaining competitive advantage in the market by reducing operating costs and increasing the amount of the plants available on producing power more efficiently. This work aims to present the results of the methodology modification and the computer tool development based on the Spencer et al. [7] method to determine the drop of thermal performance of steam turbines operating in a combined cycle with cogeneration. Several adjustments were carried out to the methodology originally chosen as a reference, as it does not count for the use of cogeneration, i.e. without extractions at intermediate stages of the steam turbine. Thus, the method was modified to contemplate the steam extraction, and it was obtained satisfactory results when compered with existed Cogeneration Power Plant Heat flow. It can be noted by checking the results that the largest deviation of the efficient values obtained occurred in the low-pressure section with 2.14% as the biggest one mainly because of the large number of parameters that vary simultaneously and the strong influence of the extraction on this section which does not occur in the high and medium pressure turbines. However, the deviations were rather low once the methodology has a general application addressing machines with very different characteristics. In addition to this study, the adjustments were made to replicate the characteristics of the Heat flow Diagrams in some cases it was difficult to find any trend for all load.
Keywords: Dropof performance, Thermodynamic analysis, Efficiency, Energy
Cite this paper: Luiz Fernando Valadão Flôres, Marco Antônio Rosa do Nascimento, Lucilene de Oliveira Rodrigues, Fagner Luis Goulart Dias, Theoretical Modification of a Methodology for Determining Steam Turbines Thermal Performance Lossin a Combined Cycle with Cogeneration, Energy and Power, Vol. 7 No. 1, 2017, pp. 1-9. doi: 10.5923/j.ep.20170701.01.
Article Outline
1. Introduction
- Given the current situation of the planet, where the resource of water was considered inexhaustible, has become scarcer and the competitiveness of electricity generation market has increased gradually in recent decades in Brazil. Thus electricity generation coming from Thermal Power Plants in the country has increased over the past two decades, besides the water resources shortage, most of those resources destined for the hydroelectric generation have already been explored. The electricity generation costs in Thermal Power Plants is higher than the corresponding costs in Hydroelectric Power Plants. The reduction of these costs, as well as an efficient operation management in Thermal Power plants will be worthwhile.The use of thermal systems working in Combined Cycle has been applied and widely used, as well as the use of Cogeneration Systems in industrial plants. Therefore, the increasing need to reduce the cost of the power output by Thermal Power Plants have encouraged the development of technologies to monitor and to diagnose its operation of the equipments and the facilities, stimulating the enhancement of techniques for that. Thus, the techniques for monitoring steam turbine faults will improve its thermal performance as well as the quality of maintenance, reducing the turbine downtime, its operating costs and increasing plant availability in power generation with an appropriate efficiency. Through an extensive review of the literature there was a search for concepts that were used during the work, through various existing publications, for an assessment of the state of the art on the subject under study, therefore obtaining information that supported the choice of the methodology calculation for this work, justifying its development. It was observed that two issues are critical for the analysis of performance drop in steam turbines. The first relates to turbine efficiency, presenting an overview of the factors of load losses seeking as most as possible to quantify them. The second deals with the most frequent failure mechanisms in steam turbines such as: leaks, fouling, erosion, unbalance and mechanical failure of the blades (internal damage), as well as methodologies and /or programs for its evaluation.Latcovich, J. et al. [1] shows in his report a study by the North American Electric Reliability Council (NERC) in which the main failure mechanisms and their causes in thermal power plants burning fossil fuels are shown including a classification on the frequency of occurrence and severity.According to Morais, C. [2], there are studies on the analysis of performance in steam turbines that aims on reducing costs and achieving a better steam cycle performance in a thermal plant, like Kubiak et al. [3] which proposed a simple algorithm to determine the thermal performance of steam turbines considering the deterioration of the turbine flow section. Morais, C. [2] also points out the work of Schofield [4] where the major causes of deterioration of thermal performance in steam turbines are defined and quantified. It also determines the deterioration rate as a consequence of the turbine design features, the quality of the steam, the operating procedure of the plant and the easiness to recover efficiency, or the efficiency of the turbine, after regular maintenance. Tirone, et al. [5] conducted a collection of deterioration of steam turbines cases for seven years and on this paper they describe what are the diagnoses and methodologies based on thermodynamic analysis of the performance parameters of the steam turbines. It was come to a conclusion of the significance of using a monitoring system and developing a maintenance program based on the diagnosis reached after the analysis of the thermodynamic parameters of a steam turbine. According to Li et al [6] four main common problems can be expected regarding damage in steam turbines:• Excessive steam leaks (damage by wear and friction in sealing system);• Erosion of solid particles;• Internal damage;• Fouling.Each of these potential problems has features that will allow diagnosis based on the results of performance tests monitoring. Li et al. [6] shows on its work a part of typical loss found in an inspection for each of the mentioned causes which are highly variable where a maximum deviation of 12% is observed due to wear on the sealing system. This work aims to present the results of the methodology modification and the computer tool development based on the Spencer et al [7] method to determine the drop of thermal performance of steam turbines operating in a combined cycle with cogeneration through the evaluation of the machines thermodynamic status degradation. Several adjustments were carried out to the methodology originally chosen as a reference as it did not count for the use of cogeneration i.e., without extractions at intermediate stages of the steam turbine. Thus, the method was modified to contemplate the steam extraction, and results ware compered with existed Cogeneration Power Plant Heat flow.As this technology is not yet available for this type of cycle, it contributed with procedures and a methodology that will allows the reduction of operating costs and the increase of availability and reliability of the system of thermal power plants operating in a combined cycle with cogeneration thus enabling:• Computer procedures to analyze the steam turbine performance drop;• Process improvement; • Improving the service quality; • Expansion of equipment lifespan.
2. Spencer, Cotton and Cannon Methodology
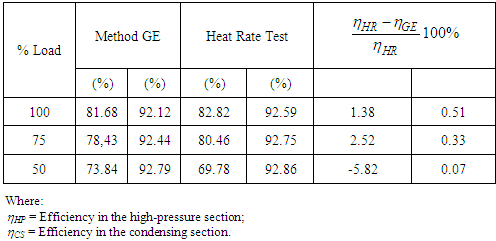
- The turbines can be modeled with different levels of complexity. According to Ungría, A. et.al. [8] the most accurate methods are those applied stage by stage considering correlations and a multitude of parameters such as geometric data of machine components which in most cases are not so simple to obtain. However, General Electric® developed a set of techniques for steam turbine modeling (Bayli et al [9]; Bayli et al [10]; Spencer et al [7]) simpler than other existing methods.Given this set of modeling techniques developed by General Electric® various computer-modeling programs use these techniques. Ungría, A. et al. [8] developed a real exergetic simulator for the operating conditions of a steam thermal power plant. The authors applied the methodology described by Spencer et al. [7] adding it to the exergetic analysis. The simulator was mainly developed to predict the thermal power plants behavior on partly loaded conditions. According to the authors there are several methods typically used to model steam turbines with different levels of complexity. However, methods and procedures published by General Electric® allow parameter picturing such as efficiency at partial load or base load with and without reheat. According to Ungría, A. et al. [8], this methodology has been used in several independent commercial programs such as SYNTHA, PEPSE, PRESTO, STEP and SICIVEX among others, during the development of steam cycles simulators. According to Ungría, A. et al. [8] machine behavior should be exactly reproduced i.e., not only the main flows should be considered but also secondary flows, steam leaks, steam sealing and auxiliary tanks adjustments. According to Table 1 adapted from Ungría, A. et al. [8] there is a comparison of the results obtained by General Electric® method and the acceptance tests performed.
|
3. Case Study
- A case study was carried out in a Thermal Power Plant (TPP) operating in combined cycle with cogeneration that powers an oil refinery. However, as a Commissioning Test had not been done in the TPP under study, it should be noted that a project reference state was adopted using the data from the Heat flow Diagram provided by the steam turbine manufacturer. The Heat flow Diagram is a document supplied by steam turbine manufacturers, which presents the features of a machine through the thermodynamic properties of steam at various measuring points. They are designed from simulation programs or developed by the manufacturer and must be measured by practical tests which generates results for different power inputs.
4. Adjustments to the Methodology
- According to the methodology developed by Spencer et al. [7] the efficiencies values of the high, medium and low pressure sections are obtained using a sequence of calculations presented in the original work, which are summarized in Table 2.
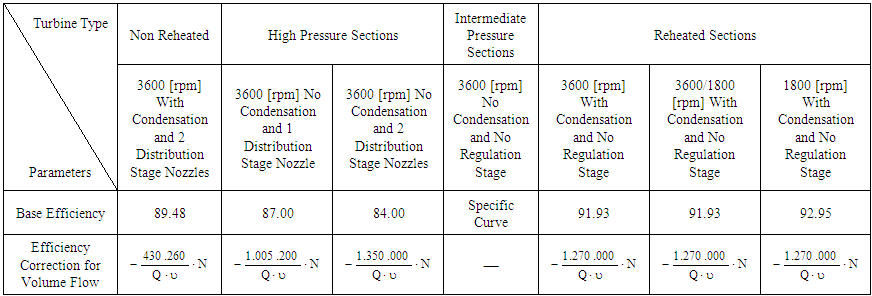 | Table 2. Efficiency Calculation Procedure (all corrections are in percentage) (Adapted from Spencer et al. [7]) |
 Based on this, the electric power of 55 MW was elected as the initial one, using the same strategy as in the high-pressure section. Next, the methodology was applied to this load, yielding a greater value than the one reported by the Heat flow Diagram.In this case, the efficiency value suggested by Spencer et al. [7] was decreased from 91.93 to 86.71 through Excel®"Goal Seek" tool in order to adapt the calculation procedure of steam turbine characteristics under study. It is worth to point out that the methodology developed by Spencer et al. [7] is set for a family of machines which originally is carried out by the General Electric® machines. Furthermore, it is ensured that possible deviations found in other load will only be related to the demanded power variation.Afterwards, the same initial baseline efficiency was applied to the other load presented in the Heat flow Diagram.In order to adjust the observed deviations, the procedure used was similar to the one used in the high-pressure section using the "Goal Seek" tool in order to get the calculated enthalpy deviations between the methodology and the Heat flow Diagram, for each power value. Thus, a new step was added to the methodology originally proposed by Spencer, Cotton and Cannon, adding to the final calculated enthalpy value the correction enthalpy properly adjusted to each power. Finally, based on the several correction enthalpies a trend curve of the flow rate in this section was created, maintaining the same correction procedure.Following the application of the trend curve the corrections were made in Visual Basic and implemented in the Excel® spreadsheet with some deviations still being found. Here, after analyzing the procedure applied in the previous sections it was found that the enthalpy conditions used initially for the power 55 MW remained constant, while the steam conditions varied along with the power.This happens due to the low-pressure section isentropic efficiency calculation procedures, which has an extraction in an intermediate stage of the section and not in the last stage as noted in other sections.In this case, the adjustment made was kept at first, as the methodology does not have correction curves to determine the penalties that the extraction characteristics variation can influence the initial efficiency value. Afterwards, the steam properties were kept constant, observing how it affected the efficiency of calculated value previously. Thus, using the "Goal Seek" Excel®tool, the final enthalpy differences could be identified and distributed through the pressure ratio, i.e. the exhaust operating steam pressure over the steam pressure at 55 MW on extraction also.Applying the proposed adjustment curve deviations were significantly reduced and considered satisfactory.
5. Definition of Control Volume
- The defined control volume to be used in the previously developed methodology is shown in Figure 1.
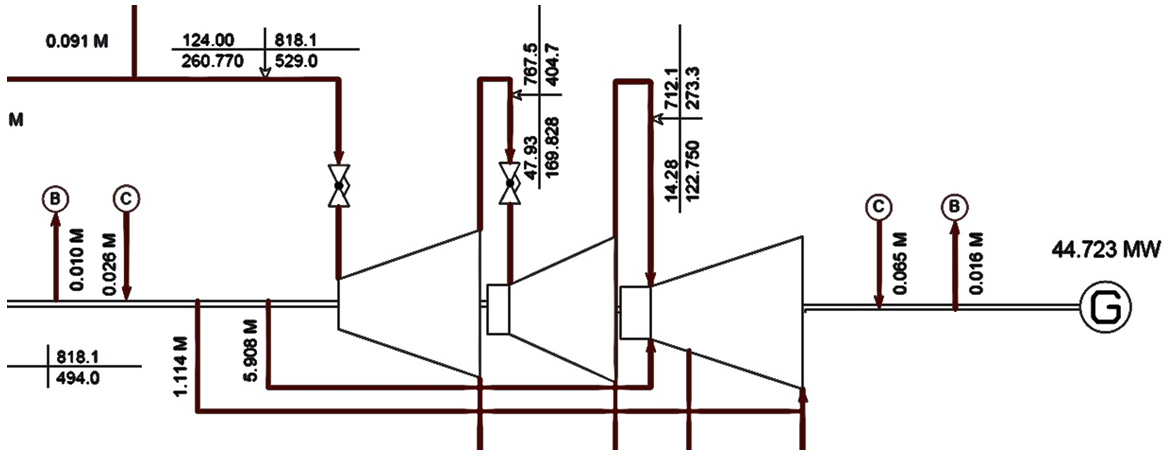 | Figure 1. Simplified steam flow diagram (Siemens power plant documents) |
6. Summary of the Deviations after Calculations
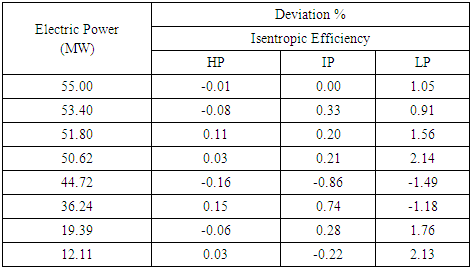
- After making the adjustments, adding the new steps to the methodology (modified methodology) and developed the computer program, the results of the calculations are presented below for: • Isentropic efficiency;• Powers;• Expansion lines.The results are a comparison between Spencer and Cotton Modified Methodology (spreadsheet) X Heat Flow DiagramA - Isentropic efficiency for high, intermediate and low pressure sectionsFigure 2. presents the result of deviations obtained by the Excel® sheet for the Electric Power of 55 MW.
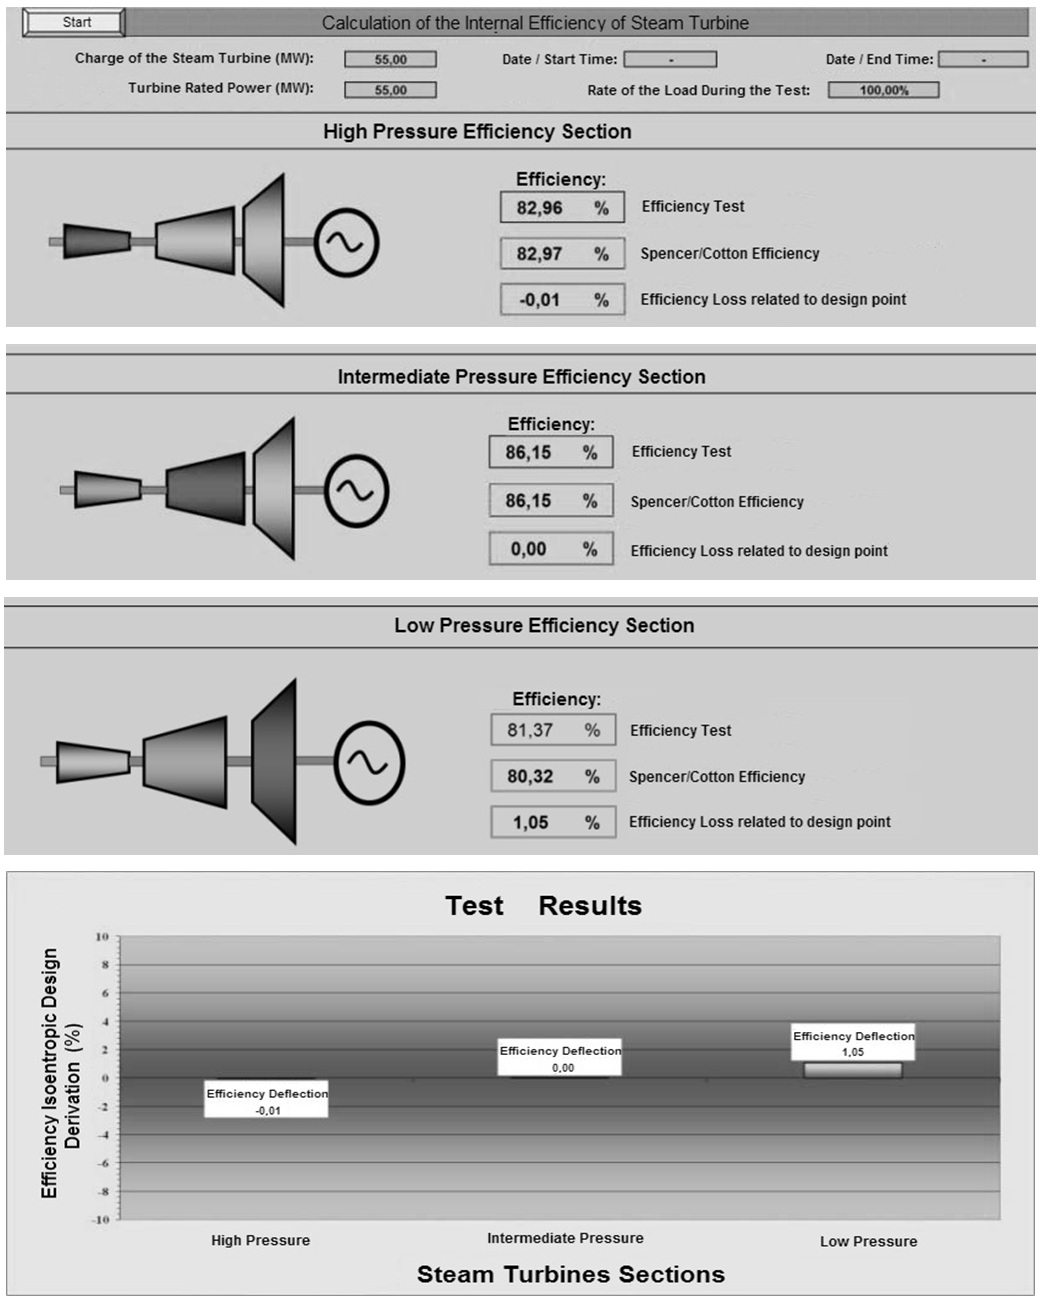 | Figure 2. Distribution of deviations of the TV sections efficiencies |
|
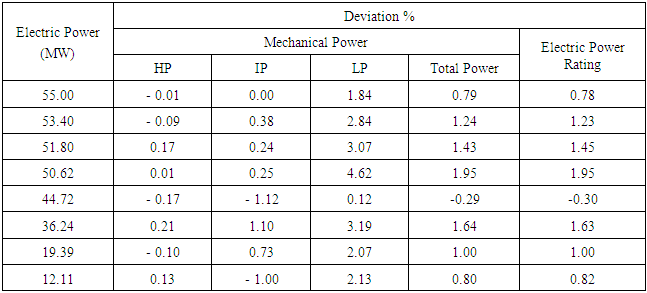
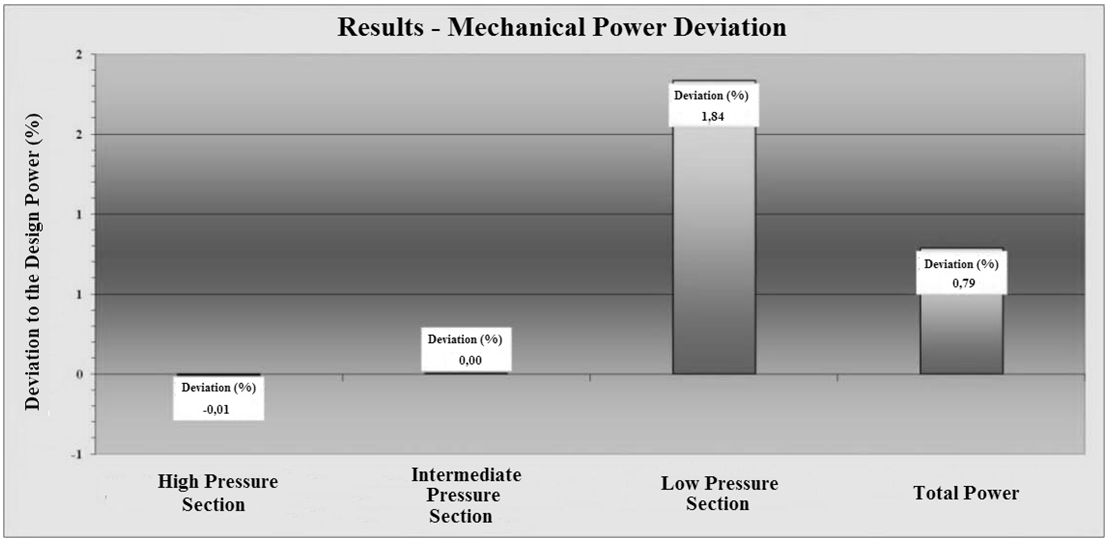 | Figure 3. Deviations distribution of the TV sections mechanical power |
|
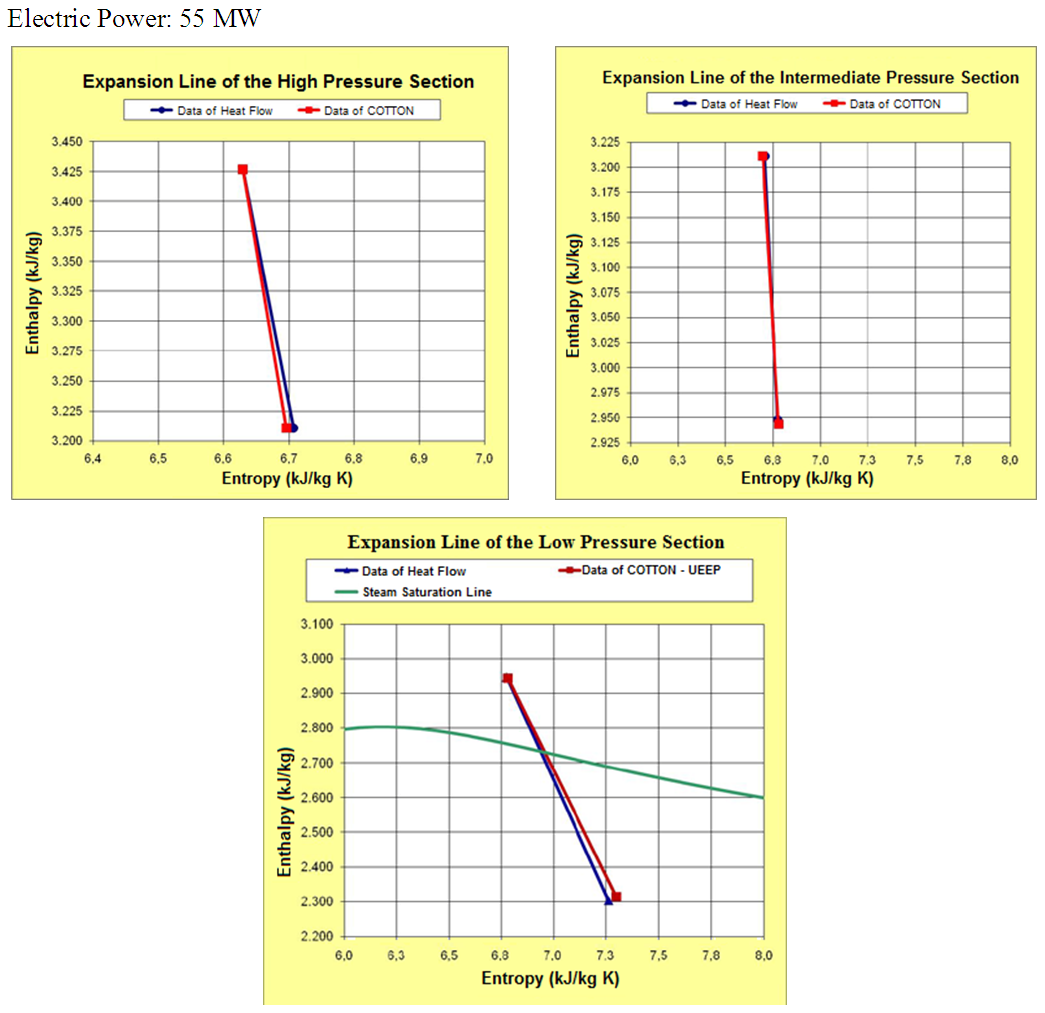 | Figure 4. Expansion Lines for TV sections - 55 MW |
7. Conclusions
- Improvements in the thermal performance of steam turbines, whether operating in the Rankine cycle or combined cycle, can help the thermal plant operator obtain competitive economic advantages in the market by reducing their operating costs and increasing its energy production. The operation of a steam turbine in a combined cycle is different than a steam turbine operating in the Rankine Cycle. The main difference is the variation of the amount of steam through out the turbine, as in the Rankine Cycle the steam flow entering the 1st stage of the seam turbine is equal to or greater than the last expansion of stage outlet flow, while in the Combined Cycle the steam flow at the inlet is equal to or less than of the last stages outlet flow. Due to these main differences, the determination of the Combined Cycle steam turbine performance presents some challenges, i.e. the measurement of the boiler feed water flow. Thus, a calculation method or procedure that can be used to evaluate the performance of a steam turbine operating either in a Combined Cycle or in a Rankine cycle is worthwhile.The steam turbine performance evaluation system includes: error determination in the acquired data stream, calculation results correction for the reference conditions, layout of the real expansion lines and their graphical comparison against the reference lines for each turbine section, determination of the isentropic efficiency for each turbine section and its comparison with the reference values and graphical presentation of the results.This study was based on the methodology of Spencer et al. [7] to determine the drop of thermal performance of steam turbines operating in combined cycle with cogeneration. Several adjustments were carried out to the methodology originally chosen as a reference, as it did not count on the use of cogeneration, i.e. without extractions at intermediate stages of the steam turbine. Thus, the method was modified to contemplate the steam extraction, and it obtained satisfactory results. It can be noted by checking the results, that the largest deviation of the efficiency of the values obtained, which occurred in the low-pressure section, with 2.14% as the biggest one, mainly because of the large number of parameters that vary simultaneously, and the strong influence of the extraction on this section, which does not occur in the high and medium pressure turbines. Regarding the obtained expansion lines, before the presented results, it is observed that they were almost overlapped on the high and intermediate pressure sections. This is due to the smaller deviation found between the developed methodology and the values of the Heat flow Diagram in these sections. On the other hand, at the low pressure section, as shown in Picture 6, the deviations were higher, reflecting the previous analysis made throughout the efficiency calculation. The research carried out throughout this work has shown that there are not many advances made in the open literature, especially regarding Spencer et al. [7]’s methodology to obtain a steam turbines performance and thermal diagnosis.Given the results, it can be said that the methodology and procedures development adaptations are a potential tool to automate the performance and diagnosis studies of thermal power plants operating in a combined cycle with cogeneration.
ACKNOWLEDGEMENTS
- To PETROBRAS/CENPES through the R&D with the Cooperation Agreement number 0050.0052162.09.9, for the data required for this work, besides the financial support.