E. C. Merem1, J. Wesley1, E. Nwagboso2, S. Fageir1, S. Nichols1, P. Isokpehi1, M. Crisler1, M. Shenge1, C. Romorno1
1Department of Urban and Regional Planning, Jackson State University, Jackson MS, USA
2Department of Political Science, Jackson State University, Jackson MS, USA
Correspondence to: E. C. Merem, Department of Urban and Regional Planning, Jackson State University, Jackson MS, USA.
| Email: |  |
Copyright © 2016 Scientific & Academic Publishing. All Rights Reserved.
This work is licensed under the Creative Commons Attribution International License (CC BY).
http://creativecommons.org/licenses/by/4.0/

Abstract
In the face of uncertainties associated with conventional energy resources. Identifying the geographic dimensions of wind energy trends and the patterns has the potential to address some of the significant issues communities face. This is highly indispensible in order to ensure self-sufficiency in alternative and sustainable energy systems. This paper will focus on the analysis of geographic dimensions of wind energy use in selected areas of the Midwest region of the United States. The emphasis is on the issues and trends, factors shaping the adoption of wind energy and the impacts of usage. While the paper uses a mix scale method of descriptive statistics and Geographic information systems (GIS) to analyze the trends spatially. Preliminary results show growing use of wind power as an alternative source of energy all through 2002-2013 in the Mid-west. This is evident with the sizable capacity, installed and generated energy, rising potentials, and changing growth rates as well as economic and ecological benefits. The spatial mapping of the trend points to visible patterns, dispersion and concentration of wind power under different categories from generated to installed capacity and benefits in areas where usage has been growing over the years. Notwithstanding the socio-economic and environmental factors fueling wind power surge along with limitations, the paper offered several suggestions ranging from education to the strengthening of current policies and the design of regional energy information system to sustain decision making.
Keywords:
Geography, GIS, Wind energy, Impacts, Policy, Midwest region, Factors, Alternative energy
Cite this paper: E. C. Merem, J. Wesley, E. Nwagboso, S. Fageir, S. Nichols, P. Isokpehi, M. Crisler, M. Shenge, C. Romorno, The Geography of Wind Energy Use in the Mid-West Region of the US, Energy and Power, Vol. 6 No. 1, 2016, pp. 1-15. doi: 10.5923/j.ep.20160601.01.
1. Introduction
The recent analysis of energy policy shows continual use of wind power in other nations with little coverage of the US experience based on specific geographies such as the Midwestern region of the country. Yet the region remains heavily endowed with wind energy potentials at levels that surpass many areas of the country. To buttress the growing significance of wind power potentials at the national level, current records show that the United States generates more electricity than either Germany or China, for the same installed capacity using wind power. During the 2011 period, the United States generated 121 terra watt-hours (TWh), representing about 27.7% to 19.7% of the world's wind generation as well as installed wind capacity, while China accounted for 73.2 TWh (16.7% of the world's total with 26.1% of installed wind capacity). Germany on the hand was responsible for 10.6% of the globe’s wind generation along with 12.1% of the installed capacity during the same period. In 2008 when the installed wind capacity in the US increased by 50% over the prior year, the world’s average growth rate that year stood at 28.8% [1-3]. Just as wind power in the US remains a segment of the energy industry that has been growing rapidly over the last several years. Towards the end of 2013, the US capacity of 61,108 MW was exceeded only by China [4, 5]. All through the initial 12 months period leading to January 2014, the volume of electricity energy through wind power in the US estimated at 1717.02 TWh equaled 4.18% of all electrical energy [6]. In that light, it is not only projected that by 2030, wind energy will account for 20% of US electricity supply, but in the last several years wind power has seen a significant surge [7]. During the 2010 fiscal year, however new development represented only 50% of the preceding year as a result of several elements prompted partly by the volatility of the market place and economic down turn. In the following periods of 2013, producers in the country saw a 92% reduction in installed capacity compared to 2008 when it rose by 50% over the prior year [2]. Notwithstanding these potentials, in the last several years the sector continued to suffer from incoherent policies. This is compounded by the mounting challenges and road blocks faced continuously by policy makers in the US in designing sustainable energy programs. Even though recent US policy towards the sector has largely been to provide federal production tax credit (PTC) [7] of around $20 per MWh generated during the first ten years of operation for wind energy sold. The failure of US Congress to formulate a long term renewable energy policy remains detrimental to the development of wind power in the country. In fact whenever credit expiration time is escalated in the sector, wind power development activities dwindle the next year. This situation in turn forces investors to sit it out and wait for better market conditions before further commitment. That level of uncertainty has in many occasions brought wind power development activity to a near halt at the expense of the sector. As a result, the short term one year policy of tax credit provision earmarked for energy projects by the end of 2013 through 2014 did little to sustain continual investment in the wind power sector [2]. With more human activities and the over dependence on conventional sources apparent, communities are longing for sustainable renewable energy sources amidst challenges. As of 2014, the wind industry in the US produced more power at lesser prices using higher wind turbines with longer blades, picking faster winds at higher altitudes. This has opened up new opportunities in the Midwest states of Indiana, Michigan, and Ohio where the price of power from wind turbines built 300 feet to 400 feet above ground can compete with conventional fossil fuels like coal. These prices have now dropped so low to about 4 cents per kilowatt –hour in some cases that the utilities’ sector who saw increases in the amount of wind energy in their range cite it is as the most inexpensive choice available [8]. Accordingly, several states in the Midwest region have now seen many completed wind projects which makes them some of the fastest growing markets in the country. To that effect, in 2012 electricity generation from wind power reached 10 percent or more in nine states of the US with three Midwest states of Minnesota, Iowa and Kansas actively involved. Of these states, Iowa led the wind power market making up nearly, a quarter of their overall electricity generation [9].Considering the trends in the region, regional data show that wind power indicators such as installed capacity and the amount of energy produced among the states remain visibly high with steady increases in states like Minnesota, Indiana and Iowa over different periods. Not fully known in the conventional literature, is the wind power consumption levels and the position of the region in national rankings among the other states in the country. The same can also be said of the regional trends in terms of generated capacity, the number of turbines, the added potential, the economic relevance under the aegis of jobs, investment, and the number of facilities. Added to all these are the environmental benefits of wind power in the form of water conservation and CO2 emission reduction which is equivalent to taking millions of cars off the road [10]. These attributes reinforce the benefits and promise of wind energy planning in the region as a worthy endeavour. More on wind power in the context of this research can be gleaned from studies listed herein [11-16].Having said that, the spatial dimensions of wind energy use with GIS and the trends in the region remain unknown to the public and those charged with the task of decision making in the energy domain of the Midwestern region. Considering the essence of such efforts in the assessment of natural resource issues, researchers are adopting Geographic Information Systems (GIS) to manage natural resources [17]. In realizing these benefits, numerous scholars have been focusing their GIS skill towards the design of environmental models for the past several years [18]. Notwithstanding the benefits, very little has been done to track wind energy trends with Geographic Information Systems (GIS) in the Mid-West region. However, GIS has seen extensive use in previous enquiries as shown by Merem and others in various years [18-25]. Related work on fossil fuel energy along these lines by Merem [26], underpins the significance of these themes. Seeing the benefits in the analysis of energy issues [27-29], GIS applications continue to gain widespread acceptance in that area. With the probability of fossil fuel depletions looming and the market volatility associated with energy resources a common occurrence [1]. Identifying the geographic dimensions of wind energy trends and the patterns has the potential to address some of the most significant issues communities face. This has to be resolved in order to secure sustainable energy systems for posterity. Knowledge of the geographic and temporal patterns of usage and potentials in the various states are highly indispensable in the efficient management of wind resources in areas where wind power is active. There is also the potential to enhance the appeal among the general public and users in an era in which fossil fuel dependency continues to generate environmental and economic discomfort to citizens and communities. Considering its rich potentials in wind energy and growing infrastructure in the sector, the study area has experienced rapid expansion in wind energy use with notable generation of electricity from it. This paper will focus on the analysis of geographic dimensions of wind energy use in selected areas of the Midwest region of the United States. The emphasis is on the issues and trends, factors shaping the adoption of wind energy, the benefits and impacts of wind energy use. The paper has five objectives. The first aim focuses on the use of geospatial technology to assess wind energy use and the levels of change, while the second objective is to design a support device for policy makers. The third aim emphasizes the development of new technique for identifying indices for wind power planning. The fourth objective is to create a framework for energy planning using mix scale tools of descriptive statistics connected to GIS. The fifth objective is to analyze wind energy trends. In terms of organization, the paper is divided into five sections. The first part covers the introduction and background, while the second part highlights the methods and materials. Section three presents the results of data analysis made up of descriptive statistics, factors and spatial analysis of GIS mapping, Section four discusses the findings while section five provides the conclusions and recommendations.
2. Methods and Materials
2.1. The Study Area
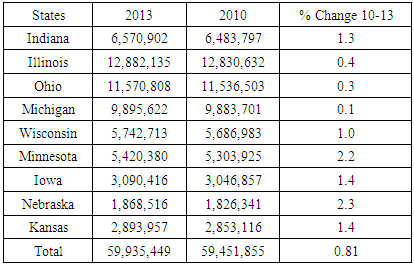
The study area (Fig 1.0-1.1) stretches through 273,034.61 miles across 9 states in the Midwest Region of the US. Between 2010 through 2013, the population changed from 59,451,855 to 59,935,449 at a rate of 0.81% [30], (Table 1). While the region is endowed with vast amount of wind resources, one third of the US wind capacity is located therein [10, 11]. At the same time, significant amount of resources and projects have been deployed in the region to sustain the wind energy sector. Given the abundance and based on the assertions of the American Wind Energy Association (AWEA), several Midwestern states have had vast wind power capacity installations over the years. Among the states, the distribution of highest wind power capacity installations at the end of 2013 shows Iowa and Illinois in the first order with 5,117 to 3588 mw followed by Minnesota, Kansas and Indiana at 2,987, 2967 to 1544mw respectively [10].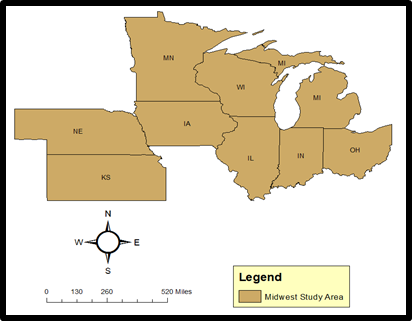 | Figure 1.0. The Study Area |
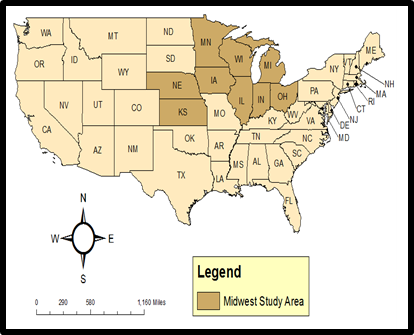 | Figure 1.1. The Midwestern Region |
Table 1. Population Trends in the Study Area
 |
| |
|
With more than one third of the US wind capacity located in the Midwest, about five states in the region generate more than 10 per cent of their electricity from wind energy. As a result, in 2012 the Midwest witnessed a 29% increase in wind generation capacity by adding more than 21 GW of new wind power to the grid. In fact of all these states, Iowa ranks as the third largest producer of wind energy in the US and it is only second to California and Texas. With all these potentials, one need not forget the growing economic and environmental benefits that accrue wind power in the region. With socio-economic spill overs through jobs creation, facility design, and income generation from land leases, millions of homes in the nine states of the study area from Michigan to Kansas still get their electricity from wind power in the region [10]. Electricity generation from wind energy in these places is not only highly indispensible in sustaining the basic necessities of life but, it does make the communities liveable as well. Accordingly, the annual environmental benefits associated with wind power continue to grow among the individual nine states in the Mid-western region of the country. These benefits which include water saving capabilities estimated in billion gallons do serve a useful purpose in local planning within communities profiting from it. Added to that, is the prevention of CO2 emissions measuring millions of metric tons. This is equivalent to taking millions of cars off the local high ways [10]. By easing water conservation and stress problems and saving communities from the discomfort of CO2 and particulate emissions, wind power is gradually assuming a vital place in the region. For the benefit of effective decision making and better understanding of the trends, this must be analysed to gauge the geographic dimensions. Considering the void in previous studies on the geography of wind power usage in the Midwest and the potentials of the region, the current study affords us opportunities to analyse the trends from a temporal spatial perspective.
2.2. Methods Used
The paper uses a mix scale approach involving descriptive statistics and primary data connected to GIS to analyse wind energy trends in the Midwest. The spatial information for the research was obtained from the National Wind Energy Association, American Wind Energy Association (AWEA), Mid-west Wind Energy, The US Department of Energy (DOE), The Energy Information Administration (EIA) and The US Department of Agriculture. All in all, the wind energy information for the nine Mid-West states came from the Energy Information Administration (EIA) for the periods of 2002 to 2013, while the American Wind Energy Association provided the wind capacity information, the wind generation potential data along with the economic and environmental benefit data. While the federal geographic identifier codes of the states were used to geo-code the information contained in the data sets. This information was processed and analysed with basic descriptive statistics, and GIS with particular attention to the temporal-spatial trends at the state and regional level. The relevant procedures consist of two stages below.
2.3. Stage 1: Identification of Variables, Data Gathering and Study Design
The first step involves the identification of variables needed to assess wind energy use in the nine states of the Mid-west. The variables consist of population, wind energy capacity, energy production, wind energy consumption estimates, total energy consumed per capita, rankings of installed wind power, wind farms, wind generated capacity and wind generation potential. The others include total jobs created, capital investment, annual land lease, number of manufacturing facility, annual water savings, CO2 emission avoided, and equivalent number of cars off the road, projected target of electricity use. Additionally, access to databases that are available within the Federal and state archives in the Mid-West and other agencies quickened the search process. The process continued with the design of data matrices for socio-economic and environmental variables covering the periods from 2002, 2005, 2006, 2010, 2011, 2012, and 2013. The design of spatial data for the GIS analysis required the delineation of state boundary lines. With boundary lines unchanged, a common geographic identifier code was assigned to each of the units to ensure analytical coherency.
2.4. Stage 2: Step 2: Data Analysis and GIS Mapping
In the second stage, descriptive statistics and spatial analysis were employed to transform the original socio-economic and energy data into relative measures (percentages/ratios). This process generated the parameters for measuring the potentails, wind energy production, installed capacity, useage levels and the trends associated with wind energy distribution. This was facilitated by measurements and comparisons of the trends over time. While this approach helps track the levels of use, the tables highlight potentials, number of instalations, environmental and economic benefits. The remaining steps involve spatial analysis and output (maps-tables-text) covering the study period, using ARCVIEW 11. The spatial units of analysis consist of states, region and the boundary and locations where wind power is active. The geographic data for the Mid West which covered its boundaries and states, also includes ecological data of land cover files, and paper and digital maps from 2002-2013. The outputs of the spatial data were mapped and compared to see the dispersion of the trends, usage, production, and the socio-economic factors fuelling the proliferation of wind energy distribution in the study area.
3. Results
This section of the paper presents the results of the data and environmental analysis of wind energy use in the study area. There is an initial focus on the temporal profile of wind generated capacity, production and the percentages of change, the potentials and the installed wind power. This was followed by an analysis of the factors most notably socio-economic and environmental factors and the spatial mapping of the trends over the years using GIS.
3.1. Wind Generated Capacity and Energy Production 2002-2006 (Environmental Analysis)
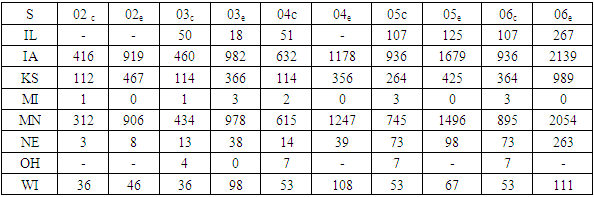
Looking at the table on wind energy indicators of the Midwest, one not only notices a steady frequency in their output and distribution in the states of Iowa, Kansas and Minnesota but they outpaced the remaining states. The next tier of states (Illinois, Nebraska, Wisconsin and Michigan) had wind generated capacity and energy production that were relatively lower while the numbers for Ohio stayed minuscule. For a breakdown of the trends during the 2002-2003 periods, note that the state of Iowa saw its wind capacity go from 416 to 460 megawatts (mw) and in the following periods of 2004 -2005 and 2006 it stood at 632 and 936 mw respectively. Minnesota on the other hand opened with 312 mw in 2002 and between 2003 and 2004 the capacity generated reached 434 to 615 mw. In the ensuing years (2005 -2006), note that the wind generated capacity grew by 745 mw to 895 (Table 2).Table 2. Wind Generated Capacity, and Energy Production 2002 -2006
 |
| |
|
Of the states known for wind energy, generated capacity for Kansas were in the order of 112 to 114 between 2002 through 2004. During the same periods, the increments continued with 264 to 364 mw. Even in the absence of a complete data, the state of Illinois remained active with 50 to 51 mw and 107 mw during 2003 to 2006 period. Nebraska on the other hand showed evidence of generated capacity measuring up to 3 to 13 mw and 14 to 73 mw during the periods under analysis while in Wisconsin the volume of energy produced stayed stable at 36 and 53 mw much of the time. The same can be said of the trends in the state of Michigan as well. In terms of energy production, Iowa outpaced the others with 919-982 and 1178 GWh in 2002 and 2003 to 2004. All through 2005 to 2006, energy production soared by 1679 -2139 GWh in the state of Iowa. Elsewhere in Kansas, energy production during 2002 to 2003 fell from 467 to 366 GWh only to rebound by 356 to 425-989 GWh in the fiscal years 2004-2006. Minnesota produced appreciable volumes in wind energy (estimated at 906, 978 GWh to 1247, 1496 to 2054) while Wisconsin followed up with 46, 98,108 and 67 to 111 GWh. Between 2002 through 2006, Nebraska generated enough wind energy (measured at 8, 38, 39 GWh), coupled with additional 98 and 263 GWh. During these periods, other states like Illinois, Michigan and Ohio also showed evidence of wind energy production as well (Table 2). The frequency of wind energy indicators was robust in Iowa, Kansas and Minnesota, but remained at medium levels in the next tier of states. From 2002-2003, Iowa’s wind capacity grew by 416 to 460 mw and in 2004-2006, it rose by 632 to 936. Minnesota opened with 312 mw in 2002, in 2003-2004 the capacity generated grew (434-615 mw) and in 2005-2006, its wind generated capacity rose by 745 mw to 895.
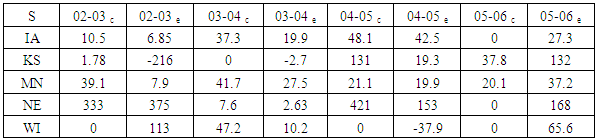
3.2. Percentage of Change in Wind Generated Capacity and Energy Production
The percentage of change in wind generated capacity showed more increases in 5 states (Iowa, Kansas, Minnesota, Nebraska, and Wisconsin) in 2002-2006. In Iowa wind generated capacity soared by 10.5 to 48.1% and that was followed by 39.1-41.7% and over 20% for Minnesota. The frequency of wind energy use even though steady in Iowa, Kansas, and Minnesota, stayed at medium levels in other states but relatively minuscule in Ohio. In other words, the percentages of change in wind generated capacity in the study area was stable in some periods but showed continual growth with notable increases in all five selected states of Iowa, Kansas, Minnesota, Nebraska, and Wisconsin between 2002-2006. Over all energy production rates in Iowa during the designated periods indicates increases of 6.85 to 19.9 and 42.5 to 27.3 percentage points during 2002-2004 as well as 2002-2006. Notwithstanding the initial drops of -21.6 to -2.7, in Kansas between 2002-2003 and 2003-2004, the volume of wind energy production in the state rose by 19.3 to 132 percentage points. Minnesota on its part showed notable rallies in growth levels from 7.9% to 27.5 in 2002-2004 and continued at 19.9 -37.2 in the periods of 2004-2006. With fluctuating increases of 375 to 2.63% at Nebraska, growth rates held steady at triple digit percentage points of 153 -168 at levels much higher than in Wisconsin where the rates varied from 113-10.2%. This was followed by a major decline (of -37.9%) which later rebounded (by 65.6%) between 2005 through 2006 (Table 3).Table 3. Percentages of Change, Wind Generated Capacity and Energy Production 2002 -2006
 |
| |
|
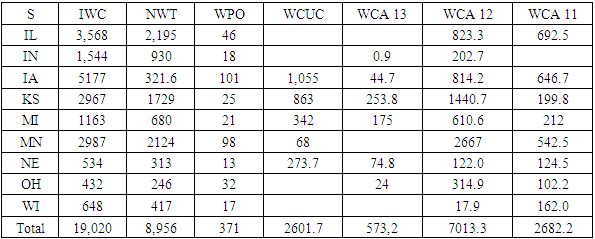
3.3. Installed and Operational Wind Generated Capacity
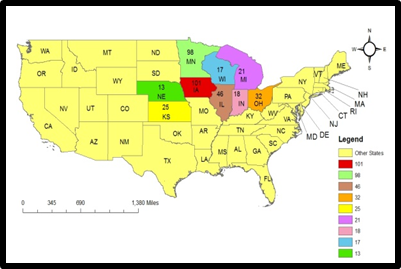
With three states (Kansas, Iowa, and Nebraska and Michigan) classified as the most consistent in terms of activities related to wind capacity over the years. As time went on, Iowa and Illinois each had 3,568 to 5,177 mw in installed capacity while Kansas and Minnesota contained over 2900 mw in new wind devices under operation. Just as Indiana began at 1,544 mw, the capacities for Nebraska, Ohio and Wisconsin each stood at 534, 432, to 648 mw respectively. Additionally, Illinois Minnesota and Kansas saw more wind power infrastructure made up of number of turbines estimated at 2,195 to 2,124 and 1,729. This is more than the others while two states (Indiana and Michigan) followed up with 930 to 680 turbines a piece. The four other states in the region Wisconsin, Iowa, Nebraska and Ohio had 417 to 321 and 313-246 turbines in operation. Aside from the predominance of Iowa and Minnesota in wind projects online with each having 101-98 programs, a number of states Illinois, Ohio, Kansas, Michigan were active as well with many projects (46, 25, 21, 32). The states of Indiana, Nebraska and Wisconsin also had valuable wind projects (18, 13, to 17) at a much lower scale compared to the others. Pertaining to wind capacity under construction, the region showed some promise in several states like Iowa, Kansas, Michigan and Nebraska and Minnesota. In these places, the projected numbers were in the neighbourhood of 1,055 to 863, 342 to 273 and 68 respectively. With the addition of wind capacity in all states between 2011 to 2013, note the higher frequency in 2010 and 2012 compared to 2013 (Table 4).As the table shows, with the overall total of 2682.2 in the Midwest, The wind capacity added in 2011 amongst the states point to higher levels of over 600-542 for Illinois, Iowa and Minnesota, while a pair of states such as Michigan, Nebraska, Ohio, Wisconsin and Kansas listed in the lower hundreds of 212, 124,102,162, and 199 stood below the former. In a similar vein, the capacity added in 2012 totalled 7013.3 and of these states, Minnesota and Kansas emerged with robust volumes of 1,440.7 to 2,667 mw. During that period, Illinois, Iowa and Michigan had more capacity that surpassed those in Indiana and Ohio. Seeing the meagre levels in 2013, added wind capacity found more use in Kansas with 253.8 mw during that period (Table 4).Table 4. Wind Generated Capacity
 |
| |
|
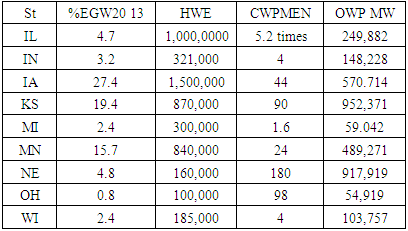
3.4. Wind Generation Potential and Installed Power
The wind generation potential in the area mirror the percentage of electricity generated from wind, homes on energy, the capability of wind power to generate electricity and the continued success of onshore wind power. The breakdown of wind generation potential in 2013 shows growing dependence on wind powered electricity with much of the percentage of electricity concentrated in Iowa, Kansas and Minnesota at 27.4 to 19.4 and 15.7 mw. Continual dependence on wind energy is evident from the number of homes on wind energy. This consists of the 1 million to a million plus houses served by wind energy in Illinois and Iowa and over 800,000 others in Kansas and Minnesota. Notable uses of wind energy among residents can be seen in Indiana and Michigan where the numbers ranged from 321,000 to 300,000 clients while hundreds of thousands of homes in three other states (Nebraska, Ohio, and Wisconsin) all drew heavily from wind powered energy. Just as the capacity of wind power remains high in the region to meet local needs, onshore wind potential measuring 80 meters in hub height reached geometric proportions (Table 5). Table 5. Wind Generation Potential
 |
| |
|
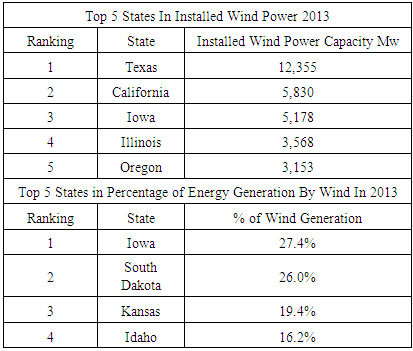
Further indication of wind power relevance of the Midwest compared to other states comes with the ranking of its two states of Iowa and Illinois in installed wind power numbering 5,178-3,568. Being among the top five states after Texas and California with 12,355 to 5,830 in that category, note that installed wind capacity for the Mid-western states outpaced Oregon whose wind capacity stood at 3,153 mw. This is different from the percentage of wind energy generation in 2013 where three states in the study area stayed in the top 5 of national ranking. Of these states, Iowa accounted for 27.4%, while Kansas and Minnesota had 19.4 to 15.7% respectively. In terms of wind power farms in the country, Fowler Ridge Farm in Indiana emerged as number 7 among the top 10 with 600 mw in capacity generated (Table 6). Table 6. Ranking: Installed Wind power and Percentage of Generation In 2013
 |
| |
|
3.5. Factors Influencing the Adoption of Wind Power
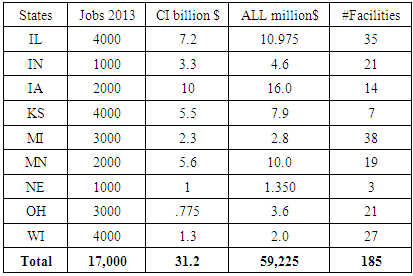
This portion of the paper highlights the factors responsible for the ongoing proliferation of wind power in the Midwestern region of the United States. The adoption of wind energy does not operate in a vacuum. It is attributed to socio-economic and environmental elements with measurable benefits to the Midwestern region. The economic benefits of wind energy not only stands out, but it is evident with the growing number of jobs being created, the capital investment, the value of land leased and the number of facilities in the sector being brought into the area. Aside from the overall 17,000 jobs generated in 2013 through the industry, wind power also added $31.2 billion in capital investment in the region and $59,225 million in annual land lease related to the design of infrastructure. Within this period, the Mid-west region developed about 185 manufacturing facilities. The jobs in individual states in thousands showed Wisconsin, Illinois and Kansas with jobs numbering 4,000. This was followed by the 3,000 that were added in Michigan and Ohio. Elsewhere Minnesota, Iowa and Nebraska created close to 1000 to 2,000 jobs in the wind power sector (Table 7). Table 7. Economic Benefits of Wind Generation Potential
 |
| |
|
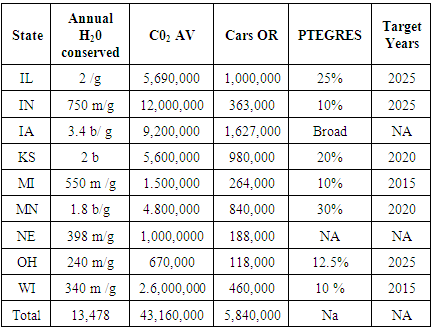
Additionally, the capital investment in billions of dollars indicates vast concentration of assets valued at $7-5 billion to 5.5 in Illinois, Kansas and Minnesota. Of the total of $59,225 spent in land projects related to wind power, Iowa accounted for $16 million, Illinois and Minnesota, each took in at least $10 million annually while $7.9 million were paid in Kansas. Given the importance of land, the yearly amount of land lease payment in other states of the region (Indiana, Ohio, Michigan, Wisconsin, Nebraska) were $4.6, $3.6 to $ 2.8 million and below. Boosting wind projects requires the design of needed infrastructure including manufacturing facilities numbering 185 across the region. Over time, the manufacturing facilities have not only grown, but they did double in 7 of the nine states with the exception of Kansas and Nebraska with 7-3 facilities. The array of facilities spread across the region shows two states Michigan and Illinois with sizable facilities numbering 38 to 35 higher than the others. Considering a group of other states in the twenty something category (Indiana, Ohio and Wisconsin), Iowa and Minnesota rounded up the list with 14-19 facilities (Table 7). So far the economic indicators fuelling the adoption of wind power as seen herein are not farfetched. To begin with, the individual states and cities where the facilities operated have an abundance of untapped wind power. As a result of that coupled with the need to harness the fiscal potentials may have drawn state agencies in the region into offering support for the industries in their respective locations. Seeing the benefits which such a thriving wind energy market would bring in the long term in the form of revenue generating potentials not only encouraged their presence, but it served as catalyst that ushered in a favourable terrain for wind power. If the prospective companies lacked the capability to commit billions of dollars in new investment necessary in the creation of job opportunities and the development of wind energy facilities, local authorities would not have provided a welcoming environment which is crucial in tapping into local market opportunities on their own. Without such a support in the face of volatility of the market place and the uncertainty in the sector, the investment climate created by the local authorities would not have been enough in sustaining the adoption of wind power in the region. Another dimension is that various economic recruitment and retention departments in many local governments in the region compete with each other to attract these companies. Given the fiscal potentials of wind power, these local entities might have gone out of their way to recruit wind energy firms with different types of incentives hence their presence in these areas over the years. In the context of economic elements, the role of local planning and other agencies in the mid-west region merits some attention. Being the entities responsible for the direction of future economic and physical development as contained in comprehensive plans, opportunities for growth in wind energy are many with different activities under designated land uses from industrial to open space. The ability to separate these competing land uses through enabling legislations coupled with a permit process for industries was instrumental in setting aside selected places in these states of the Mid-west for wind power infrastructure. Considering the pace of their frequency over the years in the mid-west, such an enabling environment through local planning did go a long way in shaping the evolution of the wind energy industry. Without local planning paving the way through the crafting of building codes and local ordinances, it would have been impossible to envisage the penetration of wind energy into millions of homes and the premiums which come with it in the sector. The environmental benefits of wind power in the Midwest are enormous in each individual state. The benefits consists of the billions of gallons of water conserved, the avoidance of carbon dioxide emission coupled with the growing number of cars that are taken off the road. The benefits are so obvious that in the area of water resources the entire region saves about 13, billion 478 million gallons of water from the advent of wind energy industry. Four of the nine states (Illinois, Iowa, Kansas, and Minnesota) have annual water saving capabilities estimated at over billion gallons. Of this group of states, Iowa topped the list with 3.4 billion gallons, followed by Illinois, and Kansas and Minnesota accounting for 2-1.8 billion gallons. Elsewhere Indiana, Michigan, Nebraska, Ohio, and Wisconsin each saves hundreds of millions of gallons in water (Table 8). Considering the water needs of agriculture and some many built up areas in the region, having surplus water through wind power instead of deficits is always a welcome development. This comes at a time in which many states in the county face water stress and advisories prohibiting the watering of lawns and unsustainable use. Table 8. Environmental Benefits of Wind Energy Power
 |
| |
|
In the age of climate change impacts on the environment, preventing carbon dioxide emission does stand out as a major environmental benefit and factor influencing wind energy adoption in the region. The benefits come from the 43,160,000 million metric tons of carbon dioxide that never made it into the atmosphere due to wind power. The individual state’s share of the total metric tons in projected CO2 emission that never made it into the atmosphere shows Indiana at 12 million, Iowa 9.2 million, Kansas, Illinois and Minnesota at 5.6 to 4.8 million and 2.6 million for Wisconsin. Aside from the 1-1.5 million for Michigan and Nebraska, note also the 670, 000 metric tons for Ohio. Consider also the equivalent number of 5.8 million cars that are kept off the road by wind power in the region (Table 8). Getting cars off the road as another benefit should not be overlooked. Seeing the distribution of the equivalent number of cars taken off the road numbering in hundreds of thousands to millions, then one realizes that most of the states in the Mid-west have done exceedingly well in climate change mitigation efforts. While the million to over a million and half and close to million in the projected number of cars taken off the road for Illinois, Iowa, Kansas and Minnesota are major milestones. The same can be also said of the hundreds of thousands of cars taken off the road in the other states as well. All these were made possible based on the projected percentage and yearly targets set by the individual states of the Midwest region (Table 8). These benefits may have induced the authorities in the area to provide the enabling environment for the success of wind power in the region.Added to that, there is also the advantage of the mid-west region as an area greatly endowed in wind power resources compared to the other places of the country. Because most efforts aimed at locating industries rely greatly on the available raw materials or natural resource and the nearness to sister markets. In the case of the Mid-west, the presence of vast open lands in the area coupled with endless supply of ravaging wind serve as the essential ingredients needed for the successful installation and development of wind power infrastructure. Harnessing these potentials continuously over the years in various capacities did pave the way for the successful take off of the wind energy industry. This was instrumental in attracting investment and various activities shaping the regulatory and policy framework guiding the sector. Said in another way, in the absence of substantial opportunities in wind power in the region, little would have been done to entice investors, and others including the people and the cities and state agencies into committing in any form to the sector if it had nothing to offer. Convinced about the vast presence of wind energy and the attendant ecological and economic benefits in places like Iowa, Illinois, Indiana, Wisconsin, Ohio, Michigan, and Nebraska, it came as no surprise to see a rapid penetration of the wind sector across the Mid-west over the years. The eventual industries emerged out of a region known for its vast acreages of open farm land with wind blowing endlessly in ideal settings for the siting and rapid expansion of wind power infrastructure.
3.6. Spatial Analysis
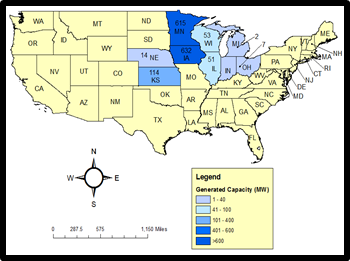
The GIS mapping shows interesting patterns in wind capacity distribution across the Mid-west region. The pattern represented under different scales consists of dark blue, purple and light purple colour. The numeric classifications as shown in the legend cover high, medium, and low wind capacity classes of 3501-> 4500 as the high point, while the medium depicted as 2,501-3,500 is followed by the lower levels of 1-2,500 mw. Of great importance is the large concentration of wind capacity volume in the 5,177 range along the north central parts of the region in Iowa and Illinois. At the same time, note also the visible presence of identical values of wind power numbering 2,987 in the northwest area (representing most notably Minnesota and Kansas). While Michigan and Indiana showed similar geographic and numeric spread evident in the south eastern part of the map, the lower numbers of wind capacity (432,549,534) seemed visibly concentrated across the eastern, north and west sides of the region made up of Ohio, Wisconsin and Nebraska (Figure 2).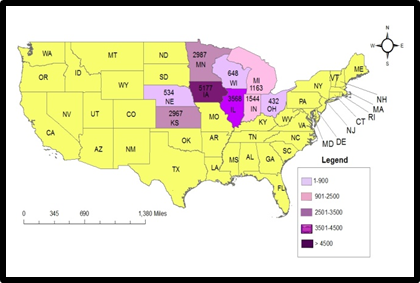 | Figure 2. Installed Wind Capacity 2013 |
With the highest number of wind turbines (estimated at 2,195, 2,124-1,729) holding steady in the north central, and western side of the region most notably Illinois, Minnesota and Kansas. It is evident that the dispersion of the lower numbers of wind turbines appeared more along the eastern and the western areas of the region representing (Ohio, Iowa and Nebraska) while the medium numbers stood firm in the eastern and north east side of the map made up of Michigan, Indian and Wisconsin (Figure 3). Regarding wind projects and capacity generated in 2004, there exists a widespread concentration of these variables at much higher levels (198-101 to 615-631) in the north east, and the central areas of Minnesota and Iowa compared to the other states of the region represented in the map. The eastern side not only emerged as the area with lowest levels of wind capacity generated, but note also the sketchy presence of states with projects on line stretched across the west, east, central and southern portions of the map (Figure 4). 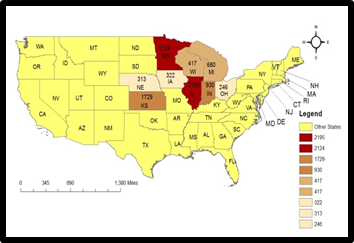 | Figure 3. Installed Wind Turbines 2013 |
 | Figure 4. Wind Project Generated Capacity 2004 |
From the distribution of the rankings, it is evident that high levels were prominent along the north central and the north east areas (Figure 5). This seemed different from the emerging patterns of electricity generated while Minnesota and Iowa in the North Central and Kansas in the West outpaced the others in the various states (Figure 6). This was followed by a few patches of areas coated with solid percentage distributions intact. Additionally, total energy consumed on the other hand seemed more in the western states of the region where Nebraska and Iowa in the north central did stand out when compared to the other states as the most energy intense per capita (Figure 7). The same can also be said of the spatial patterns of wind energy projects online which showed robust presence on the northern areas of the map in Minnesota, Michigan and Ohio (Figure 8). In terms of the distribution of necessary wind power to meet electricity needs based on number of times, the western part of the region in Nebraska and Kansas and Iowa and Ohio in the east not only showed more concentration of that element in 2013 as the maps shows, but they did surpass the other states (Figure 9).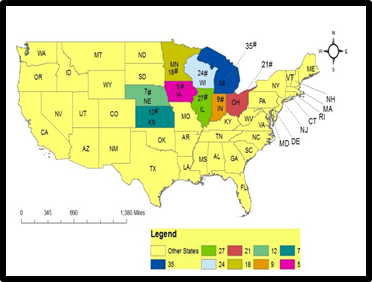 | Figure 5. Rankings of 9 states 2011 |
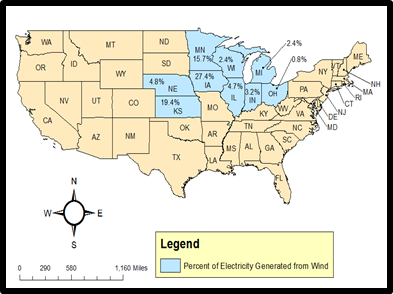 | Figure 6. Percent of Electricity 2013 |
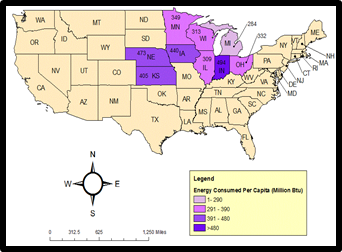 | Figure 7. Total energy Consumed per capita 2011 |
 | Figure 8. 2011-2014Wind Project Online |
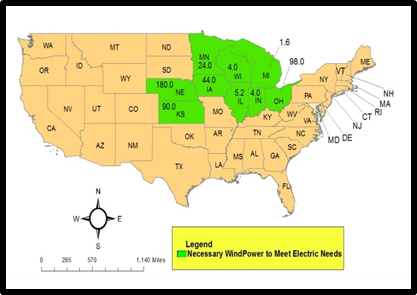 | Figure 9. Wind Power to Boost Electricity Supply in 2013 |
Again wind power in Iowa, Kansas, Illinois, and Minnesota, on the west, central and eastern area of the map accounted for much of the water saved estimated in billions of gallons (Figure 10). The map shows that Iowa, Illinois, Minnesota, and Kansas outpaced the rest of the states in the annual amount of air borne carbon dioxide taken out of circulation due to wind power infrastructure (Figure 11). While capital investment patterns shows robust presence in Iowa, Minnesota and Illinois and Kansas (Figure 12), the number of wind power facilities which seemed spread across the study area maintained a large presence in the Michigan area, followed by Illinois, Wisconsin, Minnesota. With all that, the spatial concentrations from the former based on the numbers surpassed those in Iowa, Nebraska, Indiana, and Ohio (Figure 13).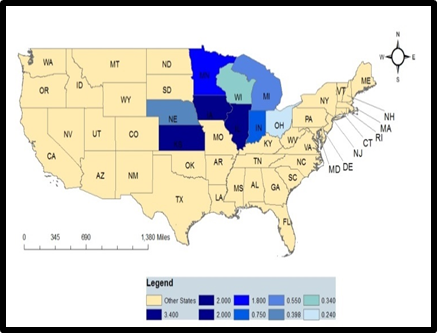 | Figure 10. Annual Water Savings from Wind Power in Billion Gallons |
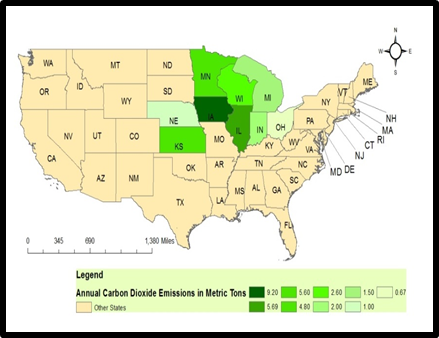 | Figure 11. Annual C02 Emissions Contained from Wind Energy in Metric tons |
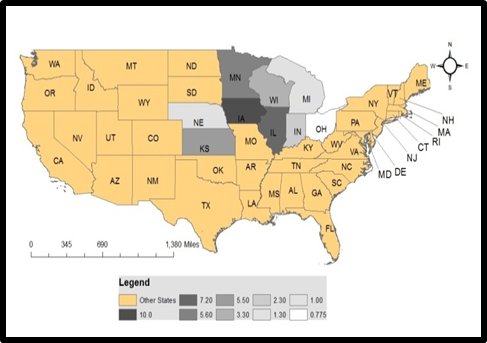 | Figure 12. Capital Investment in Billions Dollars |
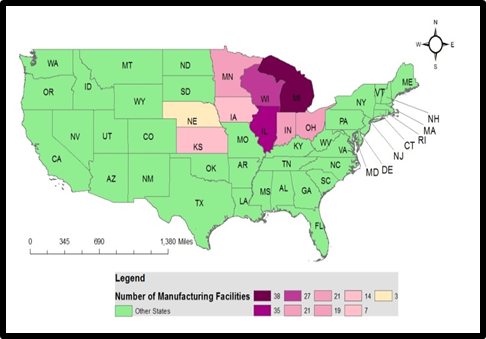 | Figure 13. Number of Manufacturing Facilities |
4. Discussion
From the analysis herein, the study area showed a growing presence of wind power indicators in terms of generated capacity, production and installed facilities as well as some changes in growth rates in the different states over time. This is attributed to incentives driven by several socio-economic and environmental benefits that accrue the current use of wind energy. Mix scale approach of descriptive statistics and GIS highlighted linkages between various socio-economic and environmental elements and the growing use of wind energy in the nine states of the Mid-west. Added to that, the area saw the emergence of visible spatial patterns consistent with current use. Just as the GIS mapping showed visible concentration and evolution of the respective wind energy indicators made up of capacity, consumption pace, infrastructure and potentials over time among the selected states. The emerging geographic patterns which remained steady in some areas and only to change at times provided a road map and snapshots on activities of the industry in terms of production, ranking, investment, energy consumed and wind power infrastructure in the Mid-west. With more than one third of the US wind capacity located in the study area, five Midwest states generate some percentages of their electricity from wind energy, out of only nine states nationwide. This is significant considering the relevant roles of wind energy in the areas of water conservation and CO2 emission abatement. Such observation is significant in the wake of rising costs of fossil fuel and fluctuations in the market place and the growing prospects of wind power in the region over time. The geography of wind power in the area also centers around the fact that among the states, Iowa stands as the third largest producer of wind energy in the US and it is only second to two other states. With all these potentials one needs to bear in mind the increasing economic and environmental benefits that accrues wind energy power in the region. With socio economic spillovers from job creation, facility design, and income generation from land leases, millions of homes in the nine states of the study area from Michigan to Kansas get their electricity generation from wind power.Furthermore, wind power farms and infrastructure in the region not only showed some consistency in Iowa, Kansas and Nebraska. Michigan followed up ahead of the others in wind installed capacity and turbines. Pertaining to the percentages of change in generated capacity, the most notable increase in states with bigger numbers stems from the 10-5 to 48.1% upsurges for Iowa from 2002 to 2006. Added to that are the consistent growth rates of 39.1-41.7% and the over 20 percentage increases in 2004/2005 and 2005/2006 for Minnesota. There was also notable upswing pertaining to wind turbines amongst some of the states. The same can also be said of wind power potentials involving percentage of electricity generated from wind power, homes dependent on wind power coupled with the success of onshore wind power. With the growing pace of wind generated capacity and energy production, the frequency of wind energy usage even though steady in Iowa, Kansas, and Minnesota, were of medium levels in other states but relatively minuscule in Ohio. In terms of factors, the economic significance of wind power growth in some states of the Mid-west in the context of usage stems from its contributions to the fiscal wellbeing of the region. The economic benefits of wind energy not only stands out, but remains visible given the growing number of jobs being created for the citizens as well as capital investment injected into the area. There is also the value of land leased and the growing number of wind power facilities in the sector springing up in the area. The fact that all these involved the infusion of tax revenues and the creation of capital adds to the continual development of counties and cities in the individual states of the region. In other words, remote locations of the states that were unheard of before are now sites of wind energy production and infrastructure development to the benefit of the mid-western region across time and space thanks to local planning and the activities of institutions. Considering the mounting environmental liabilities associated with conventional energy sources today and the way it has impacted communities in the Midwest. The environmental benefits of wind energy in the study area based on the analysis, are numerous and not farfetched. The benefits come in the form of the billions of gallons of water being saved annually, the capacity to mitigate the concentration and emission of carbon dioxide coupled with a vast number of automobiles taken off the road. This is relevant in the context of regional environmental protection and natural resources management in a geographic area saddled with environmental issues from automobile manufacturing and heavy industries, acid rain and others and the fact that it takes over 100,000 gallons of water to manufacture a car. Additionally, in the age of climate change and the global warming impacts on the environment, preventing CO2 concentration in the atmosphere not only eases ecological discomfort for different life forms in both the built and natural environments of the area, but it does enhance environmental quality. Given the novelty, the limitations and impacts of wind power, the paper suggests the need for wind energy education and enlightenment campaign, the strengthening of current policies and the design of regional energy information system to sustain decision making and the continual use of GIS in the process.
5. Conclusions
This study highlighted the geographic evolution of wind energy in several states of the mid-west region of the United States with some illuminating results: a) Wind power emerging as an alternative source of energy; b) Wind energy’ growing potentials evident in the Mid-west; c) Current national policy not benign to the sector; d) Mix-scale approach very viable in pinpointing the dispersion of wind energy using GIS; e) The growth in wind energy shaped by host of factors. Clearly stated, the steady emergence of the wind energy sector over the years in the Midwest region has shown some added advantages. Notwithstanding the limited use of wind power in the country, it remains an alternative source of energy with valuable use in the Midwest. In fact, the data on wind generation potential in 2013 not only indicated increasing reliance on wind powered electricity, but much of the percentage of electricity produced were evident in Iowa, Kansas and Minnesota at 27.4 to 19.4 and 15.7. Further dependence on wind energy is manifested by the millions of homes on wind power across the region (in Kansas and Minnesota, Indiana and Michigan, Illinois and Iowa and those in others states like Nebraska, Ohio, and Wisconsin). Accordingly wind energy has seen increased demand from users in an age in which fossil fuel dependency continues to generate environmental and economic discomfort to citizens and communities. Having seen the major potentials in wind energy and the growing infrastructure in the sector, the Mid-west region saw speedy growth in wind energy use with the increasing generation of electricity from it. The same can be said of the regional trends in installed and generated capacity, the amount of energy produced, the number of turbines, the economic factors of jobs, investment, and the number of facilities. Furthermore, the ecological benefits are quite enormous with water saving capability, CO2 emission reduction capacity which translates into millions of cars off the road [3]. These factors reinforce the promise of wind energy planning in the region. The ability of this research in highlighting the growing role of wind power in the Midwest provides a frame of reference for many stakeholders including communities and policy makers and investors interested in seeing the sector as the alternative to fossil fuel. The expectation is that it provides an opportunity for strengthening the growing call for an alternative source of energy and the emergence of wind power as a dependable substitute in the policy framework of the region and the US. With wind energy’s growing potentials as manifested across the Midwest region. The percentages of change in wind generated capacity for the study area was stable in some periods but showed continual growth with notable increases in all five selected states of Iowa, Kansas, Minnesota, Nebraska, and Wisconsin between 2002-2006. The most visible rise in the states with bigger numbers stems from the 10.5 to 48.1% increases for Iowa from 2002 to 2006. Added to that are the consistent growth rates of 39.1-41.7% and the over 20 percentage increases in 2004/2005 and 2005/2006 for Minnesota. Based on the wind energy indicators as seen in this study, there is a growing frequency among some of the states especially Iowa, Kansas and Minnesota. While these three states outpaced the others, the next group of states (most notably (Illinois, Nebraska, Wisconsin and Michigan) had wind generated capacity and energy production lower than the former. For a profile of the temporal distributions note that between 2002 through 2003, the state of Iowa saw its wind capacity go from 416 to 460 mw and in the following periods of 2004 through 2005 and 2006 it jumped to 632 and 936 mw respectively. Elsewhere, the state of Minnesota on the other end started with 312 mw in 2002 and 2003, and in 2004 the capacity generated reached 434 to 615 mw. In the ensuing years (2005-2006), note that the wind generated capacity rose by 745 mw to 895 (Table 2). Regarding energy production, Iowa not only overtook the others with 919-982 and 1178 GWh in 2002, 2003 to 2004. In 2005 to 2006, energy production for the state rose by 1679 -2139 GWh. Additional evidence of wind power significance from the results of this research involves the position of two states in the region in a nationally ranked table of installed wind power. The table shows Iowa and Illinois with 5178-3568 in installed wind power respectively. Being listed among the first five states behind Texas and California with 12,355 to 5830, the installed wind capacity for the two Mid-western states surpassed Oregon whose capacity stood at 3,153 mw. This is somewhat similar to the percentage of wind energy generation in 2013 in which the three states of Iowa, Kansas and Minnesota finished among the top 5 in the country. Amongst these areas, Iowa was responsible for 27.4%, Kansas and Minnesota had 19.4 to 15.7% respectively. Turning to wind power farms in the country, Fowler Ridge farm Indiana was ranked 7th among the top 10 with 600 mw in capacity generated as well (Table 6).Aside from the growing potentials in the Midwest, the current policy toward wind energy industry has not been a benign one given the inherent lapses and lack of credits. This does raise the question as to when would policy makers in the US energy sector take advantage of the growth potentials in wind power and promote regulations capable of putting wind energy on comparable footings with the petroleum industry. The expectation is that as shown in the paper, those charged with the task of shaping a sustainable energy policy are afforded the opportunity to track the potentials of the sector. This is extremely important at a time when many feel that the inability of the Congress to formulate a long term renewable energy policy has been a detriment to the development of wind power. Considering that whenever credit expiration period kicked in, wind power development activities slows the next year. This uncertainty forces investors to wait until better conditions emerge before committing their assets. Such level of credit and market uncertainty are avoidable had decision makers been aware of the regional potentials in wind power as shown herein. While such doubts among investors in the market impedes wind power development activity. Without pointing it out as shown herein, policy gaps hampering the sector go undetected at the expense of much needed expansion of the industry. Therefore the belief is that this research would boost the schemes of policy makers and their willingness in assessing the needs of wind power so that the industry will remain relevant in the search for sustainable renewable energy policy in the country. Furthermore, the applications of mix scale methodology (connected to GIS and descriptive statistics) as investigative device did stand out. Utilizing a mix-scale approach of descriptive statistics and GIS mapping as operational tools added additional insight to the regional assessment of wind power use. The model was quite effective in defining the study area and identifying the trends, coupled with the compilation of information on the factors and host of variables from wind energy use, installed wind capacity, number of wind turbines and others including the economic and environmental benefits in the region. This method remains very essential in serving the needs of scholars embarking on geo-spatial assessment of the trends in wind energy research in the Midwestern region. Furthermore the spatial mapping of the trends which involves GIS analysis points to visible concentration in areas where usage has been growing over the years. Accordingly, the GIS mapping as a management tool remained quite valuable in showcasing the dispersion of wind power indices, the pace of their diffusion and the extent and form of their evolution across space. This benefit represents a major step towards effective planning and improvement in current policy which does not seem to have fully noticed these potentials in the Midwest. From the analysis, the mid-west region experienced visible patterns of changes in the spatial concentration of wind energy trends between 2004 through 2014. While these patterns are indicative of the continuous evolution of wind power in the Midwestern region of the country, their emergence could not have happened without the role of socio-economic and environmental factors in the region. From the mappings, variables located within the wind energy industry showed patterns consistent with continual usage over the years. The capability of GIS in pinpointing the varying patterns of usage and infrastructure presence and potentials over the years is quite essential as the states come to terms with the mounting demands for wind power and its economic and ecological benefits. Identifying these potentials enhances the capability of decision makers and agencies in prioritizing wind power as vital component of policy intervention given current inaction from congress. In that light, the model provides opportunity for showcasing the state and potentials of wind energy performance and activities in the Midwest often overlooked in the policy arena whenever credits for further expansion are sought. Thus the practical applications of a mix scale approach involving spatial mapping along with wind energy index as a tool, improves our understanding of the state of the industry in the literature. This quickens the decision making and much needed knowledge for managers in framing future debates and requirements of the sector in the mid-western region. Additionally, economic and physical elements located within the larger wind energy industry are crucial in the evolution of the sector over the years in the Mid-west region given their benefits in the daily lives of the communities. This not only reiterated the importance of socio-economic and ecological factors in the region’s wind power operations, but also it does indicate the extent to which community needs from housing, environmental quality and employment are served by wind energy industry. While the economic benefits of wind energy in the Midwest region is quite compelling in the face of continued growth over the years with the generation of numerous employment opportunities numbering 17,000 in 2013. There were also investments in capital stocks and the rapid expansion of new wind energy facilities in the sector. This can be demonstrated by the addition of hundreds of manufacturing facilities and over $31 billion in capital and $59 million plus in yearly land lease deals to sustain the design of wind power infrastructure in the Midwest region. Just as the Midwest region added about 185 manufacturing facilities within that period. The breakdown of employments generated through wind energy by the states shows thousands of jobs in such places as Wisconsin, Illinois and Kansas, Michigan, Ohio, Minnesota, Iowa and Nebraska. The environmental benefits of wind power in the Midwest region has also been felt in each of the states under analysis. These benefits which ranged from billions of gallons in conserved water, containment of carbon dioxide emission and many cars off the high ways are indications of best practices synonymous with the wind power industry. In a time of continual water stress in different places, the thought of saving 13 billion, 478 million gallons in conserved water is a great advantage to agriculture rich Midwest when people in the west face water rationing and deficits. With the threats of climate change impacts on the environment evident, the role of wind energy practices in shielding the states from the emission and discomfort of 43,160,000 metric tons of carbon dioxide that never made it into the atmosphere is a welcome development and major contribution to mitigation efforts in regional environmental protection. Being a heavily endowed area with great potentials in wind energy, the benefits as shown herein (water conservation, fuel saving, and climate change mitigation role, and job generation) remain relevant. Making citizens aware of these benefits provides opportunity for understanding wind power and its significance in public discourse. Given that the study showed the factors fuelling the adoption of wind energy and the attendant ecological and economic benefits and the ability to touch many lives in millions of homes in the region did reiterate its overwhelming significance in transcending the human-nature interface debate which should not be overlooked. Highlighting such inter-linkages from ecological and economic perspective on the mid-west region and given its omission in the literature, the approach as presented here did inject the wind power industry side of it into the front pole in current research. Without such complete analysis in this enquiry focusing on human-nature inter-linkage, there would have been little appreciation of the influence of wind energy in the daily lives of citizens in the region. With the research focus on wind power potentials, the outcome herein will influence to some extent how regions and decision makers plan and respond to environmental and socio-economic benefits of alternative energy in the region. The compilation of the environmental and economic indices and benefits of wind power herein is not only a critical tool in policy by challenging current practices. It makes citizens and industry become better stewards of the environment, by instilling best management practices for sustaining renewable energy policy in the face of current trends. Accordingly, echoing these benefits in wind power epitomizes alternative approaches to creating jobs and ways of going about climate change mitigation and environmental conservation in the region.Having seen the socio-economic and ecological factors associated with wind power adoption in the region, the research for that reason generated a pathway for tracking these elements as outlets for improving our understanding of their benefits in the context of much needed mitigation and conservation strategies. Decision makers in that setting are afforded ample opportunity to evaluate these attributes across time by gauging their benefits with commitment towards abatement of risks to the ecosystems of the mid-west region. As a move cantered on promoting conservation and ecological protection, highlighting these factors, hastens the effectiveness of policy makers in quickening the adoption of wind power with sustained infrastructure in the mid-west. This would allow states and communities and the federal government design the right measures for adopting them and sustaining the sector. The fact that inactions can roll back the benefits herein identified does make the analysis an emerging contribution for assessing wind power in states heavily endowed with the resource. In that light, this research offers decision makers an improved understanding of unknown benefits of the sector that may help shape economic and environmental planning in foreseeable future in the region and this should no longer be overlooked. Taking into account the growing energy needs of the country and the rising potentials of wind power in the mid-west region in particular and the problems posed by conventional reliance on fossil fuel, the resultant climate change threats and the benefits that accrue many communities from adopting wind power and what emerged from this study. Decision makers and county planners in the region would be tasked in the periods ahead to seek urgent responses to many pertinent questions that are central to the future of geographic dispersion of wind energy planning. The questions involve which other future ecological and economic benefits are to emerge from wind power use in the Mid-West region? How would these benefits be measured? What scale would the geographic concentration of wind power infrastructure assume in the area? What factors are likely to influence the adoption of wind energy? What role will private and public agencies play in that regard? Seeing the framing of these questions, there are ample probabilities from all these for the academic community and policy makers to redirect the strategy on wind power with policies emphasizing quick credits’ access for investors involved in infrastructure development in the decision making process. This will enable the industry fulfil the national mandate on sustainable renewable energy with good results in the years ahead. To that end, the paper suggests the need for education and enlightenment campaign on wind power for the general public and decision makers, more use of spatial analysis and the design of a regional wind energy information system.
ACRONYMS
References
| [1] | Merem, E.C. (2015). The Geography of Wind Energy In The Midwest Region of The United States Using GIS Analysis. Proceedings of the 11th International Symposium On the Recent Advances in Environmental Health. Jackson: Mississippi. September 2014. |
| [2] | United States Department of Energy. (2012). Various Years Census Data: County Highlights. Washington, D.C:US DOE. |
| [3] | S. British Petroleum. (2012). Statistical Review of World Energy. London, UK: British Petroleum. |
| [4] | American Wind Energy Association (AWEA). (January 2013). AWEA 4th Quarter Public Market Report. Washington, D.C: AWEA. |
| [5] | World Wind Energy Association. (2010). World Wind Energy Report. Bonn, Germany: World Wind Energy Association. |
| [6] | Energy Information Administration. EIA (2014 march 24). Electric Power Monthly Report. US DOE. D.C: Washington. |
| [7] | Gerhardt, G. (2013 January). Wind Energy Gets a Boost off Fiscal Cliff Deal. Earth Island Journal. 07:1-1. |
| [8] | Cardwell, D. (March 2014). Wind Industry’s Technologies Are Helping Compete it Compete On Price. New York Times. |
| [9] | American Wind Energy Association (AWEA). (2014 March). Wind Generation Records. Washington, D.C: AWEA. |
| [10] | American Wind Energy Association. (2013). State Fact sheets: Wind Energy Statistics. Washington, D.C: AWEA. |
| [11] | Energy Information Administration (EIA). (2014). United States: State Energy Estimates. Washington, D.C: US DOE. |
| [12] | Vick, B. (2008). Analysis of Wind Farm Energy Produced In The United States. Washington, D.C: USDA-Agricultural Research Service. |
| [13] | United States Geological Services (USGS). (2014). Energy Resources Program: Wind Energy. Retrieved 23rd June 2014 From http://energy.usgs.gov/OtherEnergy./windEnergy.aspx. 1-2. |
| [14] | Midwest Wind Energy Foundation, (2014). Wind Energy Information. Retrieved 23rd June 2014 From http://windenergyfoundation.org/wind-atwork/wind-your-region/midwest 1-3. |
| [15] | Whelan Energy Center. (2013). Wind is Power: Promoting Wind Energy To Save Water In The Mid-West. Retrieved 23rd June 2014 From http://windiswater.org/page 2. |
| [16] | Hahn, M. (2014). Offshore Wind Market and Economic Analysis. Burlington, MA: Navigant Consulting Inc. 1-160. |
| [17] | Merem. E.C., & Twumasi, Y.A.. (2005a). GIS Applications in Land Management: The Loss of High Quality Land to Land Development in Central Mississippi. The International Journal of Environmental Research and Public Health. 2:2:234-244. |
| [18] | Usery, E.L. (2004). Geophysical Data Resampling and Resolution Effects On Watershed Modeling: A Case study Using Agricultural Non-Point Source Pollution Model. Journal of Geophysical Systems. 6:289-306. |
| [19] | Merem. E.C., & Twumasi, Y.A.. (2005 b). GIS Based Analysis of Growth Management and Environmental Decline of Central Mississippi Region. Geographic Information Sciences. 11: 2:130-137. |
| [20] | Merem. E.C., & Twumasi, Y.A.. (2006a). GIS and Remote Sensing Applications in The Assessment of Change Within a Coastal Environment in the Niger Delta Region of Nigeria. The International Journal of Environmental Health and Public Health. 3:1:98-106. |
| [21] | Merem. E.C., & Twumasi, Y.A.. (2008). Using Spatial Information Technology as a Monitoring Device In International Watershed Conservation Along The Senegal River Basin of West Africa. International Journal of Environmental Health. 5:464-476. |
| [22] | Merem, E.C. (2011 a). Using Geospatial Information Systems in Analyzing Urbanization Impacts on Stream Habitats in Southern Mississippi Coastal Ecosystem. Journal of Environmental Science and Engineering. 5:12:1624-1641. |
| [23] | Merem, E.C. (2011b), Geospatial information analysis of land use impacts in Southern Alabama. Journal of Environmental Monitoring and Restoration. 7:01-25. |
| [24] | Merem. E.C., & Twumasi, Y.A. (2011c), Relationships Between Climate Parameters and Forest Vegetation at and Near Digya National Park, Ghana. The British Journal of Environment and Climate Change. 1:4: 2011-2115. |
| [25] | Merem. E.C., & Twumasi, Y.A.. (2006b). Hydro-politics, A Case of The Niger River Basin. GIS Development: Africa. 24-28. |
| [26] | Merem, E.C. (2011). Environmental Accounting For oil and Natural Gas A North American Case Study. New York, NY: Edwin Mellen Press. |
| [27] | Merem. E.C., & Twumasi, Y.A. (2010). Using GIS In Environmental Management: Green Assessment of The Impacts of Petroleum Activities In The State of Texas. The International Journal of Environmental Research and Public Health. 7:5:2101-2130. |
| [28] | Merem. E.C., & Twumasi, Y.A. (2007). GIS Applications In Global Environmental Protection: The Case of Environmental Monitoring of Fossil Fuel Emission From Oil and Gas Activities In Africa. World Resources Review 19:3: 657-680. |
| [29] | Merem, E.C, (2015). Ecosystem Liabilities of Oil and Gas Activities in Southern Nigeria, Proceedings of the 12th International Symposium On the Recent Advances in Environmental Health, Jackson MS, September 15th 2015. |
| [30] | United States Bureau of Census. (2013). Census Quick Facts. Washington, D.C: US Bureau of Census. |

 Abstract
 Reference
 Full-Text PDF
 Full-text HTML