Energy and Power

p-ISSN: 2163-159X    e-ISSN: 2163-1603

2015;  5(2): 25-31

doi:10.5923/j.ep.20150502.01

Investigating Peak Power and Energy Measurements to Identifying Process Features in CNC Endmilling

Andy Simoneau, Jonathan Meehan

Department Mechanical Engineering, University of New Brunswick, Fredericton, Canada

Correspondence to: Andy Simoneau, Department Mechanical Engineering, University of New Brunswick, Fredericton, Canada.

Email:

Copyright © 2015 Scientific & Academic Publishing. All Rights Reserved.

Abstract

Energy costs associated with manufacturing processes represent an expense currently beyond the control of manufacturers. As a result, many industries have begun to consider how to reduce energy consumption demands while still maintaining or increasing process efficiencies. All manufacturing processes have an associated energy cost. For machined parts, individual processes used to machine the overall part have measureable energy costs associated with them. Properly linking peak power and energy consumption with machining processes requires characterizing the machine tool and machining process with respect to measured power. By doing this, process specific features can be linked to elements of the resulting peak power of the machining process. Building off previous works in characterizing power consumption with respect to material removal rates (MRR), the current paper examines peak power and energy consumption during the endmilling of two standard test parts. Using direct measurement techniques and a predefined geometry of two test parts, peak power is measured for a CNC machine tool and the machine spindle. The resulting power signals are shown to be sensitive enough to be linked to process changes and process features that occur during the machining process. Power and energy data is linked to the metal cutting process and linked to the identification of process changes, with specific changes in the power measurements linked to cutter location and process features.

Keywords: Machining power, Power monitoring, Energy consumption, Metal cutting

Cite this paper: Andy Simoneau, Jonathan Meehan, Investigating Peak Power and Energy Measurements to Identifying Process Features in CNC Endmilling, Energy and Power, Vol. 5 No. 2, 2015, pp. 25-31. doi: 10.5923/j.ep.20150502.01.

1. Introduction

Recent reports have shown the manufacturing sector to account for as much as 30% of the energy used in the United States [1]. Public awareness has begun to put emphasis on more environmentally friendly production practices as the impact of continued industrialization and growth becomes more apparent. Social pressures and the growing costs of energy generation have caused manufacturers to become more interested in understanding and quantifying the impact of power and energy. Of course the intent relates to their specific manufacturing or machining processes, with the goal of ultimately improving energy efficiency. The first step to increasing energy efficiency is to obtain an understanding of the process energy consumption characteristics for specific machining practices. This can be achieved by using very specific machining processes and monitoring the overall machine tool (MT) power along with other components such as the machine spindle and possible the feed drives and other auxiliary equipment. The results from the peak power measurements can then be related back to the machining processes and specifics of the machining process derived from the resulting power signals and energy analysis.
The aim of the research presented in this paper is use direct peak power measurement of the total machine tool and machine spindle to identify process conditions and potential process outcomes. Changes in the cutting process as a result of intermittent cutting are used as a basis for determining the suitability of peak power and spindle power signals as an effective tool for identifying process changes and potential impact of tool cutter path. Only the endmilling process on a 3-axis CNC milling machine is highlighted in the current work. However, use of identical techniques and methods for monitoring other MT elements and the total power draw of the MT over the course of an entire production cycle is plausible.

2. Literature Review

Early studies conducted in the 1980’s, by De Filippi et al. [2], found that the largest loss of efficiency in machining was due to underutilization of the machine tool (MT). As a result, researchers focussed their efforts on developing models to predict and assess the energy consumption characteristics of various MTs. Avram and Xirouchakis [3] developed a program to predict the mechanical energy requirements of the spindle and feed axis drives in machining based on computer aided design and manufacturing (CAD/CAM) part files. The program utilized tool path information, tool geometry, and cutting parameters to mathematically calculate the theoretical and mechanical energy required to generate the desired part. The major limitation to this method is that mechanical power requirements differ from the electrical power requirements, and the model could not account for electrical or mechanical losses in the system.
Using the theory of specific energy consumption (SEC), Kara and Li [4] developed an empirical model to predict energy consumption in MTs. SEC is defined as the energy consumption required by a MT to remove 1 cm3 of material, which is dependent on material removal rate (MRR) and the workpiece material itself. The SEC method does not take into account the energy consumed outside of the cutting process (i.e. setup, standby, positioning, and coolant), but Kara estimated these processes to be less than 10% of the total process. The model is MT specific and highly dependent on process parameters (i.e. feedrates, cutting speeds, etc.), which could limit its practical large-scale implementation. The work was further developed by Diaz et al. [5] to incorporate energy consumption predictions for tool paths with varying MRR. Diaz reported that the model obtained an average accuracy of 97.4%, but the model still neglected energy consumptions that occur outside of the cutting process. Bi et al. [6] developed energy consumption prediction models, and used them to reduce power consumption and obtain an optimal set of machining process parameters.
More recently, a surface roughness prediction model has been added, as an input to the previous model to obtain a minimum level of surface quality. The results were highly MT and process specific which limits their ability to be practically implemented [7]. Rather than developing predictive or idealized models, recent research has focussed on actively monitoring energy or power consumption. Most of these monitoring techniques decompose the power signal into variable and constant components, with some techniques including sub-components associated with process status (i.e. setup, standby, etc.) [8]. One such technique, developed by Behrendt et al. [9], compares the energy consumption of various MTs by measuring the power consumed to produce a standard test part. The power signal is decomposed into three components: idle, run-time, and production. The idle and run-time components are constant energy draws associated with the initial powered state of the machine and the auxiliary systems used during cutting respectively. The production mode is the variable energy signal associated with the actual material removal process and is dependent on the load being placed on the machine. With a standardized procedure developed and performed on several MTs, the average power consumptions of each MT were compared. The power consumption varied greatly and it was concluded that a standard practice of assessing and publishing MT energy consumptions, would be beneficial to the industry. An online energy consumption and efficiency monitoring method for turning, which measures the input power to the MT only was developed by Hu et al. [10]. Decomposing the power signal into its constant and variable consumption components, the constant energy consumption was determined in advance of any operations and stored in a database, while the variable components were estimated using the spindle power signal, measured in real-time. It was concluded that reducing the MT idle time and optimizing cutting parameters to minimize cutting time would reduce energy consumption. Power consumption of a MT under drilling, face/end milling, and deep-hole drilling conditions to assess the potential reductions in energy consumption was examined by Mori et al. [11]. It was found that by utilizing the maximum practical values for cutting conditions and effectively reducing the process time, a reduction in power consumption in both drilling and milling could be realized.
In 2011 the state of energy efficiency research versus energy consumption challenges faced by industry was examined. The comparison found a wide gap between what academic and research literature was able to address and report versus what industry could actually implement. The comparison highlighted the importance of integrating enhanced management with energy efficiency concepts and technical considerations, and it was suggested that further research be based on collaboration between industry and academia [12].
Characterisation of the endmilling process for AISI 1045 steel has been initiated to some degree in terms of the relationship of spindle power to MRR [13]. The total power of the machine tool has also been correlated with the spindle and MRR rates in order to better understand how parameters can be adjusted to improve both the energy consumption and endmilling process efficiency [14]. The use of similar techniques and methods for monitoring other MT elements and the total power draw of the MT over the course of an entire production cycle is plausible. It is anticipated that the information obtained could serve as a critical piece of a much larger framework which could ultimately be incorporated into various process improvement techniques, or energy aware scheduling systems, which are currently being developed [15-18].

3. Experimental

3.1. Machining Test Overview

In order to evaluate the suitability of using direct power measurement to identify process changes and phenomena during the cutting process a series of basic endmilling operations were used to produce two standard test parts. The machining operations used a 3/8”, 4-flute carbide endmill on an Okuma ES-V4020 3-axis CNC machine center. The workpiece material was normalised AISI 1045 steel. Both the total machine power and the spindle power were measured using a Load Controls PH-3A Power Cell and data acquisition system with a custom LabView program interface.
Prior to deciding on a machining test part geometry, consideration was given on what process changes and or features could be identified based on machine tool and spindle power readings exclusively. In order to keep the machining programs simple, straight line cuts would be employed that only relied on a single axis of motion at an instant in time. It is very uncommon to see a change in a machining speed or feedrate during a straight line cut, but cutting tool entry and exit as the tool breaks out of a workpiece are common, unique events that could be used identifiers of changes in the cutting process. As a result, intermittent cutting will be considered in the machining experiments. The power data from the machine tool and the spindle itself will be analysed not only to examine its suitability as a tool for identifying process changes, but also its viability as a tool for identifying process and part specific features that may result from the machining process such as small burrs or variability in cutting as a result of machining cuter path.

3.2. Test Part Geometries

The first test part used a series of full slotting operations to produce a cross-hatched pattern as shown in Figure 1. In all of the machining tests the cutting speed, feedrate, and radial immersion of the endmill was kept constant. The cutting speed was set to 75 m/min, the feedrate was set to 0.05 mm/tooth, and the radial immersion of the endmill was set to 100% (full slotting operation). The axial immersion was set to 0.5, 1, and 2 mm depending on which slot was being machined.
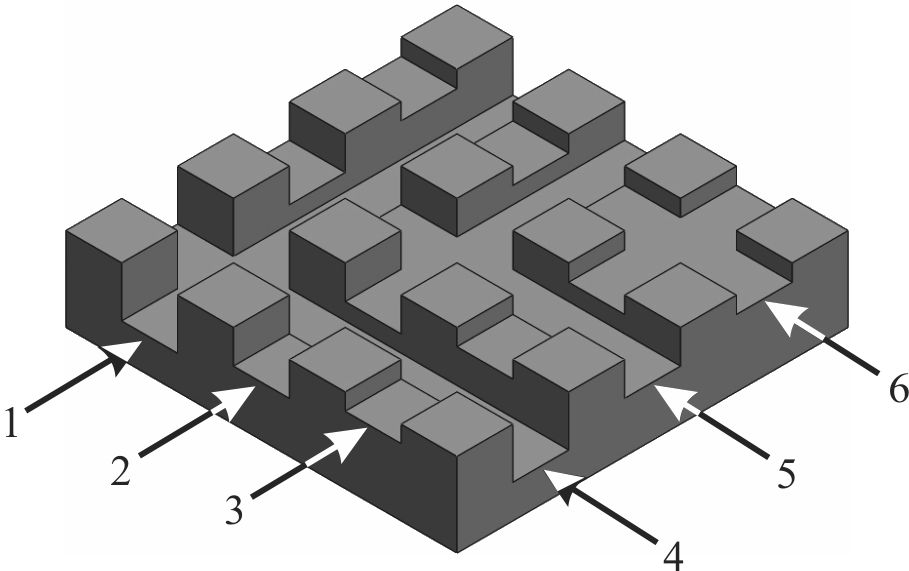
Figure 1. First test part geometry with cross-hatch pattern. The direction of cutting is indicated by the arrows
The aim of machining the first test part is to examine how sensitive the total machine tool and spindle power measurements are to variations in axial immersions. In particular, endmill breakout detection as the endmill crosses interruptions in the workpiece, and the suitability to identify process changes are considered. A second test part geometry shown in Figure 2 is a square-shaped pyramid boss. For the second test part, the endmilling operation was used to machine the periphery of the test part. Similar machining parameters to those from the first test part were employed. The cutting speed was set to 75 m/min, the feedrate to 0.05 mm/tooth, and the axial immersion set to 2 mm for all cuts.
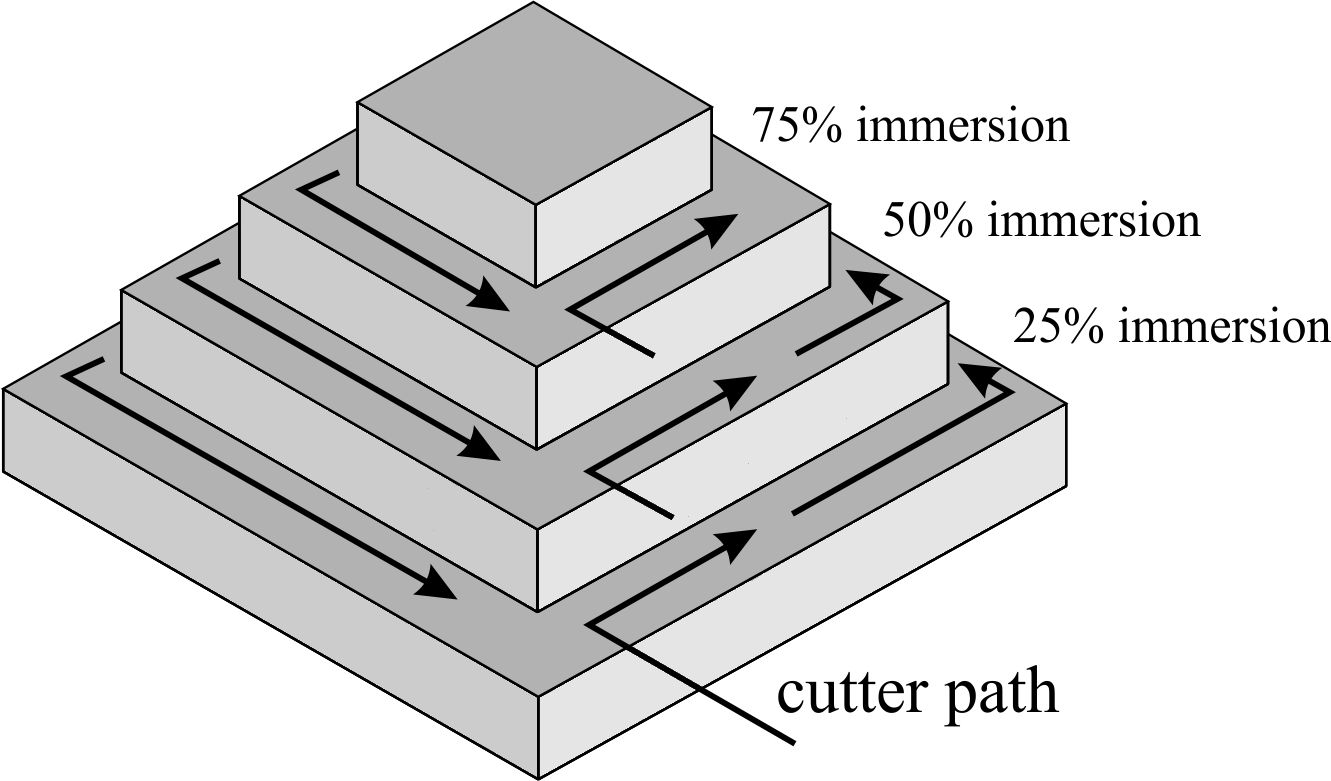
Figure 2. Second test part – pyramidal shaped boss. Cutter path and immersions are indicated
However, the radial immersion was set to 75%, 50%, and 25% at each level of the pyramidal boss as shown in Figure 2. The top of the pyramidal shape (75% immersion was machined first followed by the second and third level. This particular test part was used to determine if part or process features could be identified or extracted from the machine tool or spindle power signal.

4. Results and Discussion

Both parts after machining are shown in Figure 3. The cross-hatched test part on the right side of the image was machined from the same material test block as the second test part, on the left. For the cross-hatched test part the deep slot was cut first and the axial depth decreased, while for the square pyramid the machining paths started at the top of the pyramid and proceeded downward.
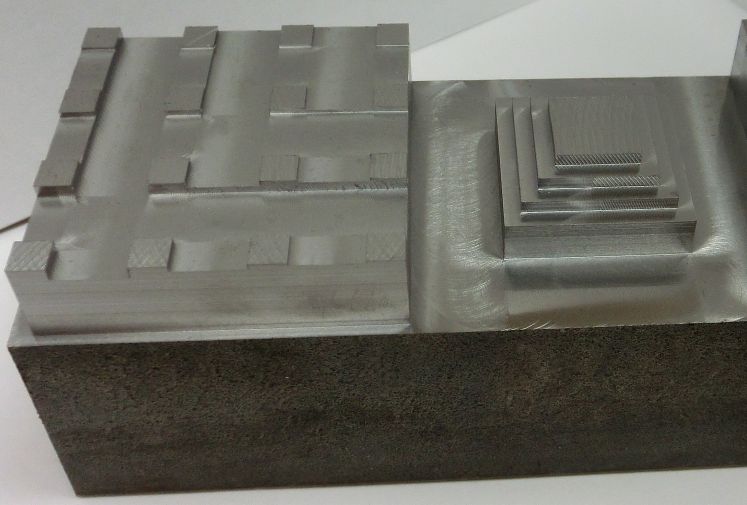
Figure 3. Final part after completing the machining tests. Both geometries were machined from the same test block
The total machine and machine spindle peak power measurements for the entire machining cycle of the first test part is shown in Figure 4. The directly measured peak power readings highlight the convenience of using power measurement as an indicator of process changes. From the experimental cutting of the first test part there is a distinct non-cutting and cutting stage that are separated by a tool change just prior to the 15 second mark in Figure 4. During the non-cutting stage the spindle power is near zero and the machine tool power is approximately at 1 kW. There are a series of peak power spikes which are a result of a quick series of rapids as the table moves into its proper home position after setup and the spindle moves into position to make a tool change. These rapids generate peak power values of 3 to 5 kW which are a result of the feed drives exclusively.
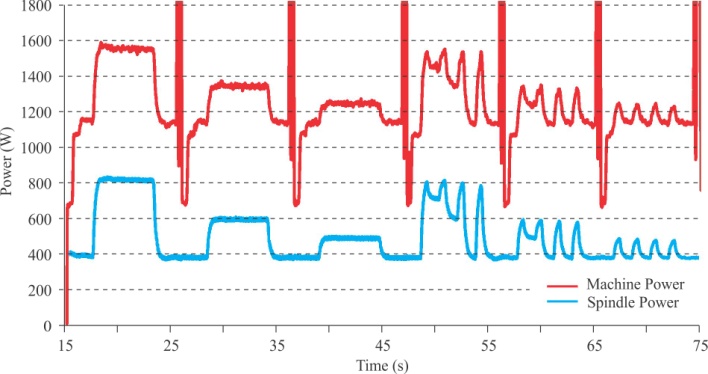
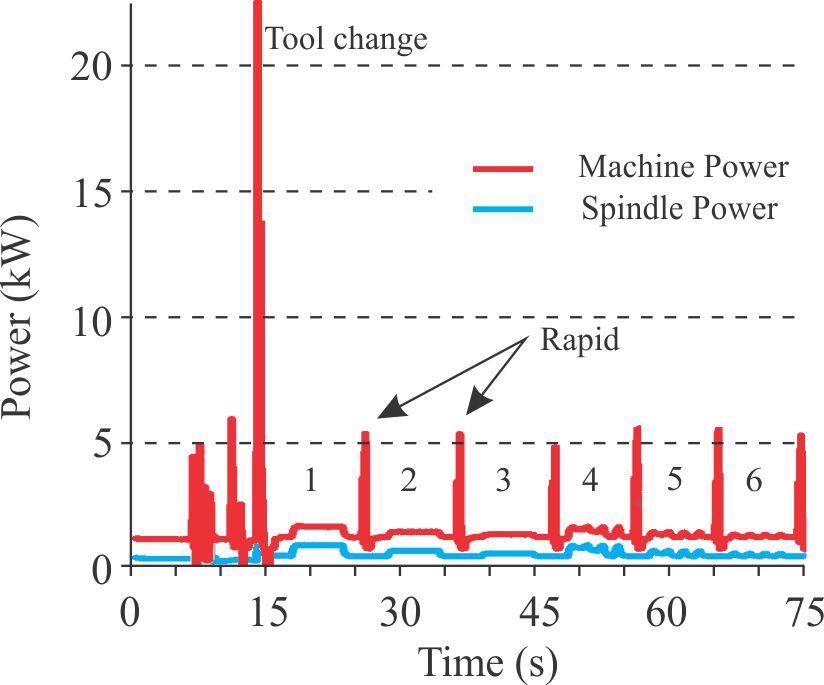
Figure 4. Total machine and spindle power measurements during machining of the first test part geometry
After the cutting tool has been loaded into the spindle, there are 6 slotting operations that were done as shown on the part from Figure 1. Each of these slots, 1 through 6, is indicated in Figure 4. Each stage or slotting operation is separated by a rapid movement of the machine as the cutting tool is moved from the end of one slotting operation to the beginning of another. Each rapid following each slotting operation leads to a machine tool peak power of just over 5 kW. The feed drives for both the x and y-axis of the CNC machine tool are rated to a maximum of 3.0 kW and the z-axis is rated for 4.2 kW. As a result, rapids between cutting slots 1 through 6 lead to a machine tool peak power just above 5.5 kW. The peak power of the machine tool is slightly above 5 kW because the machine tool peak power is a combination of the spindle and all of the feed drives. The spindle peak power when the spindle is freely spinning and not cutting is approximately 400 W as shown in Figure 5. After the endmill completes a single slot there is a rapid to the start of the next slotting operation. Rapids are done in the shortest possible time from one point to another. Thus, during the rapid movement both the x-axis and y-axis feed drives are utilized and there is a significant peak power increase. In this particular case, this increase was just over 5 kW which would be attributed exclusively to the feed drives of the x and y-axis.
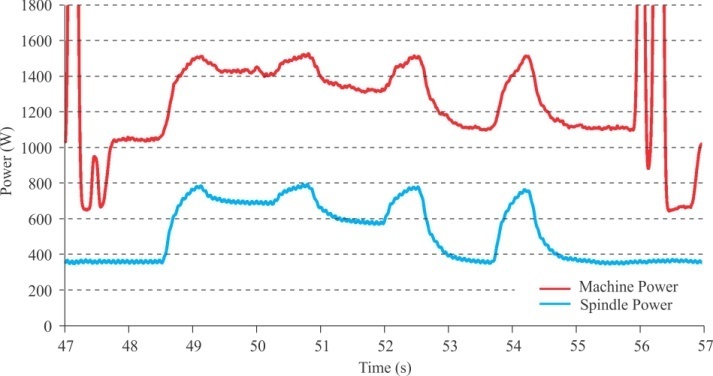
Figure 5. Closer examination of the total machine and spindle power measurements during the cross-cutting operations from the first test part geometry
Examination of the total machine tool power highlights that tooling changes, and rapids are easily identified by the sudden spike in the total power signal. Monitoring of the machine tool spindle power has been employed by several researchers as discussed earlier, and while this can be used to identify process changes, it does not present as clear an indicator as the total machine tool power. Tooling changes and rapids are tasks that will be completed by machine tools as quickly as possible which explains the sudden power increase. Therefore, this information could be used as an indicator or marker of what stage the machining process is at relative to the overall machining or part production process. The machine tool power signal can serve as a timeline of the machining process and as a gauge for machine tool maintenance, fault detection, and the identification of the exact points during the production process that potential quality control issues may arise. While the total machine tool power provides a high-level, overall view of the machining process as it relates to the machine tool power consumption, there is some questions as to how much useful information can be ascertained without considering the machine tool spindle.
Close examination of the total machine and spindle power signals during the machining of the first test part in Figure 5 and 6 shows that the signals have a near identical pattern. Comparison of the two signals also highlights the fact that there is a significant amount of energy consumed during non-cutting stages, which producers and manufacturers will need to consider if introducing some form of energy aware scheduling into their production systems. The saw-tooth power signal of both the machine tool and spindle power signals is the result of the cutting tool moving across previously cut channels. This interrupted cutting causes the power signals to go up and down as the endmill moves from a state of full slotting, exit, free-spin, and re-entry into the workpiece. It is interesting to note that the total machine tool power signal is sensitive enough to identify the decrease in required power as the endmill exits a cut into a crossing channel and the entry back into a full cutting mode. Some of this can be attributed to the setup of the workpiece in the machine tool. The part setup ensured that only one of the feed drives was ever active during cutting. In other words, either the x-axis was moving or the y-axis was moving, but never both. Therefore, only one feed drive was contributes to the total machine tool power signal. Had the part been oriented on an angle relative to the machines x and y-axis, this sensitivity may not have been as pronounced as power from both feed drives would contribute to the overall machine tool power signal. However, by having the spindle power along with total machine tool power, the loss of machining information as a result to noise or insensitivity in the system can be reduced.
A significant benefit to having both signals is that they can be practically compared to previous cutting tests and in particular, cutting tests meant to characterize the machine and spindle power consumption such as those carried out by Simoneau and Meehan [13] using the same workpiece material. If previous characterization testing has been done to relate cutting processes, tooling, and materials to machine tool and spindle power, then the information from those tests could be related back to an overall production cycle to identify specific processes.
A detailed analysis of the entry and exit conditions shown in Figure 6, has not been conducted yet, however the spindle power signal pattern closely resembles the pattern of the resultant cutting forces that is commonly observed during an endmilling operation. From the saw-tooth peak power signal, the peaks represent full slotting and a maximum axial immersion of 2 mm which corresponds to previously reported results. The valleys are the result of an interrupted cut as the endmill crosses a previously cut channel. As the endmill cuts across the channel, the only machining parameter that changes is the axial immersion of the endmill. As a result, each valley in the peak power signal also corresponds to previously reported peak power values for those same cutting characteristics [14].
Figure 6. Total machine and spindle power measurements during first slotting operation
The results from the first test part demonstrate that if previous machine-energy characterization has been done, it is possible to examine a peak power signal and identify a specific process from it. However, the machine tool power and the spindle power should both be considered in order to get a more detailed and accurate idea about the machining process that is occurring. It would be possible to consider other machine tool elements such as the feed drives and coolant pumps through direct measurement which could help to further break the machining process down in terms of peak power and energy consumption.
The machine and spindle peak power signals in Figure 7 are from the machining of the second test part. These signals highlight the suitability of using a power signal to identify machining parameter changes and machined part features. They also demonstrate the potential for linking the cutter path and peak power measurement for both pre- and post-machining analysis.
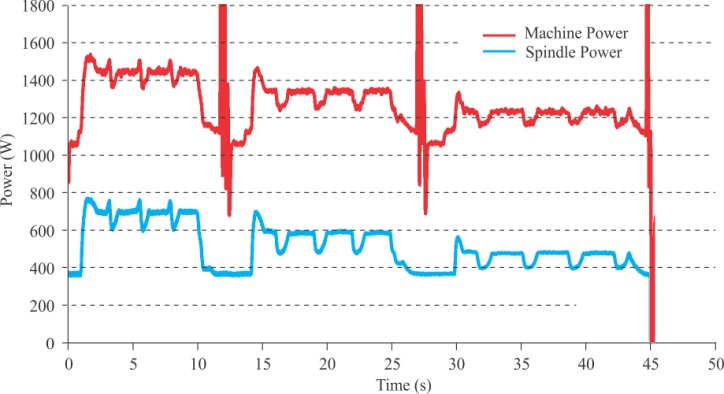
Figure 7. Total machine and spindle power measurements when machining the second test part
The peak power signal over the entire machining process consists of three primary stages which correspond to each level of the machined square-shaped pyramid from Figure 2. As in the case of the first test part, each stage is separated by a large peak power spike caused by the rapid movement of the machine to move the cutter into position to machine the next level. At each stage there are 4 intervals which correspond to each side of the test part. In every case there is a clear indicator in the peak power signal regarding the start and end of cut for each side of the test part.
At tool entry there is a large rise in the peak power of the machine and spindle. This is due to the cutter path as the tool enters the workpiece. The immersion at the initial start of cutting is slightly larger as the first side of the pyramidal shape is machined. The immersion at tool entry for each machined layer of the second test part is 25% larger at the very start of the first side to be machined. The initial peaks at entry represent the peak power for 100% (full slotting), 75%, and 50% immersions while the actual programmed radial immersions are 25% less. This explains why for the second and third levels, the initial peaks match the previous machined layers baseline peak power.
The peak power decreases for each stage as a result of the decreasing radial immersion which corroborates with previously published results [13]. There is also a difference in the amount of time required in order to machine all four sides for each stage. In the first stage the cutting time based on the peak power signals was approximately 9.25s, with the second and third stages being approximately 11s and 13s, respectively. As each side of the pyramidal boss is machined, there is a distinct drop in the peak power signal. This drop is a result of the cutting tool partially breaking out or exiting the workpiece and a very brief pause for an instant as the tool ends its movement in one direction and subsequently changes direction to machine the adjacent side of the test part. As anticipated, the magnitude of this power drop is the same in all cases, approximately 100 W. As the next side of the pyramid shape is machined there is a subsequent increase in power consumption. The rate of the power increase is different in each case and is a result of the immersion and tool geometry. Using a four-flute endmill, at an immersion of 75% and 50%, there will always be a cutting edge engaged with the workpiece. The rate of the power increase will be higher for a larger radial immersion. At 25%, there will only be one flute engaged with the workpiece at a time and thus the rate of the power increase and magnitude are smaller.
Comparison of the peak power signal from the machine and machine spindle for all three stages (layers) of the pyramid test part highlights how peak power measurements can be used to identify part or process features. During the first stage there is a small power spike at the end of the first three cutting intervals right before the power drop as the cutting tool partially breaks out of the workpiece and changes direction.
The small peak power increase is due to a small standing piece of work-hardened material that forms as the endmill reaches the end of one interval. Since the actual radial immersion never increases and will actually decrease as the tool reaches the end of its planned motion, the peak power increase must be the result of a the small standing burr or piece of material that will form when the radial immersion exceeds 50%. This phenomenon is shown in Figure 8. As the endmill begins to exit the workpiece material there is a small, standing piece of material that will work harden and bend away from the endmill slightly (similar to the formation of a burr) as the end mill advances to its prescribed position at the end of an interval. The small, work hardened material occurs towards the back half of the endmill and will be slightly stronger than the rest of the bulk workpiece material as a result of material work-hardening which can occur along the machined surface of a steel workpiece. As a result, when the endmill removes this standing piece of material there is a slight increase in the peak power. This peak power spike was not observed at 50% and 25% radial immersions because this standing piece of material will not be present.
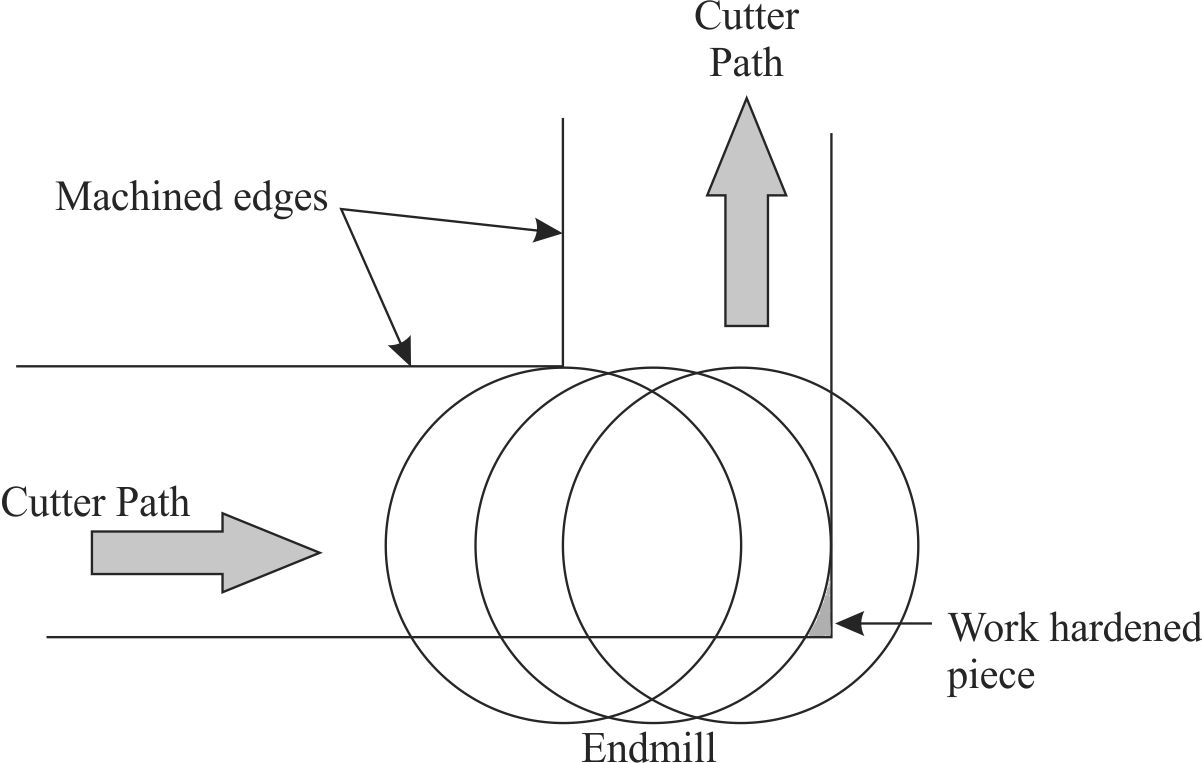
Figure 8. Endmill cutter path and the resulting work-hardened material that forms as a result of cutter path, tool geometry, and workpiece material behaviour
The small amount of work hardened material was discernible from the peak power measurements. It is currently unknown if this would always be the case such as when considering larger tooling for roughing operations. It would also be of use to examine the actual work-hardened material prior to removal and correlate a change in the material strength to a prescribed increase in required machine and spindle power.
The cutting parameters used in the current set of experiments more closely resemble a finishing operation. However, it is surprising to see that not only does the spindle power measurement (and the subsequent machine tool power) identify the presence of this small work-hardened piece of material, but that this small piece of material actually causes a near 100 W spike in the power signal. Specific elements of a machined part could be determined based on a peak power signal if the power characteristics are known for a machine tool, workpiece material, and tool combination. At the same time, certain characteristics such as the formation of burrs or work hardened areas that result from the machining process may also be detectable using peak power measurements.

5. Conclusions

By directly measuring peak power of a machine tool and machine spindle, the resulting power signals can be used to identify specifics about the machining process. In particular, if the underlying power signals for a given process are already known, then it could be possible to use the power signals from a production process to identify individual stages throughout the part production process. Tooling changes and machining rapids can all be used to identify different points in the machining process. Variations in cutting conditions as a result of tooling breakout, or interrupted cutting are all easily identified using the peak power signal of either the machine tool or the spindle alone. Timing may also be used to link the peak power measurements to specific cutting stages when the cutter path and process are known ahead of time.
Tool path has a dramatic impact on any peak power measurement of the machine tool or spindle which is expected given its relationship to MRR in endmilling. Given the sensitivity of the peak power measurements to cutter path, it is possible that peak power measurements could be used to verify tool paths during cutting. Results from the current machining tests revealed small peak energy spikes related to unintentional radial immersion increases during entry of the endmill into the workpiece material. Peak power spikes were also linked to the formation of small work-hardened volumes being removed as the endmill exits the workpiece material, similar to the formation of burrs. The current results are machine, workpiece material, and cutter specific; however peak power measurements could be a useful tool for analyzing the machining process changes and features, and for identifying machined part features. The current work highlights the requirement to use proper machining parameters. Burr formation, surface integrity of the machined part, and cutter path can influence the overall energy requirements of a machining operation and a machined part.

ACKNOWLEDGEMENTS

The authors would like to acknowledge the support of the New Brunswick Innovation Fund (NBIF) for their financial support of this research.

References

[1]  Manufacturing Energy Consumption Survey (MECS): Total Consumption of Electricity by Manufacturing Industry and Region. Technical report, US Energy Information Administration, 2013.
[2]  A.D. Filippi, R. Ippolito, and G.F. Micheletti, “NC Machine Tools as Electric Energy Users”, CIRP Annals - Manufacturing Technology, vol. 30(1), p. 323-326, 1981.
[3]  I.O. Avram and P. Xirouchakis, “Evaluating the Use of Phase Energy Requirements of a Machine Tool System, Journal of Cleaner Production, vol. 19(67), p. 699-711, 2011.
[4]  S. Kara and W. Li, “Unit Process Energy Consumption Models for Material Removal Processes”, CIRP Annals – Manufacturing Technology, vol. 60(1), p. 37-40, 2011.
[5]  N. Diaz, K. Ninomiya, J. Noble, and D. Dornfeld, “Environmental Impact Characterization of Milling and Implications for Potential Energy Savings in Industry”, 5th CIRP Conference on High Performance Cutting, p. 518-523, 2012.
[6]  Z.M. Bi and L. Wang, “Optimization of the machining Process from the Perspective of Energy Consumption: A Case Study”, Journal of Manufacturing Systems, vol. 31(4), p. 420-428, 2012.
[7]  Y. Guo, J. Loenders, J. Duflou, and B. Lauwers, “Optimization of Energy Consumption and Surface Quality in Finish Turning”, 5th CIRP Conference on High Performance Cutting, p. 512-517, 2012.
[8]  N. Weinert, S. Chiotellis, and G. Seliger, “Methodology for Planning and Operating Energy-Efficient Production Systems”, CIRP Annals – Manufacturing Technology, vol. 60(1), p. 41-44, 2011.
[9]  T. Behrendt, A. Zein, and S. Min, “Development of and Energy Consumption Monitoring Procedure for Machine Tools”, CIRP Annals – Manufacturing Technology, vol. 61(1), p. 43-46, 2012.
[10]  S. Hu, F. Liu, Y. He, and T. Ju, “An On-line Approach for Energy Efficiency Monitoring of Machine Tools”, Journal of Cleaner Production, vol. 27, p. 133-140, 2012.
[11]  M. Mori, M. Fujishima, Y. Inanmasu, and Y. Oda, “A Study on Energy Efficiency Improvement for Machine Tools”, CIRP Annals – Manufacturing Technology, vol. 61(1), p. 145-148, 2011.
[12]  K. Bunse, M. Vodicka, P. Schnsleben, M. Brlhart, and F.O. Ernst, “Integrating Energy Efficiency Performance in Production Management Gap Analysis Between Industrial Needs and Scientific Literature”, Journal of Cleaner Production, vol. 19(67), p. 667-679, 2011.
[13]  Simoneau, A., Meehan, J. 2013, “The Impact of Machining Paramters on Peak Power and Energy Consumption in CNC Endmimlling”, Energy and Power, Vol.5, No. 3.
[14]  Thiede, S., Bogdanski, G., and Herrmann, C. 2012, “A systematic method for increasing the energy and resource efficiency in manufacturing companies”, 1st CIRP Global Web Conference: Interdisciplinary Research in Production Engineering, pp. 18-33.
[15]  A. Bruzzone, D. Anghinolfi, M. Paolucci, and F. Tonelli, “Energy-Aware Scheduling for Improving Manufacturing Process Sustainability: A Mathematical Model for Flexible Flow Shops”, CIRP Annals – Manufacturing Technology, vol. 61(1), p. 459-462, 2012.
[16]  Y. He, B. Liu, X. Zhang, H. Gao, and X. Liu, “A Modeling Method of Task-Oriented Energy Consumption for Machining Manufacturing Systems”, Journal of Cleaner Production, vol. 23(1), p.67-174, 2012.
[17]  Newman, S.T., Nassehi, A., Imani-Asrai, R., and Dhokia, V. 2012, “Energy efficient process planning for cnc machining”, CIRP Journal of Manufacturing Science and Technology, 5(2), pp. 127-136.