-
Paper Information
- Previous Paper
- Paper Submission
-
Journal Information
- About This Journal
- Editorial Board
- Current Issue
- Archive
- Author Guidelines
- Contact Us
Energy and Power
p-ISSN: 2163-159X e-ISSN: 2163-1603
2014; 4(2): 35-40
doi:10.5923/j.ep.20140402.02
Cost Analysis Model for Syngas Production Cost Evaluation Using the Graphical User Interface
 Abstract
 Reference
 Full-Text PDF
 Full-text HTML
Prem B. Parajuli, Y. Deng, H. Kim, F. Yu
Dept. of Agricultural & Biological Engineering, Mississippi State University, Mississippi State, 39762, USA
Correspondence to: Prem B. Parajuli, Dept. of Agricultural & Biological Engineering, Mississippi State University, Mississippi State, 39762, USA.
| Email: |  |
Copyright © 2014 Scientific & Academic Publishing. All Rights Reserved.
An economic analysis of a bio-gasification facility requires an understanding of its syngas production cost. The objectives of this study were to develop a Cost Analysis Model (CAM) to determine the costs associated with syngas production at different production capacities. The CAM was developed using on a graphical user interface (GUI) programmed in Microsoft Visual Studio 2008 software, mathematical equations and validated using data from the local bio-gasifier at 60 Nm3h-1 capacity. The cost analysis results showed that the syngas production unit cost decreased from $0.543 Nm-3 to $0.043 Nm-3 by increasing the production capacity from 60 to 1,800 Nm3h-1. The economic analysis using the CAM showed better power relationship between production capacity vs. unit cost (R2 = 0.99) than the relationship between production capacity vs production cost (R2 = 0.97). It is generally suggested that the bio-gasification facility should run at a high production capacity in order to reduce the unit cost of syngas production. The CAM developed in this study could be a useful tool for economic analyses of syngas production at different capacities.
Keywords: Bio-gasification, Cost analysis model, Economic analysis, Modeling, Syngas
Cite this paper: Prem B. Parajuli, Y. Deng, H. Kim, F. Yu, Cost Analysis Model for Syngas Production Cost Evaluation Using the Graphical User Interface, Energy and Power, Vol. 4 No. 2, 2014, pp. 35-40. doi: 10.5923/j.ep.20140402.02.
Article Outline
1. Introduction
- Biomass gasification system has been considered to be an energy option with high potential. It can be implemented on a smaller-scale for a more efficient utilization of biomass, which provides high-quality energy for rural areas [1]. Due to growing commercial and technological interests in the small-scale bio-gasification facilities, it becomes an important aspect of bio-energy [2, 1, 3]. In addition, the bio-gasification has received substantial attention from academia for the environmental benefits it can bring, such as low air pollution, low waste disposal, waste products re-use (feedstock), and valuable by-products [4]. In addition, the bio-gasification process should be economically reasonable for its successful implementation. Therefore, the economic analysis is essential when assessing the potential profitability of a bio-gasification system and optimizing the expenses associated with capital and operating costs [5, 6, 7]. Similar approach is essential for generating energy from sludge air-blown gasification [8]. Several hydrological and water quality models have been developed to evaluate agricultural and forest based crop production and their impact on hydrology [9, 10]. However, very limited computer-based models have been developed for evaluating economics of the bio-gasification facilities.Recently, an economic analysis has been carried out by using a computer-based model because it can improve the cost efficiency and accuracy of the economic analysis [11]. Most of these computer-based models, however, have been developed for engineers and scientists who are skilled and well-versed in spreadsheet programs [12, 13] or computer programming languages such as C++ [11]. As a result, general users (i.e. policy makers) unskilled in computer programming are not able to easily use the economic analysis models for developing the bio-gasification project strategies. The model developed by a graphical user interface (GUI) is one of solutions to this problem since the GUI provides general users useful tools to interface with the complex process models [14, 15, 16]. The GUI is a user-friendly graphical method that allows users to interact with a computer to conduct several tasks and a computer operating system that uses visual relationships and icons rather than text commands. Instead of issuing commands at a prompt, the users carry out desired tasks by using a mouse to select the pictorial buttons (icons) or lists of options displayed on a screen. Therefore, general users with limited computer knowledge can easily use the economic model developed using the GUI. The objectives of this study were: 1) to design and develop the cost analysis model (CAM) using the GUI for analyzing the micro-scale bio-syngas production unit cost, and 2) to apply it based on data derived from the bio-gasification system installed at Mississippi State University (MSU).
2. Materials and Methods
- The general procedure of syngas production from the bio-gasification system includes steps such as feedstock preparation, biomass gasification, and syngas cleaning steps. For economic analysis, feedstock preparation is considered the starting point and the bio-syngas production output was considered as the ending point. The cost configuration of a bio-gasification facility includes many factors. These factors are affected by both external conditions, such as equipment type and size or operating time; and internal conditions, such as production cost. In this study, the production cost was divided into capital cost and operating cost. The capital cost involved equipment, installation, construction, equipment test run, tax, loan interest, insurance, overhead, and auxiliary costs. The operating costs were divided into variable and fixed costs. Variable costs involve the feedstock, operating labor, utility, waste treatment, and maintenance costs, while fixed costs include the general expense and contingency cost. The model design and model economic parameters are described below.
2.1. Model Design
- The cost analysis model (CAM) for the syngas production from the bio-gasification system was developed using Microsoft Visual Studio 2008 software [17]. The CAM was designed to control the computer hardware system interface with the GUI (Fig 1). The CAM structure allows users to create input and view output displayed on a screen by the GUI. Inputs to the CAM were categorized into capital and operating costs parameters. A mathematical modeling approach was used to estimate each cost components in the model.
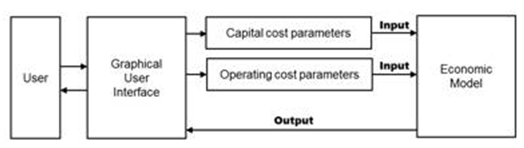 | Figure 1. Structure of the Cost Analysis Model (CAM) |
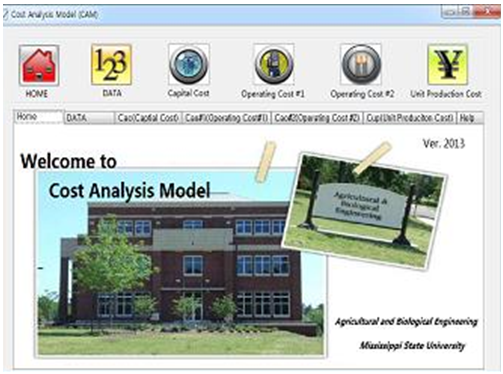 | Figure 2. Home page of the Cost Analysis Model (CAM) |
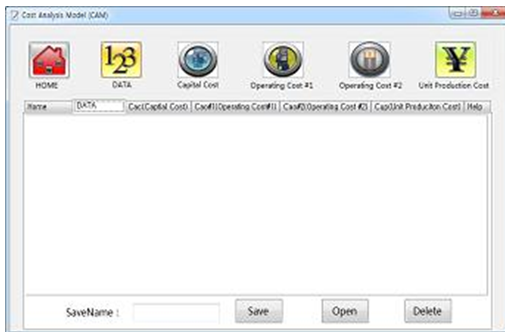 | Figure 3. Data page of the Cost Analysis Model (CAM) |
 | Figure 4. Help page of the Cost Analysis Model (CAM) |
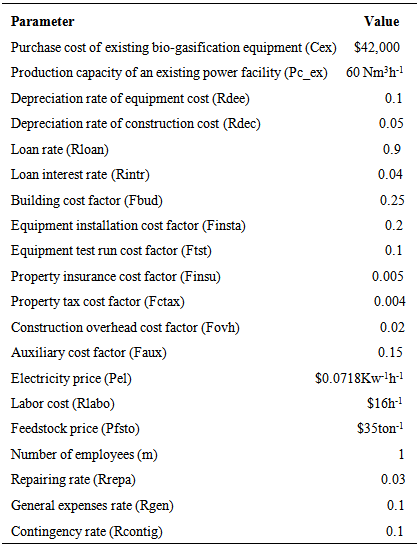
2.2. Model Economic Parameters
- Economic parameters or values were used when calculating the syngas production unit cost based on the data measured from the 60 Nm3h-1 of the bio-gasification capacity installed at MSU. In addition, an economic analysis was carried out based on one working shift. Economic parameters used in the CAM are presented in table 1.
|
3. Results and Discussion
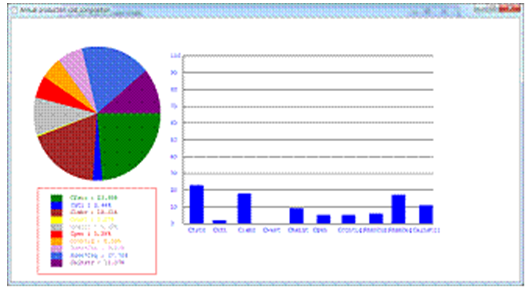
- This study developed and validated the CAM using available economic data from the bio-gasifier at MSU at 60 Nm3h-1 capacity. Further the model was applied at different capacities to quantify syngas unit cost of the bio-gasification system. Figure 5 shows the results of the annual capital cost analysis including annual equipment cost, annual construction and annual loan interest. The total annual capital cost was $8,345. Of capital cost, the annual equipment cost (Ceq) was the largest part (50%), while annual loan interest cost (Cainstr) and construction cost (Ccon) accounted for 32% and 18%, respectively, as presented in figure 6. In the Cao#1 (fig. 7) and Cao#2 pages (fig. 8), the feedstock cost ($1,433), labor cost ($33,280), utilities cost ($576), waste treatment cost ($16), maintenance cost ($2,179), general expenses ($3,748), and contingency cost ($3,748) were computed. The annual operating cost was $44,982 (fig. 8). The analysis of operating cost composition showed that labor cost accounted for the largest part of the operating capital cost at 74%, followed by general expense (8%), contingency (8%), maintenance cost (5%), feedstock cost (3%), utility cost (1%), and waste treatment cost (less than 1%), as shown in figure 9.
 | Figure 5. Cac page showing the information for capital cost analysis at a 60 Nm3h‐1 capacity |
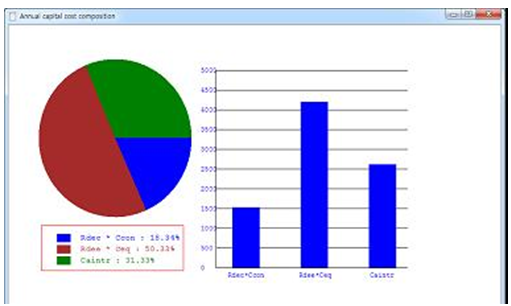 | Figure 6. Annual capital cost composition at a 60 Nm3h‐1 capacity |
 | Figure 7. Cao#1 page showing the information for operating cost analysis at a 60 Nm3 h‐1 capacity |
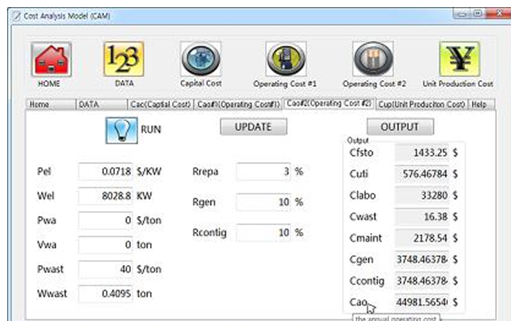 | Figure 8. Cao#2 page showing the information for operating cost analysis at a 60 Nm3h‐1 capacity |
 | Figure 9. Annual operating cost composition at a 60 Nm3h‐1 capacity |
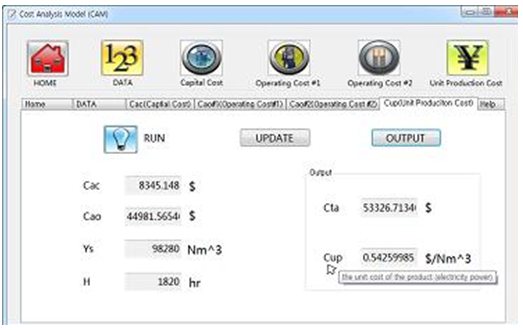 | Figure 10. Cup page showing the information for syngas unit cost analysis at a 60 Nm3h‐1 capacity |
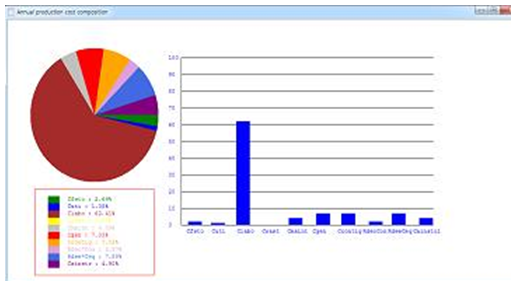 | Figure 11. Annual production cost composition at a 60 Nm3h‐1 capacity |
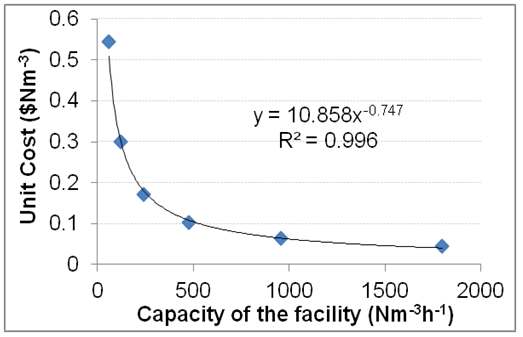 | Figure 12. Production capacity (Nm-3h-1) vs unit cost ($Nm-3) |
 | Figure 13. Production capacity (Nm-3h-1) vs production cost ($) |
 | Figure 14. Annual production cost composition at a 60 Nm3 h‐1 capacity |
4. Conclusions
- The graphical user interface (GUI) CAM model was developed and initially validated using economic data available at MSU for the 60 Nm3h-1 capacity bio-gasifier. The CAM was further applied to assess syngas production unit costs at different capacities. Each cost component and syngas production unit cost changed when the bio-gasification production capacity increased. The cost analysis results showed that the syngas production unit cost decreased from $0.543 Nm-3 to $0.043 Nm-3 by increasing the production capacity from 60 to 1,800 Nm3h-1. The power relationship of the production capacity vs. unit cost was determined the better than the relationship between production capacity vs production cost. It is suggested that the bio-gasification facility should run at a high production capacity in order to reduce the unit cost of syngas production. The model developed and demonstrated in this study can be used to assess economic analysis of similar bio-gasification facilities at different capacities.
ACKNOWLEDGEMENTS
- This material is based upon work performed through the Sustainable Energy Research Center at Mississippi State University and is supported by the Department of Energy under Award Number DE-FG3606GO86025; Micro CHP and Bio-fuel Centre.