B. T. Lebele-Alawa, Innocent Okpara Ohia
Department of Mechanical Engineering, Rivers State University of Science and Technology, Port Harcourt, Nigeria
Correspondence to: B. T. Lebele-Alawa, Department of Mechanical Engineering, Rivers State University of Science and Technology, Port Harcourt, Nigeria.
| Email: |  |
Copyright © 2014 Scientific & Academic Publishing. All Rights Reserved.
Abstract
This paper evaluates the effects of fouling on three heat exchanger units (Pump around cooler, First stage condenser and pre heater) in a polyethylene plant. Data were obtained through steady state monitoring and direct measurements from the plant. The data were analysed using various energy equations and a computer program to determine the overall heat transfer coefficient, heat duties, temperature and pressure range of hot and cold fluids, capacity ratio and effectiveness. The result shows that for the pump around cooler, the overall heat transfer coefficient was 51.60% less than the design value. For the first stage condenser the heat duty and the overall heat transfer coefficient were 86.39% and 80.71% less than the design value respectively. This was traceable to increased fouling that has affected the effectiveness, capacity ratio and temperature range of the hot and cold fluid. In the pre heater unit the heat duty was found to be 80.14% of the design value, while the overall heat transfer coefficient was 15% more than the design value. This was due to variation in temperature difference between plant data and design value in the hot fluid side of the exchanger which has also affected the pressure drop. The results also show an increase of 57.73% of the fouling factor over the design value which also affected the effectiveness and capacity ratio of the heat exchangers.
Keywords:
Heat Exchanger, Heat, Fouling, Energy, Effectiveness
Cite this paper: B. T. Lebele-Alawa, Innocent Okpara Ohia, Influence of Fouling on Heat Exchanger Effectiveness in a Polyethylene Plant, Energy and Power, Vol. 4 No. 2, 2014, pp. 29-34. doi: 10.5923/j.ep.20140402.01.
1. Introduction
A heat exchanger is a device that allows heat energy in one process fluid to pass to another process fluid in a controlled manner whose purpose is either to remove heat from a fluid (cooling) or to add heat to a fluid. The heat energy transferred in the heat exchanger may be in form of latent heat, as in boilers and condensers or sensible heat as in heaters and coolers. Also in a polyethylene plant heat exchangers are generally used for temperature profile control, steam generation and for phase separation [1]. Heat exchangers are used in various systems and processes that involve the transfer of heat energy. Improper design and maintenance of a heat exchanger may result in the damage or degradation of the components and performance of the system or unit. The major cause of reduction in heat exchanger performance is the effect of fouling [2]. Fouling in heat exchanger is a general term that includes any kind of deposit of extraneous materials that appears upon the heat transfer surface during the lifetime of the heat exchanger. It occurs during normal operation, when the tubes surface gets covered or blocked by deposits of ash, soot, dirt, oil, and scales. Whatever the cause or exact nature of the deposit, additional resistances to heat transfer is introduced and the operational capability of the heat exchanger is correspondingly reduced. In many cases, the deposit is heavy enough to significantly interfere with the fluid flow and increase the pressure drop required to maintain the flow rate through the exchanger. There are several different basic mechanisms by which fouling deposits may be created and each of them generally depends upon several variables. In addition, two or more fouling mechanisms can occur in conjunction in a given service [3]. In general, working regime (fluid flow rate, temperature, pressure and concentration of components) as well as the actual plate geometry affects the formation of deposits [4, 5].The unexpected failure of equipment such as heat exchangers in industrial environment (plant) is always undesirable and when these equipments are critical, they may lead to drop in overall profit. It is therefore with a view to averting down time, reduction in overall heat transfer, lost production and costly repair, that it is necessary to carry out periodic evaluation of the heat exchanger performance in the plant in order to maintain them at high efficiency level.In recent years several performance evaluation methods and studies have been developed and used to evaluate and improve the performance of heat exchangers. The use of CFD-fluent simulation to predict and analyze the heat transfer in shell and tube heat exchanger by comparing the simulation results to the experimental results has been done [6]. In this work, experimental study and numerical simulation on heat transfer and pressure drop characteristics where performed at the shell side of a helically baffled heat exchangers. The flow field and heat transfer performance in the shell side were simulated using commercial fluent software. The numerical results of shell side Nusselt number and pressure drop were compared with those of experimental data and showed that CFD simulation helped to increase the efficiency of a heat exchanger [6]. The effect of fouling on heat transfer, pressure drop, and throughput in refinery preheat trains has been studied [7]. The study emphasized the interaction between thermal and hydraulic effects using engineering analysis and fouling rate laws based on the “threshold fouling” concept. Using models linking flow resistance and fouling resistance, it became possible to simulate the effects of fouling on the hydraulic performance of a refinery pre-heat train.Numerical analysis of plate heat exchanger has also been applied to evaluate the performance in a co-current fluid flow configuration heat exchanger [8]. The study presented the theoretical analysis of a co-current plate exchanger and the results of its numerical simulations. Knowing the hot and cold fluid streams inlet temperatures, the respective heat capacities (mCp) and the values of the overall heat transfer coefficient, a 1-D mathematical model based on the steady flow energy balance for a different length of the device was developed resulting in a set of N first order differential equations with boundary conditions (where N is the number of channels). Also the evaluation of surface coating in heat exchangers has been done [9]. This study presented an experimental investigation of coating effectiveness in compact plate heat exchangers and transient observation of heat transfer surface appearance, where new and cleaned coated heat exchangers that have been exposed to untreated lake water for various time periods were considered and transient effectiveness results compare the rate of fouling for coated and uncoated heat exchangers. Results indicate that the thermal performance of the unit decreases with time, resulting in undersized heat exchangers. Uncoated plates accumulate deposits up to 50% faster than coated plates and show a decrease in performance by approximately 20%. Experimental determination of fouling factor on plate heat exchangers has been carried out on a district heating system. The work described the influence of water velocity on fouling factor in plate heat exchangers based on measurements on four district heating substations (DHS). During the operation of the heat exchanger, the heat duty reduced due to fouling [10]. Also the performance evaluation of tube- in -tube heat exchangers with heat transfer enhancement in the annulus in which the performance of heat exchangers was substantially improved by many augmentation techniques applied to design systems [11]. Heat transfer enhancement devices are commonly employed to improve the performance of an existing heat exchanger or to reduce the size and cost of a proposed heat exchanger. An alternative goal is to use such techniques to increase the system thermodynamics efficiency, which reduces the operating cost. This paper presents an energy evaluation performance analysis based on steady state monitoring and reading of data in a process plant that is used to evaluate the performance of heat exchanger in polyethylene plant and compare with design data to predict the effect of degradation due to fouling. This enables maintenance period to be predicted in order to eliminate the menace of fouling which increases the thermal resistance of heat exchangers and consequently lowers the overall heat transfer.
2. Materials and Methods
The research considered the direct monitoring and evaluation of steady state parameters of inlet and outlet values of cooling water and the process fluid (Hydrocarbon) of heat exchangers in the plant. Figures 1 and 2 show the block diagram and the temperature distribution for the heat exchanger, respectively. The pertinent parameters considered includes: fouling factor, overall heat transfer coefficient, heat duty, temperature and pressure ranges of hot and cold fluids, capacity ratio and effectiveness, of 2-E-301 pump around cooler, 3-E-901 first stage condenser and 3-E-401 pre-heater co-current heat exchangers in the polyethylene plant.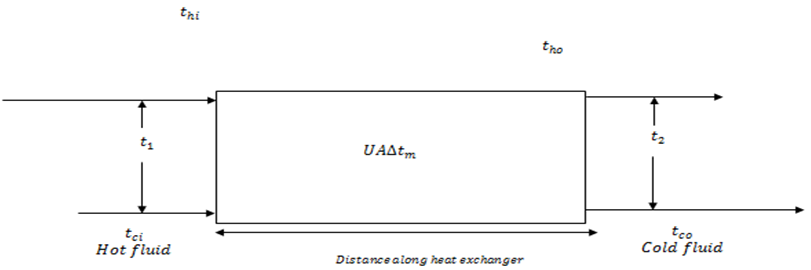 | Figure 1. Block Diagram of a Heat Exchanger |
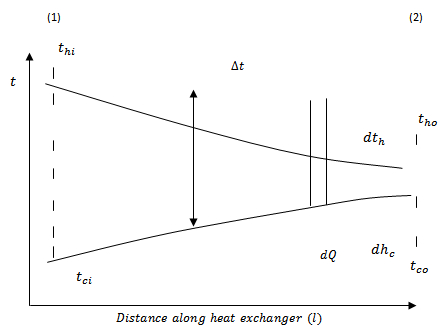 | Figure 2. Temperature distribution for a parallel flow heat exchanger |
The data collection was carried out through direct measurements from the equipment in the plant. Also data from the operational log book from September 2010 to October, 2011 were considered. Field investigation and observation of the various heat exchanger units were also done. More data were obtained from the design data sheet, vendor/process licensor material and field operator’s log book. In the analysis and treatment of the data, mean values of daily parameters were computed using statistical methods. This was followed by monthly average and the overall average for the period the research was carried out. From this, such parameters as temperature and pressure ranges, fouling factors, heat duty, capacity ratio effectiveness and overall heat transfer coefficient were determined.
2.1. Fouling Factor
This is the reciprocal of the heat transfer coefficient of the dirt formed in the heat exchange process. The higher the factor, lesser will be the overall heat transfer coefficient. It is expressed thus;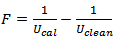 | (1) |
Where  = Overall heat transfer coefficient calculated from data and
  = Design Overall heat transfer coefficient.
2.2. Overall Heat Transfer Coefficient U
The overall heat transfer coefficient is the ratio of heat flux per unit difference in approach across heat exchanger equipment considering the individual coefficient and heat exchanger metal surface conductivity. The magnitude indicates the ability of heat transfer for a given surface. The higher the coefficient, the lesser will be the heat transfer surface requirement measured in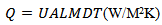 | (2) |
2.3. Heat Duty (Q)
This is the capacity of the exchanger equipment expressed in terms of heat transfer per unit time. It means the exchanger is capable of performing at this capacity in the given system.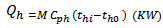 | (3) |
Where  = Heat duty of the hot fluid.
2.4. Capacity Ratio R
This is the ratio of the temperature range of the hot fluid to that of the cold fluid.  | (4) |
2.5. Effectiveness S
This is the ratio of cold fluid temperature range to that of the inlet temperature difference of the hot and cold fluid. | (5) |
3. Results and Discussions
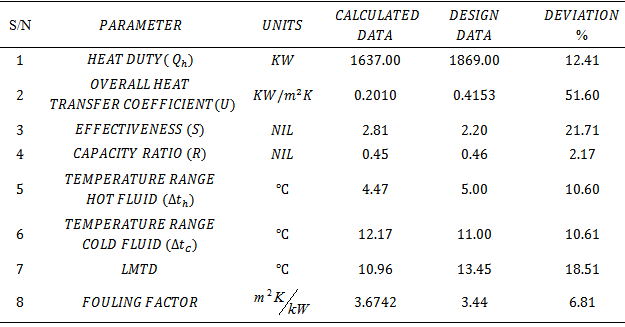
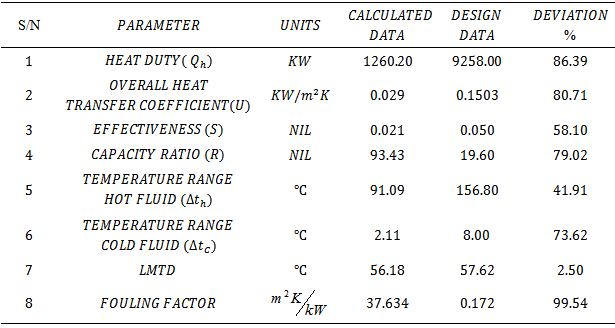
The results for the three co-current heat exchanger units: pump around cooler, first stage condenser and pre-heater were obtained by imputing the various inlets and outlets temperature and pressure and flow rate for each heat exchanger unit into the various energy equations.Table 1-3 shows the average summary of the results for the period under consideration.From Table 1 the overall heat transfer coefficient is 51.60% less than the design value and the actual heat duty shows 12.41% deviation from the design value, which is practically negligible as this duty is up to 75% of the design value and the difference could be because of the specific heat capacity deviation with temperature or heat loss due to radiation from the hot shell side. The capacity ratio and fouling factor are negligible as there are only slight deviations from the design value while there is 21.71% rise in effectiveness over the design value and 18.51% deviation from design value for LMTD which are all traceable to temperature variation in the cold and hot fluids.The heat duty and the overall heat transfer coefficient are 86.39% and 80.71% less than the design value as shown in Table 2. This is traceable to the difference in temperature range of the cold fluid and to the high increase in fouling that has resulted in minimized active area of heat transfer and this has also affected the capacity ratio and the effectiveness which has a significant effect on the overall performance as the higher the ratio the lesser will be requirement of the heat transfer surface. There is a 41.91% deviation in the hot fluid side which could be due to some heat loses by radiation from the hot shell side and a practically negligible deviation was noticed in LMTD.Table 1. Results of Pump around Cooler
 |
| |
|
Table 2. Results of First Stage Condenser
 |
| |
|
Table 3. Results of Pre-Heater
 |
| |
|
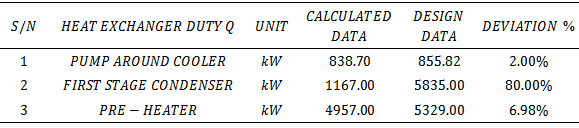
Table 4. Out Put Results -Pump around Cooler, First Stage Condenser and Pr-Heater
 |
| |
|
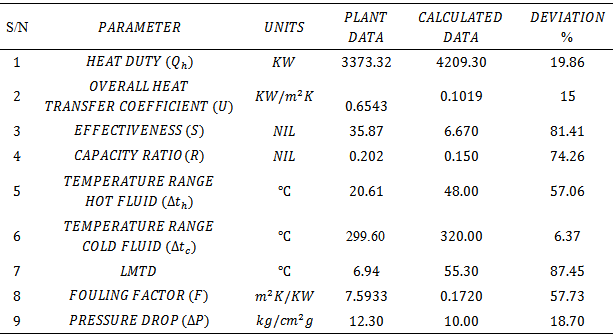
From Table 3 the heat duty is found to be 80.14% of the design value which shows a good performance and 15% increase in the overall heat transfer coefficient over the design value. This is due to variation in temperature difference between calculated data and design value in the hot fluid side of the exchanger which has also affected the pressure drop up to 18.70% more than the design value. An increase of 57.73% of the fouling factor over the design value of  is also noticed and this has also affected effectiveness and capacity ratio respectively while there is a negligible deviation in the temperature range of the cold fluid side of the exchanger.Comparing the results shown in tables 1-3 above, the pump around cooler has the lowest heat duty, effectiveness, capacity ratio and fouling factor deviation from the design values of each heat exchanger. The first stage condenser recorded the highest fouling factor, as the most fouled exchanger. While the Pre-heater shows the best result in terms of overall heat transfer coefficient as there was an increase of 15% over the design value which is traceable to the temperature profile at the cold side of the heat exchanger.From Table 4 shows the simulation results from hysys using the various input parameters. For pump around cooler the inlet and outlet temperatures of both the tube and shell sides show 98% of the design value while the actual duty is 98% of the design value. The 2% variation is practically negligible and is caused by heat losses due to radiation from the hot shell side and specific heat capacity variation with temperature. For the First stage condenser the inlet and outlet temperature of the shell shows 16% deviation and that of the tube side was found to be 21% of the design value. Variations were also observed in the flow rate, while the duty shows 80% deviation from the design value. In the pre-heater there was 6.98% deviation in the duty of the design value, while there was no noticeable deviation in the tube inlet and outlet temperature as compared to their design values.
4. Conclusions
This work has highlighted the deviations of plant operations from actual design values due to fouling of the heat exchanger units. The fouling affected the heat exchanger effectiveness, capacity ratio and temperature range of the hot and cold fluid. This consequently affected the pressure drop and the overall system performance. The parameters and equations used in assessing the efficiency of the heat exchangers and also to check deterioration of the equipment design and operation with time was by steady state monitoring, direct collection of data from the equipment in the plant and analysis of the data using various energy equations. A simple computer program was written in Q basic language to obtain the summary of the overall results. The results were compared with the equipment design data. It provided a good method of obtaining the performance of the heat exchangers.
Nomenclature
A Heat Transfer AreaCph
 Specific Heat Capacity of hot FluidF
 Fouling Factorm
 Mass Flow Rate (Kg/h)Qh
 Heat Duty of hot Fluid (KW)R
  Capacity RatioS
  Effectivenesst1 & t2
  Wall temperatures oCthi
 Inlet Temperature of hot fluid (oC)tho
 Outlet Temperature of hot fluid (oC) tci
 Inlet Temperature of cold fluid (oC)tco
 Outlet Temperature of cold fluid (oC)Δtc
  Change in cold fluid temperatureΔth
  Change in hot fluid temperatureU
  Overall heat transfer co-efficientUcal
 Overall Heat Transfer Coefficient from Data (KW/m2K)Uclean
 Overall Heat Transfer Coefficient from Design (KW/m2k)LMTD
  Log Mean Temperature Difference oCΔP
  Pressure drop
References
| [1] | B. T. Lebele-Alawa, I. O. Ohia “Performance evaluation of heat exchangers in a polyethylene plant” International Journal of Engineering and Technology Innovation 3(1):49-57; 2013. |
| [2] | Hesselgreaves, J.E. (2002). An Approach to fouling Allowance in the Design of compact Heat Exchangers. Journal of Applied Thermal Engineering, 22, 700-720. |
| [3] | M. Kelvin “Increasing Heat Exchanger Performance” Procurement of Bryan Research and Engineering incorporated, Bryan, Texas pp1-13, 2006. |
| [4] | H. U. Zettler, M. Weis, Q. Zhao, H. Muller-Steinhagen. “Influence of surface properties and characteristics on fouling in plate heat exchangers. Heat Transfer Engineering 26(2):3-17; 2005. |
| [5] | D. J. Kakulka, M. Devgon. “Fluid temperature and velocity effect on fouling” Applied Thermal Engineering 27:2732-2744; 2007. |
| [6] | K. H. Othman “Computional Fluid Dynamic simulation of Heat Transfer in Shell and Tube Exchanger” B.Sc project, Faculty of Chemical and Natural Resources Engineering, University of Malaysia, 2009. |
| [7] | E. M. Ishiyama, W. R. Paterson, D. I. Wilson “The effect of fouling on heat transfer, pressure drop, and throughput in refinery preheat trains: optimization of cleaning schedules” Heat transfer Engineering. Taylor and Francis, 30(10-11): 805-814, 2011. |
| [8] | H. Dardour “Numerical Analysis of Plate Heat Exchanger Performance in Co-current fluids flow configuration” World Academy of Science, Engineering and Technology ,51, 2009. |
| [9] | D. J. Kukulka “Evaluation of surface coating on Heat Exchangers” A study at the Great Lakes Research Centre of the University of New York College at Buffalo New York 14222 USA, 2008 |
| [10] | S. B. Genic, B. M. Jacimovic, D. Mandic, D. Petrovic “Experimental determination of fouling factor on plate heat exchangers in district heating system. Energy and Building 50:204-211; 2012. |
| [11] | D. Zimparov “Performance Evaluation of Tube in-Tube Heat Exchanger with Heat Transfer Enhancement in the Annulus” Original Scientific paper UDC: 66.045.1:519.876.5, 2006. |
 Abstract
 Reference
 Full-Text PDF
 Full-text HTML