-
Paper Information
- Paper Submission
-
Journal Information
- About This Journal
- Editorial Board
- Current Issue
- Archive
- Author Guidelines
- Contact Us
Energy and Power
p-ISSN: 2163-159X e-ISSN: 2163-1603
2013; 3(5): 79-84
doi:10.5923/j.ep.20130305.01
Effect of H2 Addition via Solar-Driven Electrolysis on the Performance and Emissions of a CI Engine
 Abstract
 Reference
 Full-Text PDF
 Full-text HTML
Garry I. Negroni1, Ralph C. Aldredge2
1Institute for Transportation Studies, University of California, Davis, CA, 95616, USA
2Department of Mechanical and Aerospace Engineering, University of California, Davis, CA, 95616, USA
Correspondence to: Ralph C. Aldredge, Department of Mechanical and Aerospace Engineering, University of California, Davis, CA, 95616, USA.
| Email: |  |
Copyright © 2012 Scientific & Academic Publishing. All Rights Reserved.
A vehicle-integrated photovoltaic system was used to produce a gaseous mixture of H2, O2 and steam, via alkaline electrolysis, for aspiration into an indirect-injection compression-ignition engine for the purpose of reducing soot opacity and hydrocarbon emissions. Aspiration of 0.516 ± 0.007 L/min of the H2-O2-steam mixture produced through electrolysis of aqueous potassium hydroxide was found to reduce soot opacity, hydrocarbon emissions and particulate matter during part-load dynamometer tests. Performance improvements under full-load conditions were observed. However, part-load performance at various engine speeds was found to decrease due to pre-mature auto-ignition of the aspirated gas.
Keywords: Vehicle-integrated Photovoltaic, Alkaline Electrolysis, Indirect Injection, Compression Ignition, Particulate Matter, Hydrocarbons, Soot Opacity
Cite this paper: Garry I. Negroni, Ralph C. Aldredge, Effect of H2 Addition via Solar-Driven Electrolysis on the Performance and Emissions of a CI Engine, Energy and Power, Vol. 3 No. 5, 2013, pp. 79-84. doi: 10.5923/j.ep.20130305.01.
Article Outline
1. Introduction
- Solar energy is abundant, inexhaustible as long as the Earth exists, and in constant flux daily, while the sun is the fundamental energy source from which most other forms of energy are derived including biomass, wind, hydroelectric and fossil fuels[1-3]. Direct applications of renewable solar energy towards improving fossil-fuel combustion and reducing heat-engine emissions will become increasingly more important as we explore sustainable solutions to our transportation energy needs. Vehicle integrated photovoltaic (VIPV) electricity can be used to power loads directly or charge energy-storage devices for later consumption. Most applications of VIPV focus on enhanced propulsion, extended battery range for battery-electric vehicles[4], or reductions in auxiliary loads for hybrid-electric vehicles[5]. With space available on the rooftop of most every vehicle, VIPV arrays offer renewable electrical energy decoupled from the primary fuel conversion system. The primary objective of the current work is the implementation and evaluation of solar-driven electrolysis as a means for improving the performance and emissions of a light-duty vehicle; specifically, an indirect-injection (IDI) compression-ignition (CI) engine. In comparison with the direct-injection (DI) engine, the indirect-injection (IDI) compression-ignition (CI) engine is often preferred for light-duty applications because of its lower nitrogen-oxide (NOx) emissions, wider speed range and quieter operation, with minimal pumping losses[6]. In addition, the IDI CI engine more readily accommodates the consumption of biofuels, such as biodiesel or straight vegetable oil (SVO). Notwithstanding these attributes, the use of this engine is also generally hindered by its high hydrocarbon (HC) and particulate-matter (PM) emissions, due to relatively slow combustion processes.The implementation of solar electrolysis exemplifies the direct application of renewable-energy technology in transportation, using solar energy as the primary energy source for improving IDI CI combustion of No. 2 diesel fuel. Earlier investigations of solar-driven electrolysis have typically involved application of the technology to large-scale systems[2, 7-9], while investigations of electrolysers used to improve CI engine combustion have often employed grid power rather than solar power for electrolysis, due to high power-input requirements[10, 11]. The present study incorporates aspects of each of these two approaches. The direct application of solar-driven electrolysis to a small-scale CI engine demonstrates a new avenue through which renewable, solar energy can be used in heat-engine powered vehicles that are decoupled from the electric grid. The idea is to introduce a mixture of hydrogen, oxygen and water vapor produced onboard by solar-driven electrolysis into the cylinders of the IDI CI engine prior to ignition of the diesel-fuel. The combustion of hydrogen during the compression stroke, at approximately 849K, results in the production of heat, radicals and turbulence that all enhance the combustion of the diesel fuel when it is ignited shortly afterwards (when the piston is near top dead center). Furthermore, the water vapor introduced into the cylinder as part of the mixture from the electrolyser gas, and that produced from the combustion of hydrogen, absorbs combustion heat and reduces the temperature in the cylinder, potentially resulting in reduced NOx emissions[6, 10-13].
2. Materials and Methods
- Our test vehicle is a 1981 VW Rabbit MK2 DL with a biofuel-capable 1.6L MFI IDI CI engine and a 5-speed manual gearbox. The PV charging system consists of a single 180W Sharp PV Panel, a Morningstar Prostar-30 PWM charge controller, and two second-use 12V Optima Red Top lead-acid energy storage devices connected in parallel. The charging system and the energy storage device are connected in series. Figure 1 shows the layout of the VIPV system. National Instruments LabVIEW 2009 was used to acquire voltage and current data. Emano shunts (100A/100mV) were placed between the PV panel, the charge controller, and the energy storage devices. Voltage drops were measured across the shunts and current was measured across positive and negative terminals of the recipient device.Figure 2 shows the structure of the electrolyser. It consists of 16-gauge 316L stainless-steel plates, 0.75-inch CPVC/Acrylic endplates and 16-gauge CPVC/Acrylic gaskets. Upon activation, the alkaline solution flows through the electrolyser at standard temperature and pressure. Power is delivered to the electrolyser directly and through a 45A DC chopper (12V at max), through 10-AWG stranded copper THHN. The average duty cycle (percentage time in active status) of the chopper was determined as the average power per cycle divided by the maximum power per cycle. An Emano (100A/100mV) shunt was placed between the energy storage device and the electrolyser, as shown in Fig. 3. The electrolysis test was conducted using potassium hydroxide (KOH) at its upper limit for remaining non-corrosive (2% by weight). Maintaining the electrolytic solution below corrosive levels increases plate longevity and permits safer consumer application. Flow rates were measured using a Gilibrator-2 Primary Air Flow Calibrator. Mass flow was initiated when a current was induced across the anodes and cathodes.
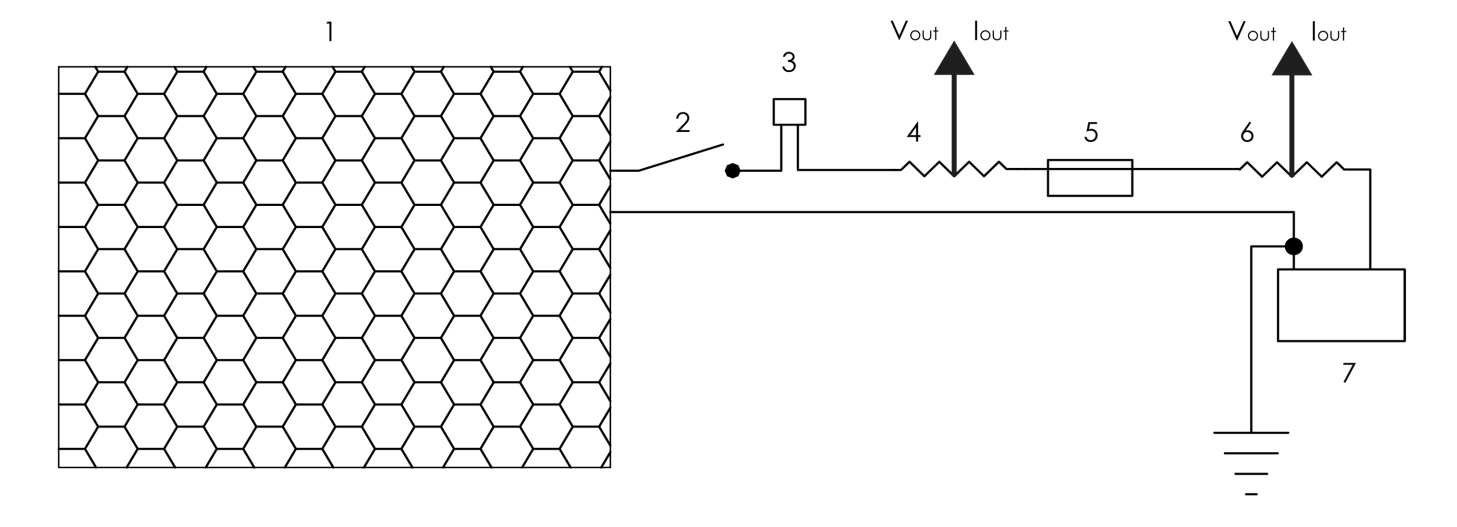 | Figure 1. (Solar-PV charging system): (1) 180W Sharp PV Panel; (2) 600W Emergency Disconnect; (3) 30A Overcurrent Protection; (4,6) Emano 100A/100mV shunts; (5) Morningstar Prostar-30 PWM charge controller; (7) Second-use, 12V Optima Red Top sealed lead-acid batteries, connected in parallel |
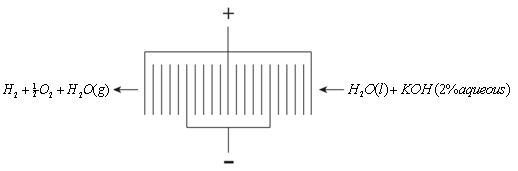 | Figure 2. (Electrolyser): With three anodes and two cathodes connected in parallel, there are four bipolar plates in each stack, creating five cells per stack. The total active electrolyser surface area for 21 plates is 0.434 m2 |
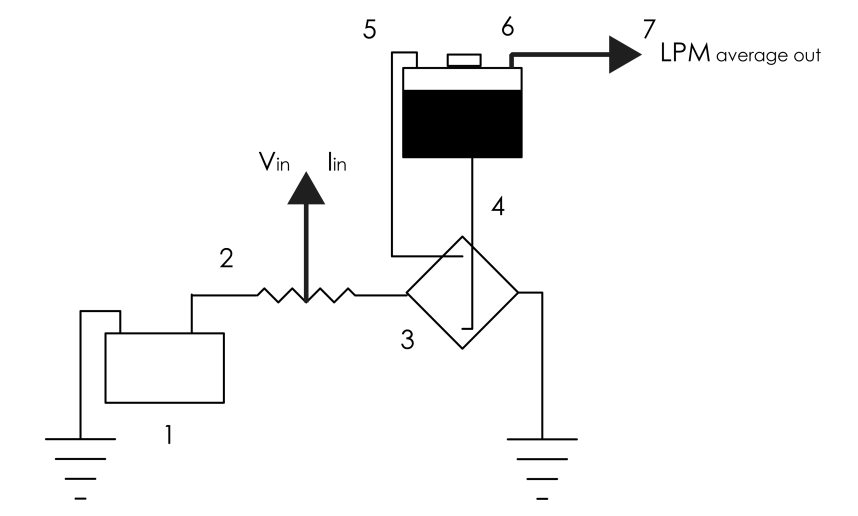 | Figure 3. (Electrical component layout): (1) Energy storage; (2) Emano shunt; (3) Electrolyser; (4) Electrolyser inlet (liquid); (5) Electrolyser outlet (gas); (6) Reservoir outlet; (7) Flow meter |
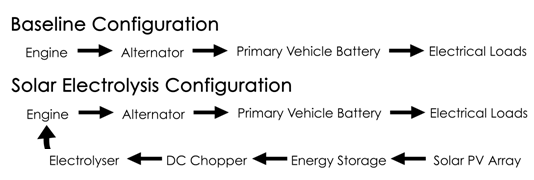 | Figure 4. (Dynamometer test configurations): In the solar-electrolysis configuration a solar photovoltaic array charges a separate energy storage device, independent of the vehicle’s battery, which powers the electrolyser |
- For the purpose of assessing the effectiveness of the VIPV system, we will assume an average daily solar insolation of 4 kWh/m2. Considering the OEM-rated solar-panel efficiency of 13.6% then gives a possible solar-panel output of 544 Wh/m2-day, on average. The total daily energy available from a vehicle-mounted PV system depends on the proportionally on the available area of the rooftop or appropriate PV panel. The PV panel used in our study has an area of 1.32 m2 and can thus produce approximately 718 Wh/day (2.585 MJ/day). Therefore, with an average efficiency of 84.0% for the charge-controller used in our study (calculated from measured input and output voltage and current) the average solar-to-battery energy-conversion efficiency is then 11.7%, and the total energy available for delivery to the energy storage device is approximately 601.9 Wh.
3. Results & Discussion
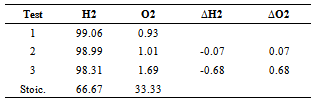
- With 2% (by weight) KOH, the electrolyser was able to produce 0.0050.0009 LPM/W at standard pressure and temperature. A linear regression model was used to correlate the input current I (in amperes) with the total flow rate in units of LPM (namely, 0.0523I0.0084), accounting for 99.78% of the variation. The average flow rate of hydrogen based upon the thermoneutral voltage and the number of cells was found to be 0.00240.0007 LPM, while the average current input was found to be 731 mA/cm2. The dependence of the electrolyser flow rate on the KOH concentration and the voltage and current input is used to determine the amount of hydrogen aspirated into the engine, based upon the voltage measurements and the operational electrolyser resistance. The average resistance, 0.6980.172 Ω, was used to calculate the power input to the electrolyser during road and dynamometer testing. Stoichiometric outputs for water electrolysis processes at the equilibrium voltage of 1.482V/cell are reported in the literature[2, 7-9, 15]. Voltage in excess of this value induces heat into the solution and the power at which this occurs is equivalent to system amperage times the difference between the actual cell voltage and the equilibrium voltage. Considering the average solar-to-battery energy-conversion efficiency of 11.7% and the average voltage efficiency of the electrolyser determined to be 69.2% during dynamometer testing, the solar-to-electrolysis efficiency is found to be 7.88%.
|
|
|

4. Summary & Conclusions
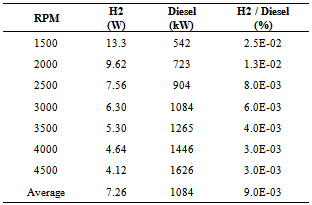
- Onboard solar-driven electrolysis for the production of an H2-O2-steam mixture to enhance diesel-fuel combustion was the focus of the current study. Under full-load (sweep) dynamometer testing, the addition of the H2-O2-steam mixture to the engine cylinder prior to diesel-fuel ignition was found to result in an increase in peak engine power (torque) of 1.562% (2.608%) on average, over a wide range of engine speeds (1500 - 4500 RPM). An additional 970W of engine power at full-load was gained from the addition of H2 (at the level of 7.263.26W), derived from solar-driven electrolysis. This net power increase of approximately 963W beyond the solar-derived H2 power input can be attributed to improved diesel-fuel combustion as a result of H2 addition. However, the effectiveness of H2 addition was found to diminish with increasing engine speeds, reaching a maximum at an engine speed of approximately 2900 RPM. Under part-load (step) dynamometer testing at steady state the addition of the H2-O2-steam mixture from the electrolyzer to the engine cylinder prior to diesel-fuel ignition was found to result in a decrease in peak engine power and torque for all but the lowest engine speed tested (1500 RPM). An average decrease in peak engine power (torque) by 3.67% (3.30%) is attributable to H2 auto-ignition, which becomes prevalent under steady-state conditions at a constant engine speeds. Hydrogen addition was also found to result in reductions of HC and CO emissions and an increase in CO2 emissions (likely due to a greater availability of O2) under part-load (step) steady-state conditions. Reductions in HC emissions were greatest for engine speeds characteristic of typical daily driving (2000 - 3000 RPM). A decrease in opacity of 31.5% on average was found, suggesting an overall decrease in PM emissions as a result of H2 addition via solar-driven electrolysis). In conclusion, we have demonstrated the implementation of solar electrolysis as a direct application of renewable-energy technology in transportation, using solar energy as the primary energy source for improving IDI CI combustion of No. 2 diesel fuel. This implementation demonstrates a new avenue through which renewable, solar energy can be used in heat-engine powered vehicles that are decoupled from the electric grid.
ACKNOWLEDGEMENTS
- We are grateful to Dr. Andrew Burke for assistance with testing during the study.

 addition in increasing the thermal efficiency of a diesel engine,” Fuel, vol. 89, no. 2, pp. 378-383, 2010.