-
Paper Information
- Previous Paper
- Paper Submission
-
Journal Information
- About This Journal
- Editorial Board
- Current Issue
- Archive
- Author Guidelines
- Contact Us
Energy and Power
p-ISSN: 2163-159X e-ISSN: 2163-1603
2012; 2(5): 96-106
doi: 10.5923/j.ep.20120205.03
Modeling of the Regeneration Processes in Diesel Particulate Filters
Leonid Tartakovsky , Boris Aronov , Yoram Zvirin
Faculty of Mechanical Engineering, Technion, Israel Institute of Technology, Haifa, 32000, Israel
Correspondence to: Leonid Tartakovsky , Faculty of Mechanical Engineering, Technion, Israel Institute of Technology, Haifa, 32000, Israel.
| Email: |  |
Copyright © 2012 Scientific & Academic Publishing. All Rights Reserved.
New simulation algorithm of soot oxidation in diesel particulate filter (DPF) is proposed. Two-dimensional finite differences scheme is used for calculation of the heat transfer in DPF (macro-scale). One dimensional model for treatment of the soot oxidation process in a separate filter channel (micro-scale) is based on a new expression for the oxidation reaction rate that is a modification of the known Bissett’s equation. This expression allows consideration of the non-linear dependence of oxidation reaction rate on a reagent concentration. For cases of catalytic coating a modification of the known two-layer model is suggested. A fraction of soot that has been oxidized with the help of the catalyst is not invariable in the first layer, but it exponentially depends on the distance from a channel wall of the particle trap. Soot oxidation by O2 and/or NO2 in diesel particulate filters is investigated for various cases of non-catalytic and catalytic oxidation. The filter clogging propagation from its periphery to the center at critical temperature is described theoretically at first. A comparison between various types of DPF regeneration methods is performed by using the proposed simple simulation algorithm and appropriate computer code.
Keywords: Diesel particulate filter, Filter regeneration, Soot oxidation
Article Outline
1. Introduction
- Diesel particulate filters are the most effective option to control the particulate matter (PM) emissions[1-4]. Today there are several types of DPF available on the market and differing mainly by the method of trapped soot removal usually called filter regeneration. It is convenient to classify regeneration methods as active (applying external or engine measures of gas temperature control at DPF inlet) or passive (usually employing catalytic means)[2],[5],[6].Combinations of measures are also common and catalytic means can be applied in active regeneration systems. Between active regeneration methods utilizing engine measures of gas temperature control at DPF inlet the following means can be noted[2]: exhaust gas recirculation (EGR), injection timing retard, fuel post-injection, decrease of boost pressure, intercooler bypass. The external means of active regeneration include: fuel burners with full or partial flow, filter electric heaters, microwave heaters, injection of combustibles, catalytic or reactive species in the exhaust[7], electrochemical filter reactor[8], etc. Increase of the exhaust gas temperature to about 600℃ (temperature of non-catalytic soot oxidation) by fuel burners, electric heating, etc. incur additional energy costs, require complex means of control and can createsignificant thermal stresses on filter components. Passive regeneration methods include: catalytic filter coatings[9], fuel-borne catalysts (FBC)[10], reactive species generation (e.g. NO2)[11]. The development of catalyzed DPF (CDPF) aims at attaining[2]: soot oxidation activity under moderate exhaust temperatures by exploiting direct (through oxygen transfer) as well as indirect (through NO2 generation) soot oxidation; reduced soot ignition temperatures compared tonon-catalyzed filters to allow energy savings during fixed regenerations; tolerance to ash accumulation. Despite a significant number of works in this field, there is still no consensus about the ability of CDPF to catalyze the direct oxidation of PM at lower temperatures and under conditions relevant to real-world applications[9]. The latest findings in this field show that the mechanism of the direct catalytic combustion of soot is attributed to a two-step process: initial direct combustion initiated by oxygen transfer from catalyst to soot, which is followed by an exothermal propagation to soot particles spatially discrete from direct contact. This mechanism is not dependent on NO2 content[9]. Other popular DPF regeneration methods use NO2 - oxidation with O2 presence without or with catalytic coating on the filter (Continuously Regenerating Trap (CRT) or Catalyzed Continuously Regenerating Trap (CCRT), respectively)[3],[11]. CRT and CCRT systems usually use a diesel oxidation catalyst (DOC) located upstream a DPF to promote NO2 generation from the engine-out NO emissions. The mentioned above methods of DPF regeneration differ by their cost, reliability, minimal required exhaust gas temperature and NOx concentrations, etc. Processes of DPF regeneration have been studied and described in numerous publications. The NO2-carbon oxidation reaction follows the Langmuir-Hinshelwood mechanism and characterized by activation energy values far below those for C+O2 reactions and by non-linear dependence of the reaction rate, R, on NO2-concentration. Messerer et al.[12] has found experimentally that at NO2 concentrations above 200 ppm the reaction rate increase with NO2 fraction growth saturates. However, many modeling approaches apply the classic Bissett equation, and soot oxidation is assumed to be the first order reaction in NO2[13],[14].For non-catalytic O2-carbon oxidation the activation energyEO2value of 180kJ/molwas suggested byKonstandopolous and Kostoglou[15]. Jacquot et al.[16] obtainedE(1)NO2 = 45.5 kJ/mol for the reaction C+2NO2 → CO2+2NO and E(2)NO2 = 59.4 kJ/mol for that of C+NO2 →CO+NO. These values are adopted here. Some promising catalysts have been reported in[17],[18] which can catalyze the C+O2 reaction. Fino and Specchia[17] obtained activation energy of 123kJ/mol for catalytic O2-carbon oxidation by the development of a new soot combustion catalyst, PrCrO3 perovskite on CeO2. Palmisano et al.[18] produced nano-particles of ceria by combustion synthesis with catalytic activation energy of 111kJ/mol and temperature peak of carbon oxidation of 405 C. Wall-flow filters were studied by Konstandopoulos&Kostoglou[19] under conditions of O2 oxidation and by Konstandopoulos et al.[20],[21] with NO2- and O2-carbon oxidation. FBC that are supplied with the fuel were discussed in[21]. They were investigated, as well as wash-coated filters, by Hinot et al.[22]. It was found that Pt-doped soot and simultaneously filtered aerosols were both equally effective in reducing the oxidation temperature by up to 140-250oC. Conversely, the deposition of a thin soot layer of 5-10 micron thickness onto Pt produced only a slight temperature decrease of about 13-42oC. It should be noted that the FBC approach is inconvenient because of the inherent requirement of providing a continuous additive supply to the fuel, which also leads to its continuous consumption and to accumulation of metal oxide (ash) inside the DPF[23]. However, latest developments of FBC, e.g. Fe-based FBC described by Rocher et al.[10], aimed at mitigation of this drawback mainly by reduction of the required FBC dosing rates.It is important to have an integrated simulation tool that will enable comparison between various types ofregeneration methods, in order to select the optimal configuration for the given type of vehicle and its driving characteristics. Development of such a tool is the goal of the work presented in this paper. It is the same objective as in[24]. Nevertheless, authors believe that their proposed model is useful due to its simplicity, more accurate heat transfer prediction (because of using two-dimensional scheme) and obtained new results.New expression for the oxidation reaction rate with non-linear dependence of it on a reagent concentration is proposed, which makes possible simulation of both O2- and NO2-carbon oxidation reactions. For cases of catalytic coating a modification of the known two-layer model is suggested. A fraction of soot that has been oxidized with the help of a catalyst is not invariable in the first layer, but it exponentially depends on the distance from a channel wall of the particle trap.In macro-scale, for calculation of a temperature field in the whole filter the two dimensional finite differences scheme is used. A comparative study of various DPFregeneration methods is performed using the developed model, corresponding computer code and based on the proposed new approach.
2. Simulation Model
2.1. Main Assumptions
- The simulation model described here is for particulate filters with a structure of alternate plugged channels (blocked at their ends – wall-flow filters, proposed by Howitt&Montierth[25]). The continuum approach for this structure, which has been first introduced by Aris[26], is adopted for calculation of the filter temperature field, T(z,x). Following Zhang et al.[27], a single temperature field (two-dimensional in the model) is used for the multiphase continuum consisting of three phases: exhaust gas, porous walls and particulate matter, excluding cases when part of the filter is blocked by the accumulated deposits. In the latter case there are only two phases remain: the structure walls and the particulate matter. Accumulation of soot in the wall is not considered. The findings of Mulone et al.[28] show that "theoretical wall capacity of particle collecting is never fully exploited allowing for a low impact of the wall onto backpressure". The assumption of the pressure derivative steadiness along axis z is adopted. The latter allowed considering the momentum balance integrally.Other assumptions, for the whole filter as a continuum, are as follows: the deposits distribution over the filter length (z-axis) is uniform; the porous channel walls and soot deposits on them are taken into account by effective values of densities, radial thermal conductivities and volumetric specific powers; the continuum velocity is directed along the filter axis.This assumption is based on the fact that the exhaust gases from the inlet channels of the trap arrive to the outlet channels from all directions.Thus, there is no radial flow in the macro scale. Obtained T(z,x) is used for the soot deposit calculations in the channels along the radial coordinate x after T(z,x) averaging over axis coordinate z. These calculations for each radial coordinate x are performed by applying the one-dimensional one- or two-layer model. One-layer model is used for investigation of the non-catalytic and FBC catalyzed carbon oxidation by nitrogen dioxide or/and oxygen. The investigation of filters that are coated with a catalyst is performed by means of the two-layer mathematical model, similar to that developed by Konstandopoulos and Kostoglou[19] and differs from the latter by exponential dependence of the catalytic fraction of soot oxidation in the first layer on the distance from a channel wall of the particle trap coated by a catalyst. This model allows considering catalytic and non-catalytic oxidation by O2and by NO2separately or as a combination. The following assumptions similar to those of Mohammed et al.[29], for the single channel, are made: the temperatures of the gas, the species concentration, the gas velocities and properties are taken as average across the channelcross-section; there are no variations of the species concentration in the exhaust gas along the length of the inlet channel; the gas is considered as ideal.Based on these assumptions, the equations of: reaction rate; soot & ash deposit evolution; formation of NO2 by catalyzing the oxidation of NO (if appropriate); total pressure drop; mass, momentum and energy conservation were solved in this model. All the heat transfer mechanisms: convection, conduction and radiation were taken into account by calculation of the effective value of thermal conductivity in the radial direction. The heat transfer in the axial direction is caused by mass transfer, with the exception of clogged parts of the filter (if existing). Only thermal conduction takes place in the latter regions.
2.2. Basic Equations
- The new general equation for the oxidation reaction rate,
 [kg/(m2s)] of reagent
  , is proposed
 | (1) |
 – mass fraction of reagent
 ; S – soot specific surface, equal to 5.5106[m-1] according to[30];d– soot layer thickness[m];k– kinetic coefficient[m/s]; Iis integer (1 or 2),
  is CO selectivity for O2-or NO2-carbon oxidation and
  is a fractional exponent. This expression is a modification of the well-known Bissett equation[30] and differs from it by the presence of a fractional exponent
  . The latter allows better prediction of the reaction rate forcarbon-by-NO2 oxidation, which fits well with the experimental findings of Messerer et al.[12].The basic equation for the oxidation reaction rate by O2,
  [kg/(m2s)], obtained by Bissett[30], that corresponds to
  =1, I=1, X = O2,φCO =fCO/2in equation (1), is implemented in this work for the cases of catalytic and non-catalytic O2-carbon oxidation:
 | (2) |
 | (3) |
 . The values of these parameters are taken from Konstandopoulos&Kostoglou[15] and Huynh et al.[31]: Teff = Ef / R = 3000 K, T'eff = E'f / R = 2575 K; α= 0.02,α'= 3.57; γ= γ' = 0.21, where R is the universal gas constant. The kinetic coefficient k in eq. (1) (for O2 oxidation) is given by:
 | (4) |
 = 150 – 180kJ/mol and
  = 102 – 120kJ/mol. In the case of catalytic oxidation by oxygen, the two mechanisms are competitive and according to Konstandopoulos&Kostoglou[15], the reaction rates for thermal and catalytic carbon oxidation are:
 | (5) |
 | (6) |
 | (7) |
 | (8) |
 is non-equal 1 – see eq. (1). In the case of carbon-by-NO2 oxidation, the reaction rate, R, depends only on the NO2concentration yNO2 and the equation for it reduces to-dyNO2/dt=
  . For the first-order mass evolution reaction
  = 1 and an integration of the latter equation results in the form of eq. (1) for carbon-by-NO2 oxidation in DPF for the reaction rate on the channel wall of the trap, as was obtained in[30]. However, the simulation results of the reaction rate with
  = 1 for carbon-by-NO2 oxidation were found to be lower by two orders of magnitude than the experimental data of Messerer et al.[12]. This indicates that the reaction is not really of the first order. Therefore, the appropriate reaction is called in this paper as the “pseudo first order reaction”, and the value of
  adopted in this work is equal to 0.5 since it is best suited to the experimental results obtained in[12]. Therefore, the reaction rate equation for carbon-by-NO2 oxidation can be written as:
 | (9) |
 is dominant[20], it is possible to set the selectivity gCO as equal to 0. The kinetic coefficient kNO2(used in eq. 9) and obtained by Jacquot et al.[16] is adopted here:
 | , (10) |
 | (11a) |
 | (11b) |
 | (12) |
 | (13) |
 | (14) |
2.3 Modifications to the Basic Equations in the Two-Layer Model
- The carbon oxidation process in the second layer is not affected by the presence of a catalyst in the case of catalytic coatings on the filter wall. Hence, equations (1 - 4, 8) for O2 oxidation and (9 - 12) for NO2 oxidation are of the same form in this case. It is evident that in eqs. (1) and (9) for the corresponding reaction rates the soot layer thickness d is replaced by d2 = d- d1. In eq. (8) for the soot deposit evolution, the term includingRcatO2 is set equal to 0 and the term
 is added on the RHS (as for eq. 13) in the case of NO2 oxidation. In this case the soot evolution equation is:
 | (15) |
 | (16) |
 | (17) |
2.4 Other Equations
- Pressure drop along the channel of the diesel particulate trap is expressed as in[36]:
 | (18) |
 | (19) |
 | (20) |
 | (21) |
 | (22) |
3. Model validation
- The suggested new modification of the classic Bissett equation was validated by comparison of the predicted data on soot oxidation rate by NO2 with those received by Ahmadinejad et al.[14] under isothermal conditions. The results of this comparison are shown in Table 1.
|
| ||||||||||||||||||||
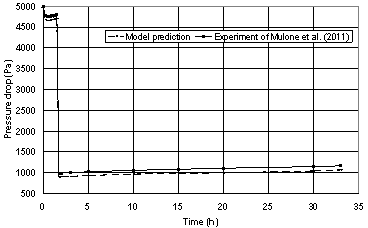 | Figure 1. Comparison of the model prediction with the experimental data of Mulone et al.[28] for the pressure drop across CCRT |
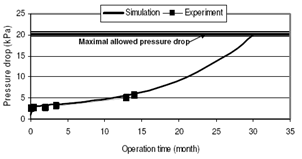 | Figure 2. Pressure drop on CRT – comparison of experimental and simulation data |
4. Results and Discussion
|
4.1. Catalytic and Non-Catalytic O2-Oxidation
- Fig. 3 shows the soot layer thickness d in the filter channels as a function of the temperature at equilibrium conditions for non-catalytic O2-oxidation and for two values of the activation energy. As can be seen, the levels of d under these conditions are reasonable and lead to pressure drop values on the DPF of less than 0.1bar at temperatures of 400℃ and 540℃ for Eactof 150 and 180kJ/mol, respectively. The latter value, suggested by Bissett[30], seems to be closer to the actual one: according to[12], non-catalytic O2-oxidation requires temperatures of about 600℃.
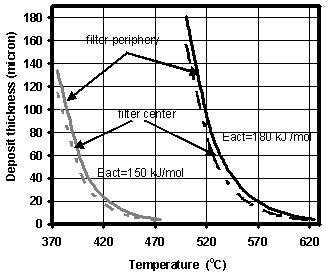 | Figure 3. Soot layer thicknesses in the filter channels (in center and periphery) as a function of the temperature: non-catalytic O2-oxidation. Soot mass flow rate – 4.2 mg/sec |
4.2. Critical Temperatures Wherein Clogging of the Filter Periphery Starts
- The curves in Figs. 3 and 4 illustrate thickness of the accumulated soot layer d for the filter center and filter periphery. The slight difference between them results only from heat losses in the filter periphery. The graphs for d as a function of the filter radius are nearly straight lines. For catalytic O2-oxidation (with catalytic coating) the behavior can be much different. Here the soot layer thickness, which is a function of the radial coordinate x, and the resulting pressure drop are rather small, until the inlet gas temperature leads to the temperature at the filter periphery (which is lower than the temperature at the filter center due to heat losses on the outer filter surface) that is higher than a fixed critical value, Tcr. At temperatures lower Tcr a clogging process will start from the filter periphery and continue to full clogging of the filter. The latter effect is a consequence of the filter conductivity increase in the clogged zone. When the soot layer thickness becomes higher than d1, the catalytic fraction β in the second layer becomes equal to zero, and the catalytic oxidation process is interrupted there. This normally leads to accelerated soot accumulation. If the filter wall temperature at the periphery is lower than Tcr and the temperature at the filter center is still above Tcr, the soot accumulation at the filter periphery channels may drastically exceed that in the filter center. The calculations, using the constant β approach, show that for β = 0.5 (this value is taken according to[15]), d1= 10 µm, (as in[19]) and Eact = 140kJ/mol (according to the review[37]) catalytic coating reduces Eact by 30-80kJ/mol and Tcr = 470℃. In the case of using the variable β approach according to eq. (14), the same Eact and the same value of β(0) = 0.5, give Tcr = 511℃. The former value is too ‘optimistic’: many published experimental results indicate that catalytic coating can reduce oxidation temperatures by 13 – 42℃ only, e.g.[22]. Indeed, for the non-catalytic O2-oxidation, as was mentioned earlier, the predicted value of acceptable temperaturewas 540℃. The case of a more active catalytic coating with activation energy reduced down to 120kJ/mol (reduction of 60 kJ/mol compared to the value of 180kJ/mol that is relevant for the non-catalytic O2 oxidation) was studied too. For this case (the other parameters were kept as before) the value of Tcr = 400℃ was obtained. The most optimistic scenario of Eact reduction to 100 kJ/mol gives Tcrvalue of 303℃.
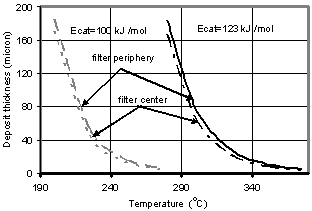 | Figure 4. Soot layer thickness in the filter channels (in center and periphery) as a function of the temperature: O2- oxidation with a fuel-borne catalyst (β = 0.95).Soot mass flow rate – 4.2 mg/sec |
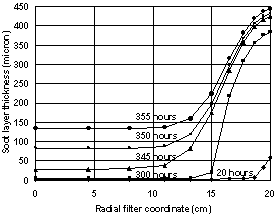 | Figure 5. Filter clogging dependenceon time. Soot mass flow rate – 4.2 mg/sec |
4.3. FBC- and NO2 – Oxidation
- Fig. 4 shows the soot layer thicknesses for carbon oxidation by means of FBC for two values of the activation energy: 100[40] and 123kJ/kmol. The latter has been obtained by Fino&Specchia[17] using perovskite on CeO2 catalyst. The results in Fig. 4 for the soot layer thickness d are obtained for β = 0.95. This value of catalytic fraction is chosen, as a conservative reproduction of the value β = 0.97 suggested by Konstandopoulos&Kostoglou[15]. As can be seen from Fig.4, acceptable temperatures for filter operation start at 220℃ and 310℃, respectively. These temperatures are sufficiently low even for the latter case of Eact.The comparison of these results with the latest experimental data of Rocher et al.[10] on development of the Fe-based FBC shows that activation energy value of100kJ/kmol is too optimistic. The value of 123 kJ/kmol gives much more realistic results for the temperatures of soot burning with aid of nowadays available FBC.The modelling results for non-catalytic NO2-oxidation process together with O2-oxidation are displayed in Fig. 6 for the two values of nitrogen oxide concentration: 100 and 200 ppm.In this case, following eq. (12) the soot layer thickness dependence on temperature is non-monotonic. In these calculations the values of E(1)NO2 = 45.5 kJ/mol for C+2NO2→CO2+2NO and E(2)NO2 = 59.4 kJ/mol for the C+NO2→CO+NO reaction[17] have been used. The corresponding soot depositions are acceptable (pressure drop values of less than 0.1 bar) at temperatures higher than 270℃ and 325℃ for NO concentrations of 200 and 100ppm, respectively. The former value of T is very promising, whereas the latter is less acceptable, because lower temperatures prevail quite often in real driving patterns. Moreover, prediction results show that relatively low NO concentration (100ppm) yields too large soot layer thicknesses also in the medium T-range 450 – 510℃. In this range, the NO2-oxidation process is damped out, because of reduced NO to NO2 conversion (according to eq. (12)), while the O2-oxidation does not occur yet. At higher T, the two curves in Fig. 6 coincide, since the O2-oxidation process dominates. It is possible to completely avoid the disadvantage of increasing the soot layer thickness at medium temperatures of 450 – 510℃ by means of a combination ofNO2- and O2- oxidation processes using a catalyst coating.
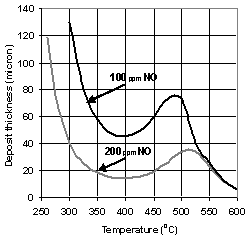 | Figure 6. Soot layer thickness in the filter channels as a function of the temperature: O2- and NO2-oxidation without catalyst. Soot mass flow rate – 4.2 mg/sec |
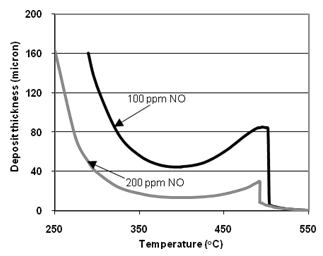 | Figure 7. Soot layer thicknesses in the filter channels as a function of the temperature: O2- and NO2-oxidation with catalytic coating. a) Eact = 140 kJ/mol; b) Eact = 123 kJ/mol. Soot mass flow rate – 4.2 mg/sec |
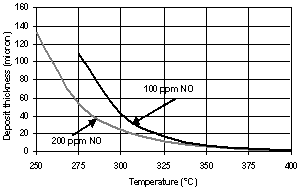 | Figure 8. Soot layer thicknesses in the filter channels as a function of the temperature: O2- and NO2-oxidation with FBC. Soot mass flow rate – 4.2 mg/sec |
5. Conclusions
- The developed model, based on the proposed new approach and corresponding computer code, enables comparative study of various DPFregeneration methods. New expression for the reaction rate of soot oxidation with non-linear dependence of it on a reagent concentration is proposed.It makes possible simulation of both O2- and NO2-carbon oxidation reactions. For cases of catalytic coating a modification of the known two-layer model is suggested. According to this modified model, a fraction of soot that is oxidized with the help of catalytic coating is not invariable in the first layer, but it exponentially depends on the distance from a channel wall of the particle trap. Heat transfer in the particle trap as a continuum is considered by the two dimensional finite differences scheme.Soot oxidation in diesel particulate filters by O2, as well as NO2 with O2, have been investigated for various cases of non-catalytic oxidation and oxidation in presence of catalytic coating and fuel-borne catalyst. In the case of soot oxidation using catalytic coating, the phenomenon of critical temperature emergence was observed at first. It can be explained in the framework of the applied two-layer model by abrupt reduction of the reaction rate at the border of the second layer. Calculation results of soot oxidation by NO2 with O2using catalytic coating show that soot is significantly oxidized at temperatures above 250℃. This finding is in a good agreement with data obtained by Shejbal et al. [24].Dependence of the soot oxidation in presence of catalytic coating on activation energy is quite weak at relatively low temperatures of 250-350℃ and strongly enhances with the temperature rise. This can be clearly illustrated for the case of NO concentration equal 200 ppm by the fact that the soot layer thickness of 160 micron is achieved almost at the same temperature of 250℃ for both studied values of Eact (140 and 123kJ/mol). Conversely, at higher temperatures almost full soot burnout is achieved at 390oC for Eact = 123kJ/mol compared with 500℃ for Eact = 140kJ/mol. The developed model allows selection of an acceptable soot oxidation method depending on available exhaust gas temperatures and nitrogen oxides concentrations. In future research the model can be further developed to cover other methods of soot regeneration that were not addressed in this study. The Bissett - type equations (such as eq. 1) can be a good approximation for modeling more complicated cases with more reactants.
ACKNOWLEDGEMENTS
- This work was supported by the Israeli Ministry of Environment Protection (grant number 4-107 (2008409)).
References
| [1] | T. V. Johnson,"Review of diesel emissions and control", SAGE Journals, International Journal of Engine Research, vol.10, no.5,pp.275-285, 2009. |
| [2] | A.G. Konstandopoulos, E. Papaioannou,"Update on the science and technology of diesel particulate filters",Hosokava Powder Technology Foundation, KONA Powder and Particle Journal,vol.26,pp.36-65, 2008. |
| [3] | L. Tartakovsky, S. Hausberger, M. Gutman, M. Veinblat, and Y. Zvirin,"Retrofit aftertreatment systems for diesel engines", in Proceedings of the 14th International Scientific Symposium on Transport and Air Pollution, pp.221-230,2005. |
| [4] | K Sung, J Kim, R D Reitz,"Experimental study of pollutant emission reduction for near-stoichiometric diesel combustion in a three-way catalyst",SAGE Journals, International Journal of Engine Research, vol.10, no.5,pp.349-357, 2009. |
| [5] | J. Warner, D. Dobson, G. Cavataio,"A Study of Active and Passive Regeneration Using Laboratory Generated Soot on a Variety of SiC Diesel Particulate Filter Formulations", SAE International Journal on Fuels &Lubricants, vol.3, no.1, pp.149-164, SAE Paper 2010-01-0533,2010. |
| [6] | H Kato, K Ito, H Suda, J Kusaka, T Mori, F Tsurumi, N Masaki, K Hirata, H Akagawa, "Development of a Quasi-Two-Dimensional Model for Analyzing Continuous Regeneration—Diesel Particulate Filter States during Continuous and Active Regeneration", SAGE Journals, International Journal of Engine Research, vol.12,no.1,pp.1-13,2011. |
| [7] | P. Roth, T. Eckhardt, B. Franz, J. Patschull,"H2O2-assisted regeneration of diesel particulate traps at typical exhaust gas temperatures", Elsevier, Combustion & Flame,vol.115, p.28,1998. |
| [8] | H. Christensen, J. Dinesen, H. Engell, K. Hansen,"Electrochemical reactor for exhaust gas purification", SAE Technical Paper, 1999-01-0472, 1999. |
| [9] | B. W. L. Southward, S. Basso, M. Pfeifer,"On the development of low PGM content direct soot combustion catalysts for diesel particulate filters", SAE Technical Paper, 2010-01-0558, 2010. |
| [10] | L. Rocher, T. Seguelong, V. Harle, M. Lallemand, M. Pudlarz, M. Macduff,"New generation fuel borne catalyst for reliable DPF operation in globally diverse fuels", SAE Technical Paper, 2011-01-0297, 2011. |
| [11] | P. Hawker, N. Myers, G.Huthwohl, H. Vogel, B.Bates, L. Magnusson, P. Bronneberg,"Experience with a new particulate trap technology in Europe", SAE Technical Paper, 970182,1997. |
| [12] | A. Messerer, R. Niessner, U. Posch,"Comprehensive kinetic characterization of the oxidation and gasification of model and real diesel soot by nitrogen oxides and oxygen under engine exhaust conditions: measurement,Langmuir-Hinshelwood and Arrhenius parameters",Elsevier, Carbon,vol.44,pp.307-324, 2006. |
| [13] | A.G. Konstandopoulos, M. Kostoglou, E. Scaperdas, E. Papaioannou, D. Zarvalis, E. Kladopoulou,"Fundamental Studies of DPF", SAE Technical Paper, 2000-01-1016, pp. 683-705,2000. |
| [14] | M. Ahmadinejad, A. Tsolakis, J.M. Becker, C.F. Goersmann, A.D. Newman, T.C. Watling,"Modeling of soot oxidation by NO2 in a Diesel Particulate Filter", SAE 2011-01-2083, pp. 115-125, 2011. |
| [15] | A.G. Konstandopoulos, M. Kostoglou,"Reciprocating flow regeneration of soot filters", Elsevier, Combustion and Flame, vol.121, pp.488-500, 2000. |
| [16] | F. Jacquot, V. Logie, J.F. Brilhac, P. Gilot,"Kinetics of the oxidation of carbon black by NO2 – influence of the presence of water and oxygen", Elsevier, Carbon,vol.40,pp.335-343, 2002. |
| [17] | D. Fino, V. Specchia,"Compositional and structural optimal design of a nano-structured diesel-soot combustion catalyst for a fast-regenerating trap",Elsevier, Chemical Engineering Science,vol.59,pp.4825-4836, 2004. |
| [18] | P. Palmisano, N. Russo, P. Fino, D. Fino, C. Badini,"High catalytic activity of SCS-synthesized cerium towards diesel soot combustion",Elsevier, Applied Catalysis B: Environmental,vol.69,pp.85-92, 2006. |
| [19] | A.G. Konstandopoulos, M. Kostoglou,"Periodically reversed flow regeneration of diesel particulate traps", SAE Technical Paper, 1999-01-0468,pp.289-302,1999. |
| [20] | A.G. Konstandopoulos, E. Skaperdas, J. Warren, R. Allansson,"Optimized filter design and selection criteria for continuously regenerated particle traps", SAE Technical Paper, 1999-01-0468,pp.279-288,1999. |
| [21] | S. Jelles, M. Makkee, J. Moulijn, J. Acres, J. Peter-Hoblyn,"Diesel particulate control", SAE Technical Paper, 1999-01-0113,pp.69-74,1999. |
| [22] | K. Hinot, H. Burtscher, A.P. Weber, G. Kasper,"The effect of the contact between platinum and soot particles on the catalytic oxidation of soot deposits on a diesel particle filter",Elsevier, Applied Catalysis B: Environmental, vol.71,pp.271-278,2007. |
| [23] | M. Gutman, L. Tartakovsky, Y. Zvirin,"Pollutant Formation and Control: Fuel Effects on Emissions", In: E. Sher (ed) Handbook of Air Pollution From Internal Combustion Engines. Academic Press, pp. 548 – 651, 1998. |
| [24] | M. Schejbal, M. Marek, M. Kubicek, P. Koci,"Modeling of diesel filters for particulates removal", Elsevier, Chemical Engineering Journal,vol.154,pp.219-230, 2010. |
| [25] | J.S. Howitt, M.R. Montierth,"Cellular ceramic diesel particulate filter", SAE Technical Paper, 810114,pp.493-501,1981. |
| [26] | R. Aris, "De exemblosimulacrorumcontinuorumdiscrita-lumque",Springer, Archive for Rational Mechanics and Analysis,vol.70, pp.203-212, 1979. |
| [27] | Z. Zhang, S.L. Yang, J.H. Johnson,"Modeling and numerical simulation of diesel particulate trap: performance during loading and regeneration", SAE Technical Paper, 2002-01-909,pp.1399-1411,2002. |
| [28] | V. Mulone, A. Cozzolini, P. Abeyratne, D. Littera, M. Thiagarajan, M.C. Besch, M. Gautam,"Soot modeling for advanced control of diesel engine aftertreatment", ASME, Journal of Engineering for Gas Turbines and Power,vol.133, pp.122804-1 – 122804-12,2011. |
| [29] | H. Mohammed, A.P. Triana, S.L. Yang, J.H. Johnson,"An advanced 1D 2-layer catalyzed diesel particulate filter model to simulate: filtration by the wall and particulate cake, oxidation in the wall and particulate cake by NO2 and O2 and regeneration by heat addition", SAE Technical Paper, 2006-01-467, pp.171-191,2006. |
| [30] | E.J. Bissett,"Mathematical model of the thermal regeneration of a wall flow monolith diesel particulate filter",Elsevier, Chemical Engineering Science,vol.39,pp.1233-1244, 1984. |
| [31] | C.T. Huynh, J.H. Johnson, S.L. Yang, S.T. Bagley, J.R. Warner,"A one-dimensional computational model for studying the filtration and regeneration characteristics of a catalyzed wall-flow diesel particulate filter", SAE Technical Paper, 2003-01-0841,pp.620-646, 2003. |
| [32] | M. Jeguirim, V. Tschamber, J.F. Brilhac,"Kinetics of catalyzed and non-catalyzed soot oxidation with nitrogen dioxide under regeneration particle trap conditions",Wiley, Journal of Chemical Technology andBiotechnology,vol.84,pp.770-776,2009. |
| [33] | M. Jeguirim, K. Villani, J.F. Brilhac and J.A. Martens,"Ruthenium and platinum catalyzed carbon oxidation: a comparative kinetic study",Elsevier, Applied Catalysis B: Environmental,vol.96,pp.34-40,2010. |
| [34] | B.J. Cooper, J.E. Thoss,"Role of NO in diesel particulate emission control", SAE Technical Paper, 890404,pp.612-624,1989. |
| [35] | P. Darcy, P. Da Costa, H. Mellottee, J.M. Trichard, G. Djega-Mariadassou,"Kinetic of catalyzed and non-catalyzed oxidation of soot from a diesel engine",Elsevier, Catalysis Today,vol.119, pp.252-256,2007. |
| [36] | A.G. Konstandopoulos, J.H. Johnson,"Wall-flow diesel particulate filters–their pressure drop and collection efficiency", SAE Technical Paper, 890405,pp.625-647,1989. |
| [37] | P. Versaevel, H. Colas, C. Rigaudeau, R. Noirot, G.S. Koltsakis, A.M. Stamatelos,"Some empirical observations on diesel particulate filter modeling and comparison between simulations and experiments", SAE Technical Paper, 2000-01-0477,pp.312-323,2000. |
| [38] | N. Rakovec, S. Viswanathan, D. Foster,"Micro-scale study of DPF permeability as a function of PM loading", SAE Technical Paper, 2011-01-0815,pp.913-921,2011. |
| [39] | L. Tartakovsky, J. Czerwinski, Y. Aleinikov, B. Aronov, V. Baybikov, M. Gutman, M. Veinblat, Y. Zvirin,"Retrofitting of urban buses in Israel with particulate traps – first results", in Proceedings of the 13th World Clean Air and Environmental Protection Congress (IUAPPA), Transport, Environment and the Sustainable City, Paper No. 1, 2004. |
| [40] | B.R. Stanmore, J.F. Brilhac, P. Gilot,"The oxidation of soot: a review of experiments, mechanisms and models", Elsevier, Carbon,vol.39,pp.2247-2268,2001. |
| [41] | ShujiFujii, Tsuyoshi Asako,"Design optimization of non-catalyzed DPF from viewpoint of back pressure in ash loading state", SAE Technical Paper,2011-01-2091,pp.687-698,2011. |
| [42] | T. V. Johnson,"Review of diesel emissions and control", SAE Technical Paper, 2010-01-0301,pp.16-29,2010. |
| [43] | N. Soeger, L. Mussmann, R. Sesselmann, G. Leippe, C. Gietzelt, O. Bailey, M. Hori,"Impact of aging and NOx/Soot ratio on the performance of a catalyzed particulate filter for heavy duty diesel applications", SAE Technical Paper, 2005-01-0663, 14p., 2005. |
 Abstract
 Reference
 Full-Text PDF
 Full-Text HTML