-
Paper Information
- Previous Paper
- Paper Submission
-
Journal Information
- About This Journal
- Editorial Board
- Current Issue
- Archive
- Author Guidelines
- Contact Us
Energy and Power
p-ISSN: 2163-159X e-ISSN: 2163-1603
2012; 2(4): 74-80
doi: 10.5923/j.ep.20120204.06
An Efficient Particle Swarm Optimization with Time Varying Acceleration Coefficients to Solve Economic Dispatch Problem with Valve Point Loading
 Abstract
 Reference
 Full-Text PDF
 Full-Text HTML
Bhuvnesh Khokhar 1, K. P. Singh Parmar 2, Surender Dahiya 1
1Department of Electrical Engineering, DCRUST, Sonipat, 131039, India
2CAMPS, National Power Training Institute, Faridabad, 121003, India
Correspondence to: Bhuvnesh Khokhar , Department of Electrical Engineering, DCRUST, Sonipat, 131039, India.
| Email: |  |
Copyright © 2012 Scientific & Academic Publishing. All Rights Reserved.
This paper proposes a particle swarm optimization approach with time varying acceleration coefficients(TVAC_PSO) for an extensive study of the economic dispatch problem with valve point loading(EDVPL). An optimal short-term thermal generation schedule for 24 time intervals has been presented for the same purpose. In this paper, transmission losses and valve-point loading(VPL) have been considered. The VPL effect results in higher order nonlinearities in the input-output characteristics of a generator. For demonstrating the effectiveness of the proposed method two test systems, first one comprisingof three generators and the second one comprising of thirteen generators,have been considered. The performance of the proposed method has been compared with variousPSOstrategies. The results show that the proposed TVAC_PSO strategy provides comparatively better solutions in terms of total fuel cost as compared to other PSO strategies.Also, the global search capability is enhanced and premature convergence is avoided.
Keywords: Economic Dispatch, Particle Swarm Optimization, Time Varying Acceleration Coefficients, Valve Point Loading
Article Outline
1. Introduction
- Economic Dispatch(ED) is one of the most important issues in power system operation. The main aim of ED is to minimize the operating cost of units, while satisfying certain constraints[1-3]. Thus, it can be stated that ‘the economic dispatchproblem is to define the generation level of each plant so that the total cost of generation and transmission is minimum for a prescribed schedule of loads’[1]. Certain conventional methods have been developed in the previous years for solving the ED problem. Some of these methods include lambda-iteration method, direct search method, Newton-Raphson method, efficient method[1,5-7]. In these methods assumption is made that the incremental cost curves of the generators are monotonically increasing piece-wise linear. However, in practical case the cost curves of the generators are highly non-linear and hence, such an assumption may not give accurate results.The nonlinearities in the generator operation are due to valve-point loading effects, prohibited operating zones, etc.[1].In recent years certain artificial intelligence(AI) techniques such as Fuzzy Logic(FL)[8,9], Artificial Neural Network(ANN)[10-12], Genetic Algorithm(GA)[13-17], etc. have been successfully applied to the ED problems for units having non-linear cost functions. However, problem facedby FL is its low accuracy and large computational complexity.In ANN adopting an unsuitable sigmoidal function may suffer from excessive numerical iterations, resulting in huge calculations.GA, which emulates from natural genetic operations, has emerged as a candidate for many optimization problems(including ED) due to its flexibility and efficiency. GA is a stochastic searching algorithm. In some GA applications, certain constraints including network losses and valve-point effects were considered for the practicability of the proposed method. Among these Walters and Sheble[13] presented a GA model for solving the ED problem including valve-point effects. Also Chen and Chang[15] presented a model that included network losses and valve-point effects. For an efficient solution to the ED problem, Chiang[17] and Amjady and Nasiri-Rad[18] presented improved and real-coded GA models respectively that can obtain high quality solutions in lesser time.Although the GA model has been employed successfully in various optimization problems, recent researches show some difficulties with its implementation. GA shows quiet a large inefficiency when being implemented to objective functions in which the parameters to be optimized are highly correlated[19]. Also premature convergence is another problem that reduces its searching capability[20].Particle swarm optimization(PSO) was developed by Kennedy and Eberhart in 1995 motivated by social behavior of organisms such as fish schooling and bird flocking[21]. It is one of the modern heuristic algorithms and has been found to be efficient and robust in solving non-linear problems[21-23]. The PSO technique can generate high quality solutions taking lesser computational time and providing a faster convergence as compared to other AI techniques[20,24-25,31]. In standard PSO(SPSO)[21], particles move around in the search space with the help of two accelerating components. One component, known as the cognitive component, controls the local exploration of the particles, while the second component, known as the social component, guides the global search capability of the particles. Kennedy and Eberhart[21] have shown that a high value of the local component will result in excessive exploration of the particles through the search space while a high value of the social component will result in a premature convergence of the particles. Various researchers[23,26,32-34] have found that the SPSO quickly finds a good local solution but gets stuck to it for rest of the iterations without a further improvement.In order to overcome the above problems, a time varying acceleration coefficient[26] PSO(TVAC_PSO) strategy has been employed in this paper.The TVAC_PSO strategy finds a proper balance between the local and the global component and hence, the problem of premature convergence has been overcome to a much greater extent.The performance of the proposed TVAC_PSO strategy has been compared with SPSO[21], New PSO[27] and Anti-predatory PSO[28]. In order to show the superiority of the TVAC_PSO strategy over other strategies two test systems have been taken. The first test system consists of three generating units[13] while the second test system contains thirteen generating units[30]. A 24-hour short-term thermal generation schedule[4] has been presented for the three generator system with a peak demand of 850 MW to further add to the effectiveness of the proposed strategy.
2. Economic Dispatch with Valve-Point Loading(EDVPL)
- The input-output characteristics(or cost functions) of a generator are approximated using quadratic or piece-wise quadratic functions, under the assumption that the incremental cost curves of the units are monotonically increasing piece-wise linear functions. However, real input-output characteristics display higher order nonlinearities and discontinuities due to valve point loading(VPL) in fossil fuel burning plants. The valve-point loading effect has been modeled in as a recurring rectified sinusoidal function[1].The generating units with multi-valve steam turbines exhibit a greater variation in the fuel cost functions. The valve-point effects introduce ripples in the heat-rate curves. Mathematically, ED problem considering VPL[1] is defined as:Where,
 is the fuel cost,
 is the active power generated,And
  are the fuel cost coefficients of the
  generator.The objective of the EDVPL problem is to determine the optimal power output
  of each of the generators for a total load demand of PD. Total fuel cost
  for NG generators is minimized subject to the equality and the inequality constraints. Hence, the optimization problem can be stated as[1]:Minimizesubject to the constraints given as:a)the equality constraint– b)the inequality constraint–The total transmission losses PL is a function of unit power outputs that can be expressed using B-coefficients as[1]
3. Review of Various PSO Strategies
- Since the introduction of the PSO, various PSO based strategies have been successfully applied to deal with the ED problems. Some of the PSO strategies applied to the ED problems are presented briefly in this paper and their performances have been compared with the presented TVAC_PSO strategy.
3.1. Standard PSO(SPSO)
- SPSO[21], as an optimization tool, provides a population-based search procedure in which individuals called particles change their position(states) with time. In a PSO system, particles fly around in a multi-dimensional search space. During flight, each particle adjusts its position according to its own experience and the experience of neighbouring particles, making use of the best position encountered by it and neighbours. The swarm direction of a particle is defined by the set of particles neighbouring the particle and its history experience. Instead of using evolutionary operation to manipulate the individuals, like in other evolutionary computational algorithms, each individual in PSO flies in the search space with a velocity which is dynamically adjusted according to its own flying experience and its companions flying experience. Let p and v denote a particle’s co-ordinate(position) and its corresponding flight speed(velocity) in a search space respectively. Therefore, each
 particle is treated as a volume less particle, represented as
  in the d-dimensional space. The best previous position of the
  particle is recorded and represented as
  The index of the best particle among all the particles is treated as global best particle, is represented as
 . The velocity for the
  particle is represented as
 The modified velocity and position of each particle can be calculated using the current velocity and the distance from
  to
to  as shown in the following formulas,In the above equation,c1 and c2 are known as the acceleration coefficients that pull each particle towards the
  and
and positions. Rand( ) and rand( ) are the uniform random numbers between[0,1]. The term rand( )
 is called the cognitive component. The term Rand( )
  is called the social component. w is the inertia weight factor.Low values of acceleration coefficients allow particles to roam far from the target regions before being tugged back. On the other hand, high values result in abrupt movement towards, or past target regions. Hence, the acceleration constants c1and c2 are often set to be 2.0 according to past experiences. A large inertia weight factor enhances global exploration while a low inertia weight factor helps in local search. Hence, a suitable selection of inertia weightprovides a balance between global and local explorations, thus requiring lesser iterations on average to find a sufficiently optimal solution. As originally developed[23], w often decreases linearly from about 0.9 to 0.4 during a run. In general, the inertia weight w is set according to the following equation,Here
  is the maximum inertia weight, wmin is the minimum inertia weight, It is current no. of iterations,
  is maximum no. of iterations.
3.2. New PSO(NPSO)
- A new variation in the SPSO by splitting the cognitive component of the SPSO into two different components was proposed by Selvakumar and Thanushkodi[27]. The first component is called good experience component. That is, the particle has a memory about its previously visited best position. This component is exactly the same as the cognitive component of the SPSO. The second component is given the name bad experience component. The bad experience component helps the particle to remember its previously visited worst position. To calculate the new velocity, the bad experience of the particle is also taken into consideration. The new velocity update equation proposed is given byThe acceleration coefficients
 and
and  help the particles to move towards their previous best positions and away from their previous worst positions respectively thereby increasing the exploration capability.
  is dimension d of the own worst position of the
  particle until iteration t.
3.3. Anti-predatory PSO(APSO)
- Another SPSO variant proposed by Selvakumar and Thanushkodi[28] included an anti-predatory property. The anti-predatory property, which is natural among particles, helps the swarm escape from the predators. This strategy models the predators as the worst result points and the new model is named anti-predatory PSO. The APSO is developed by splitting both the cognitive and the social behaviours of the SPSO. Here, along with the cognitive component, the social component is also split into global good experience and global bad experience components. The velocity update equation of the APSO model is given byHere,
 is global worst position of member d until iteration t. The acceleration coefficient
  helps the particles to accelerate towards their previous global best positions and
  helps the particles to move away from their previous worst positions. By using the bad experiences, particle always by-passes its previous worst positions. Hence, exploration capability is further enhanced.
4. Proposed PSO strategy
4.1. PSO with Time-varying Acceleration Coefficients (TVAC_PSO)
- In this paper, the TVAC_PSO[26] strategy has been used to solve the EDVPL problems. Basic purpose of using the time varying acceleration coefficients is to improve the global exploration in the early part of the process and to enhance the convergence of the particles in the later stages of the process. This is done by varying the acceleration coefficients c1 and c2 with time in such a manner that the cognitive component reduces and the social component increases as iterations increase. In short, it can be stated that a large cognitive component and a small social component at the beginning of the process help the particles to explore the search space in a better way while a smaller cognitive component and a larger social component at later stages of the process allow the particles to converge to the global optima. The time varying acceleration coefficients are given as[29]:
4.2. Algorithm for TVAC_PSO
- The sequential steps of the proposed TVAC_PSO strategy are given below.Step1: Representation of the swarm- Since the decision variables of the economic dispatch problem are the real power generations, they are used to form the swarm. The set of real power output)(Pa)of all the generators is represented as the position of the particle in the swarm. For a system with NG generators, the particle position is represented as a vector of length NG. If there are NP particles in the swarm, the complete swarm is represented as a matrix as shown below:
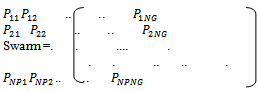 Where
Where  is the j th position component of particle i and it represents the real power generation of generator j of the possible solution i.Step2: Initialization of the swarm- The particles of the swarm are initialized randomly according to the limit of each generating unit. These initial particles must be feasible candidate solutions that must satisfy the operating constraints.Step3: Evaluation of objective function- In order to satisfy the equality constraint(3), a generator is arbitrarily selected as a dependent generator
  whose generation is calculated as given below:If the output of the dependent generator violates its lower limit, its output is set equal to its lower limit and if it violates its upper limit, its output is set equal to its upper limit. An output between the lower and upper limit is automatically acceptable.The operating cost of individual generating unit is calculated using(1) and hence the total operating cost can be calculated using(2).Step4: Initialization of best positions- In the PSO strategy, the particle’s best position,
  and global best position,
  are the key factors. The position with minimum objective function value is the particle’s best position. The best position out of all the
  is taken as
  .Step5: Movement of the particles- Particles in the swarm are accelerated to new positions by adding new velocities to their current positions. The new velocity is calculated using the equation:The positions of the particles are updated using(6).Step6: Updating the best positions- If the evaluation value of each particle is better than previous
  the current value is set to
 . If the best
  is better than
 , this new value is set as
 . An objective function value at
  is set as
 .Step7: Stopping criterion- If the number of iterations reaches the maximum than the process is stopped and
  is the minimum generation cost of the economic dispatch problem. Otherwise, the above process is repeated from step2.
5. Test Systems and Results
- In order to show the superiority of the TVAC_PSO strategy over other PSO strategies discussed before, two test systems have been taken into consideration. The first test system consists of three generating units[13] with a load demand of 850 MW. The second test system has been taken from[30] which consist of 13 generating units with a load demand of 1800 MW. In this paper following parameters have been used for different PSO strategies: For NPSO,
 = 1.6,
  = 0.4 and c2= 2[27] have been used. For APSO,
  = 1.6,
  = 0.4,
  = 1.8 and
  = 0.2[28] have been adopted. For TVAC_PSO, [26] suggests that the values for c1 should vary from 2.5 to 0.5 and from 0.5 to 2.5 in case of c2 for best results.Case1: Three-Generator systemFor this system a population size of 20 has been taken with maximum number of iterations as 200. Losses have also been calculated using the loss coefficients given in[13] by using equation(4). Power generation of each generator, generating cost and losses corresponding to different PSO strategies have been shown in table 1. Convergence characteristics of each PSO model are shown in figure 1.
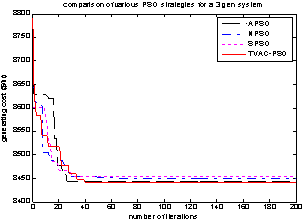 | Figure 1. Convergence characteristics of different PSO strategies(3-generator system) |
|
|
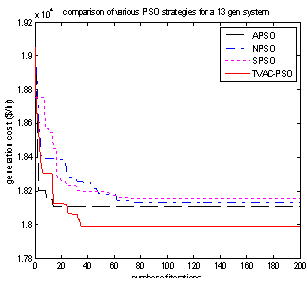 | Figure 2. Convergence characteristics of different PSO strategies(13-generator system) |
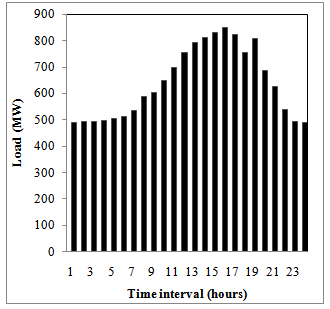 | Figure 3. Load profile during 24 time intervals(each of 1 hour) |
6. Conclusions
- In this paper, the TVAC_PSO strategy has been applied to EDVPL problems. A 24-hour short-term thermal generation scheduling has been presented to further add to the effectiveness of the proposed strategy. The performance of this strategy has been comparedwith SPSO, NPSO and APSO.Two standard test systems have been used for comparison. It has been found that by using the time varying acceleration coefficients better results are obtained in respect with the generation cost. The TVAC help in avoiding the premature convergence and thus providing a stable convergence. The TVAC_PSO strategy outperforms other PSO strategies, particularly for EDVPL problems, in terms of solution quality, stable convergence and stability.
References
| [1] | D. P. Kothari and J. S. Dhillon, “Power System Optimization”, 2nd edition, PHI, New Delhi, 2010 |
| [2] | D. P. Kothari and I. J. Nagrath, “Modern Power System Analysis”, 3rd edition, TMH, New Delhi, 2009 |
| [3] | D. P. Kothari and I. J. Nagrath, “Power System Engineering”, 2nd edition, TMH, New Delhi, 2010 |
| [4] | D. P. Kothari and K. P. Singh Parmar, “A novel approach for eco-friendly and economic power dispatch using MATLAB”, International Conference on Power Electronics, Drives and Energy Systems, PEDES ’06, pp. 1-6, 2006 |
| [5] | F. N. Lee and A. M. Breipohl, “Reserve constrained economic dispatch with prohibited operating zones”, IEEE Trans. on Power Systems, vol. 8, pp. 246-254, 1993 |
| [6] | K. Mohamed-Nor and A. H. A. Rashid, “Efficient economic dispatch algorithm for thermal unit commitment”, IEE Proceedings C, vol. 138, no. 3, pp. 213-217, 1991 |
| [7] | Chen Chung-Lung and Nanming Chen, “Direct search method for solving economic dispatch problemconsidering transmission capacity constraints”, IEEE Trans. on Power Systems, vol. PWRS-16, no. 4, pp. 764-769, 2001 |
| [8] | Y. S.Brar, J. S. Dhillon and D. P. Kothari, “Multi-objective load dispatch by fuzzy logic searching weightage pattern”, Electric Power Systems Research, vol. 63, no. 2, pp. 149-160, 2002 |
| [9] | C. A.Roa-Sepulveda, M. Herrera, B. Pavez-Lazo, U. G. Knight and A. H. Coonick, “Economic dispatch using fuzzy decision trees”, Electric Power Systems Research, vol. 66, no. 2, pp. 115-122, 2003 |
| [10] | K. Y. Lee, A. Sode-Yome and J. H. Park, “Adaptive Hopfield neural networks for economic load dispatch”, IEEE Trans. on Power Systems, vol. 13, no. 2, pp. 519-526, 1998 |
| [11] | R.Naresh, J. Dubey and J. Sharma, “Two-phase neural networks based modeling framework of constrained economic load dispatch”, IEE Proceedings – Generation, Transmission and Distribution, vol. 151, no. 3, pp. 373-378, 2004 |
| [12] | T.Yalcinoz and M. J. Short, “Neural networks approach for solving economic dispatch problem with transmission capacity constraints”, IEEE Trans. on Power Systems, vol. 13, pp. 307-313, 1998 |
| [13] | D. C. Walter and G. B. Sheble, “Genetic algorithm solution of economic dispatch with valve-point loading”, IEEE Trans. on Power Systems, vol. 8, no. 3, pp. 1325-1332, 1993 |
| [14] | K. P. Wong and Y. W. Wong, “Genetic and genetic/simulated – annealing approaches to economic dispatch”, Proceedings of Inst. Elect. Eng., pt. C, vol. 141, no. 5, pp. 507-513, 1994 |
| [15] | P. C. Chen and H. C. Chang, “Large scale economic dispatch by genetic algorithm”, IEEE Trans. on Power Systems, vol. 10, pp. 1919-1926, 1995 |
| [16] | G. B.Sheble and K. Brittig, “Redefined genetic algorithm – economic dispatch example”, IEEE Trans. on Power Systems, vol. 10, pp. 117-124, 1995 |
| [17] | C. L. Chiang, “Improved genetic algorithm for power economic dispatch of units with valve-point effects and multiple fuels”, IEEE Trans. on Power Systems, vol. 20, no. 4, pp. 1690-1699, 2005 |
| [18] | N.Amjady and H. Nasiri-Rad, “Economic dispatch using an efficient real-coded genetic algorithm”, IET Generation, Transmission and Distribution, vol. 3, no. 3, pp. 266-278, 2009 |
| [19] | D. B.Fogel, “Evolutionary computation: Towards a new philosophy of machine intelligence”, 2nd edition, Piscataway, NJ: IEEE Press, 2000 |
| [20] | R. C.Eberhart and Y. Shi, “Comparison between genetic algorithms and particle swarm optimization”, Proceedings of IEEE Int. Conf. on Evol. Comput., pp. 611-616, 1998 |
| [21] | J. Kennedy and R. Eberhart, “Particle swarm optimization”, Proceedings of IEEE Int. Conf. on Neural Networks, vol. 4, pp. 1942-1948, 1995 |
| [22] | Y. Shi and R. Eberhart, “A modified particle swarm optimizer”, Proceedings of IEEE Int. Conf. on Evol. Comput., pp. 69-73, 1998 |
| [23] | Y. Shi and R. Eberhart, “Empirical study of particle swarm optimization”, ProceedingsCongr.Evol. Comput., NJ, pp. 1945-1950, 1999 |
| [24] | Z. L.Gaing, “Particle swarm optimization to solve the economic dispatch considering the generator constraints”, IEEE Trans. on Power Systems, vol. 18, no. 3, pp. 1187-1195, 2003 |
| [25] | J. B. Park, K. S. Lee, J. R. Shin and K. Y. Lee, “A particleswarm optimization for economic dispatch with non-smooth cost functions”, IEEE Trans. on Power Systems, vol. 20, no. 1, pp. 34-42, 2005 |
| [26] | A.Ratnaweera, S. K. Halgamuge and H. C. Watson, “Self-organizing hierarchical particle swarm optimizer with timevarying acceleration coefficients”, IEEE Trans. on Evol.Comput., vol. 8, no. 3, pp. 240-255, 2004 |
| [27] | A. I.Selvakumar and K. Thanushkodi, “A new particle swarm optimization solution to nonconvex economic dispatch Problems”, IEEE Trans. on Power Systems, vol. 22, no. 1, pp. 42-51, 2007 |
| [28] | A. I.Selvakumar and K. Thanushkodi, “Anti-predatory particle swarm optimization: Solution to nonconvex economic dispatch problems”, Electric Power Systems Research, vol. 78, pp. 2-10, 2008 |
| [29] | Ma. Y, C. Jiang, Z. Hou and C. Wang, “The formulation of the optimal strategies for the electricity producers based on the particle swarm optimization algorithm”, IEEE Trans. on Power Systems, vol. 21, no. 4, pp. 1663-1671, 2006 |
| [30] | N.Sinha, R. Chakraborty and P. K. Chattopadhyay, “Evolutionary programming techniques for economic load dispatch”, IEEE Trans. on Evol.Comput., vol. 7, no. 1, pp. 83-93, 2003 |
| [31] | D. N. Jeyakumar, T. Jayabarathi and T. Raghunathan, “Particle swarm optimization for various types of economic dispatch prolems”, Electric Power Energy Syst., vol. 28, no. 1, pp. 36-42, 2006 |
| [32] | T. Arduloss, A. Victoire and A. E. Jeyakumar, “Reserve constrained dynamic dispatch of units with valve point effects”, IEEE Trans. On Power Systems, vol. 20, no. 3, pp. 1273-1282, 2005 |
| [33] | R. Roy, S. P. A. Ghoshal, “Novel crazy swarm optimized economic load dispatch for various types of cost functions”, Electric Power Energy Syst., vol. 30, no. 4, pp. 242-253, 2008 |
| [34] | C. C. Kuo, “A novel coding scheme for practical economic dispatch by modified particle swarm approach”, IEEE Trans. on Power Systems, vol. 23, no. 4, pp. 1825, 2008 |