-
Paper Information
- Next Paper
- Previous Paper
- Paper Submission
-
Journal Information
- About This Journal
- Editorial Board
- Current Issue
- Archive
- Author Guidelines
- Contact Us
Energy and Power
p-ISSN: 2163-159X e-ISSN: 2163-1603
2012; 2(4): 61-66
doi: 10.5923/j.ep.20120204.04
DG Placement and Sizing in Radial Distribution Network Using PSO&HBMO Algorithms
 Abstract
 Reference
 Full-Text PDF
 Full-Text HTML
M. Afzalan 1, M. A.Taghikhani 1, 2
1Department of Electrical and Computer Engineering, Saveh Branch, Islamic Azad University, Saveh, Iran
2Engineering Department, Imam Khomeini International University, Qazvin, Iran
Correspondence to: M. A.Taghikhani , Department of Electrical and Computer Engineering, Saveh Branch, Islamic Azad University, Saveh, Iran.
| Email: |  |
Copyright © 2012 Scientific & Academic Publishing. All Rights Reserved.
Optimal placement and sizing of DG in distribution network is an optimization problem with continuous and discrete variables. Many researchers have used evolutionary methods for finding the optimal DG placement and sizing. This paper proposes a hybrid algorithm PSO&HBMO for optimal placement and sizing of distributed generation (DG) in radial distribution system to minimize the total power loss and improve the voltage profile. The proposed method is tested on a standard 13 bus radial distribution system and simulation results carried out using MATLAB software. The simulation results indicate that PSO&HBMO method can obtain better results than the simple heuristic search method and PSO algorithm. The method has a potential to be a tool for identifying the best location and rating of a DG to be installed for improving voltage profile and line losses reduction in an electrical power system. Moreover, current reduction is obtained in distribution system.
Keywords: Distributed Generation, Distribution Networks, Particle Swarm Optimization (PSO), Sensitivity Analysis, Honey Bee Mating Optimization (HBMO), Voltage Profile
Article Outline
1. Introduction
- One of the most important motivation for the studies on integration of distributed resources to the grid is the exploitation of the renewable resources such as; hydro, wind, solar, geothermal, biomass and ocean energy, which are naturally scattered around the country and also smaller in size. Accordingly, these resources can only be tapped through integration to the distribution system by means of distributed generation. Distributed generation (DG), which generally consists of various types of renewable resources, can be defined as electric power generation within distribution networks or on the customer side of the system[1].DG affects the flow of power and voltage conditions on the system equipment. These impacts may manifest themselves either positively or negatively depending on the distribution system operating conditions and the DG characteristics. Positive impacts are generally called ‘system support benefits’, and include voltage support and improved power quality; loss reduction; transmission and distribution capacity release; improved utility system reliability. On account of achieving above benefits, the DG must be reliable of the proper size and at the proper locations[2],[3]. Distributed Generation is a small generator spotted throughout a power system network, providing the electricity locally to load customers. DG can be an alternative for industrial, commercial and residentialapplications. DG makes use of the latest modern tech nology which is efficient, reliable, and simple enough so that it can compete with traditional large generators in some areas[4],[5]. In fact, one type of DG is capable of supplying real power and reactive power.A stochastic dynamic multi-objective model for integration of DG in distribution networks is proposed in[6] with a binary PSO algorithm. A distribution system expansion planning strategy encompassing renewable DG systems with schedulable and intermittent power generation patterns is presented in[7] that a solution algorithm integrating TRIBE PSO and ordinal optimization (OO) is developed to obtain optimal and near-optimal solutions for system planners. A DG interconnection planning study framework is brought in[8] that includes a coordinated feeder reconfiguration and voltage control to calculate the maximum allowable DG capacity at a given node in the distribution network. In[9] a distributed micro-grid planning model has been presented to optimize the locating and the unit capacities within DG micro-grid, in which wind power and photovoltaic power are taken into consideration simultaneously with both Elitism Genetic Algorithm (EGA) and PSO. A multi-objective index-based approach for optimally determining the size and location of multi-distributed generation (multi-DG) units in distribution systems with different load models based on PSO is introduced in[10,11] and a combined genetic algorithm (GA)/(PSO) is presented in[12] for optimal location and sizing of DG on distribution systems. A population-based heuristic approach for optimal location and capacity of DGs in distribution networks, with the objectives of minimization of fuel cost, power loss reduction, and voltage profile improvement is proposed in[13] that the approach employs an improved group search optimizer (iGSO) by incorporating PSO into group search optimizer (GSO) for optimal setting of DGs. A new hybrid method which employs discrete PSO and optimal power flow is introduced in[14] which could apply to connect distributed generation systems in a distribution network choosing among a large number of potential combinations. Therefore, in this paper, PSO&HBMO method is proposed to determine the optimal location and sizes of multi-DGs to minimize the total power loss and improve the voltage profile of the distribution systems. The organization of this paper is as follows: The load flow is presented in Section 2. The problem formulation is in Section 3. Sensitivity analysis is shown in Section 4. The PSO algorithm is in Section 5. The HBMO algorithm is represented in Section 6. The proposed optimization method is given in Section 7. PSO&HBMO procedure for the optimal placement and sizing of distributed generation problem is given in Section 8. Simulation result on the test systems are illustrated in Section 9.
2. Load Flow
- On account of the some inherent features of distribution systems such as; radial structure, unbalanced distributed loads, large number of nodes, a wide range of R/X ratios; the conventional techniques developed for transmission systems generally fail on the determination of optimum size and location of distributed generations. The backward/forward sweep load flow algorithm is used in this paper. The voltage for all buses firstly is considered with zero phases then knowing power of bus we can find current of each bus. We use the obtained new voltages to calculate the current of buses so as the permitted repeat time is reached. After finding the line currents we use the first voltage bus to calculate the voltage of the buses.
3. Problem Formulation
- The problem is to determine allocation and size of the DGs which minimizes the distribution power losses and improve the voltage profile for a fixed number of DGs and specific total capacity of the DGs. Therefore, the following assumptions are employed in this formulation:
3.1. Objective Function
- Objective function is defined as cost over profit. Costs include charge of active and reactive power production and the advantage is obtained from reduction of losses and variance of voltage. kpg is the real power production price. kq is the reactive power price.
 is the active power loss in presence of distributed generator.
  is the active production power of distributed generator.
  is the reactive production power of distributed generator.
  is the reactive power loss in presence of distributed generator.
  is the active power loss before installation of distributed generator.
  is the reactive power before installation of distributed generator.
  is the voltage variation from ideal condition before installation of distributed generator. The price of DG power is considered to be 313 ryal/kw. Direct effect of reactive power on voltage profile kv factor can be held equal to kq. kps factor is the price of real power which is referred to 354ryal/kw.
  | (1) |
 | (2) |
3.2. Constraints
- The constraints are listed as follows:a) Distribution line absolute power limits:
 | (3) |
 | (4) |
 | (5) |
 | (6) |
4. Sensitivity Analysis
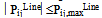
- In this analysis, the amounts of active and reactive power are separately increased and in each increase the magnitude of objective function will be calculated. The bus which has most variation to minimize the objective function is determined as the suitable place to install the first DG. This method is used in[15]. The amount of DG will be calculated in the next step using proposed optimization algorithm. Fig.1 shows that the best buses for DG installation are 2,11,4 respectively.
 | Figure 1. Sensitivity of objective function to the location of DG |
5. Particle Swarm Optimization
- PSO is a population-based, stochastic optimization algorithm based on the idea of a swarm moving over a given landscape. The algorithm adaptively updates the velocities and members positions of the swarm by learning from the good experiences. In PSO, the velocity vid and position xid of the dth dimension of the ith particle are updated as follows:
 | (7) |
 | (8) |
 | (9) |
6. HBMO Algorithm
- The honey bee is a social insect that can only survive as a member of a community, or colony. The colony inhabits an enclosed cavity. The honey bee community structurally consists of three different forms: the queen (reproductive female), the drone (male), and the worker (non reproductive female). These castes are associated with different functions in the colony; each caste possesses its own special instincts geared to the needs of the colony. The behaviour of honey-bees shows many features like cooperation and communication, so honey-bees have aroused great interests in modeling intelligent behaviour these years. Marriage in honey-bees optimization (MBO) is a kind of swarm-intelligence method. Such swarm intelligence has some successful applications. Ant colony is an example and the search algorithm is inspired by its behaviour. Mating behaviour of honey-bees is also considered as a typical swarm-based optimization approach. The behaviour of honey-bees is related to the product of their genetic potentiality, ecological and physiological environments, the social conditions of the colony, and various prior and ongoing interactions among these three[18, 19]. The HBMO algorithm combines number of different procedures. A drone mates with a queen probabilistically using an annealing function as follows[18, 20]:
 | (10) |
 | (11) |
 is the amount of speed and energy reduction after each transition and each step. Initially, the speed of the queen is generated at random. A number of mating flights are realized. At the start of a mating flight drones are generated randomly and the queen selects a drone using the probabilistic rule in Eq. (10). If the mating is successful (i.e. the drone passes the probabilistic decision rule), the drone’s sperm is stored in the queen’s spermatheca. By using the crossover of the drone’s and the queen’s genotypes, a new brood (trial solution) is generated, which can be improved later by employing workers to conduct local search. One of the major differences of the HBMO algorithm from the classic evolutionary algorithms is that since the queen stores a number of different drone’s sperm in her spermatheca, she can use parts of the genotype of different drones to create a new solution which gives the possibility to have fittest broods more. In real life, the role of the workers is restricted to brood care and for this reason the workers are not separate members of the population and they are used as local search procedures in order to improve the broods produced by the mating flight of the queen. Each of the workers has different capabilities and the choice of two different workers may produce different solutions. This is realized with the use of a number of single local search heuristics
  and combinations of them
  Thus, the sum of these two numbers
  gives the number of workers. Each of the broods is randomly chosen to be feed by worker, which is also randomly selected. If the new brood is better than the current queen, it takes the place of the queen. If the brood fails to replace the queen, then in the next mating flight of the queen this brood will be one of the drones. Honey Bee Mating Optimization (HBMO) algorithm can be described briefly in 5 steps as below:Step 1: This algorithm starts with flying in which the queen (the best answer) randomly selects its male pairs to consequently reproduce new bees. Step 2: the new born bees (possible answers) will be reproduced by displacing in queen and male genes.
  | (12) |
 | (13) |
7. Proposed Optimization Method
- In this article a new optimization method is presented based on the mixture of PSO and HBMO methods. Players and motion speed is calculated through PSO relations in this method and choosing or suitability is obtained from HBMO method. Suitability analysis is performed using prob. function in HBMO method. In (10) S(t) is equal to particle speed in PSO method and ∆(f) is showing difference from general optimized amount which can be calculated as below:
 | (14) |
8. PSO&HBMO Procedure
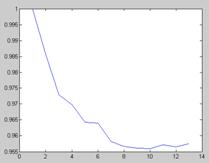
- We want to improve voltage profile and reduce power loss in this system by using 1, 2 and 3 DG. Before installation of DG, load flow will be applied. Fig.2 shows voltage profile before DG installation. Fig.3 shows the results of sensitivity analysis.
 | Figure 2. Voltage profile before installation of DG |
 | Figure 3. Sensitivity of objective function to the location of DG |
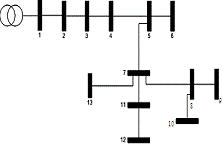 | Figure 4. The 13 bus radial distribution system |
9. Simulation Results
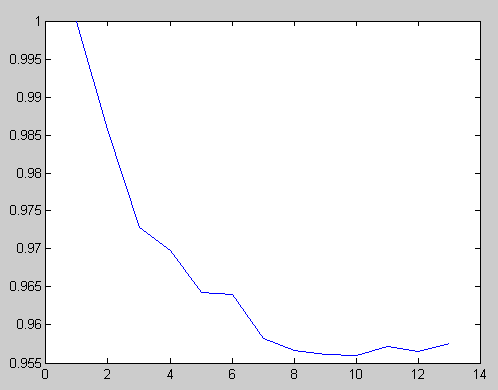
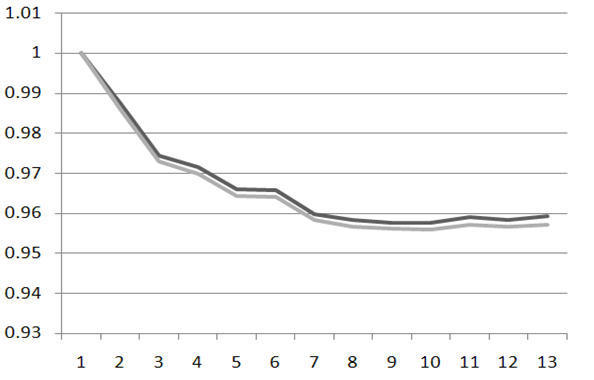
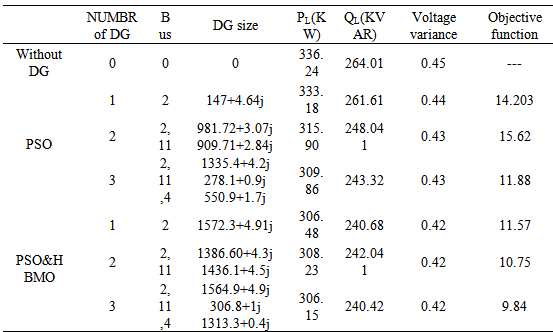
- The test system is radial distribution system with 13 buses as shown in Figure 4. The original total real power loss and reactive power and variance of voltage in the system are 336.24 kW, 264.01 kVar and 0.45 pu, respectively. The minimum and maximum voltages are set at 0.95 and 1.05 p.u. respectively. The load data is given in Table1 and branch data in is given Table2. Maximum number of DG is 3. The maximum real power and reactive power of DG are 1200kw and 5kvar, respectively. The improvement in the voltage profile after optimally placing the DGs is shown in Figures 5 and 6. Without DG, the bus 10 has 0.955p.u. and the bus voltage has improved to 0.9576p.u. after installing DG. According to buses voltage profile, in PSO&HBMO method voltage profile is better improved. Table3 shows the simulation results of PSO and PSO&HBMO methods for 13 bus systems. For the 13bus system, one DG can reduce the total power loss and variance of voltage and amount of objective function more than PSO algorithm. For two and three DGs, they can further reduce the total power loss and variance of voltage and amount of objective function more than PSO algorithm.
 | Figure 5. 3 DG installing (upper), Without DG (lower) |
 | Figure 6. Voltage profile of 2 DGs, PSO (dash line) and PSO&HBMO (solid line) |
|
|
|
10. Conclusions
- In this paper, a hybrid algorithm PSO&HBMO for optimal placement and sizing of multi-DGs proposed. This method efficiently minimize the total power loss and variance of voltage and amount of objective function and improve the voltage profile satisfying transmission line limits and constraints. The methodology is accurate in determining the sizes and DG locations.