-
Paper Information
- Next Paper
- Paper Submission
-
Journal Information
- About This Journal
- Editorial Board
- Current Issue
- Archive
- Author Guidelines
- Contact Us
Energy and Power
p-ISSN: 2163-159X e-ISSN: 2163-1603
2012; 2(3): 24-32
doi: 10.5923/j.ep.20120203.01
An Economic Assessment of the Reform of Nigerian Electricity Market
 Abstract
 Reference
 Full-Text PDF
 Full-Text HTML
Makwe J.N. 1, Akinwale Y.O. 2, Atoyebi M.K. 2
1Akintola Williams Deloitte, Energy Group, Lagos, Nigeria
2National Center for Technology Management, Obafemi Awolowo University, Ile-Ife, Nigeria
Correspondence to: Akinwale Y.O. , National Center for Technology Management, Obafemi Awolowo University, Ile-Ife, Nigeria.
| Email: |  |
Copyright © 2012 Scientific & Academic Publishing. All Rights Reserved.
There is no doubt that there is high level of inefficiency in the Nigerian Power sector. The power generation capacity available is far below the estimated growing demand for electricity. This paper therefore critically assessed the proposed reform of the electricity market in Nigeria. It highlighted some of the challenges such as severe electricity crisis due to the appalling state of power infrastructures, double digit transmission losses and low tariffs. An empirical investigation was conducted using a Linear Programming optimization model via General Algebraic Modelling System (GAMS) to analyse the pre and post electricity reform era. The paper concludes that the reform would be beneficial to the country. Albeit, the study identified that an upward review of prices and reduction in transmission losses are essential in incentivising investor but the success of the reform depends on government commitment and huge investment.
Keywords: Kywords Electricity, Power, Tariffs, Market, Transmission, Generation
Article Outline
1. Introduction
- Economic growth, development and national security of any nation are crucially dependent upon the adequate provision of electricity supply to the required industries. There seems to be a strong correlation between electricity and economic development. Until recently, government has total control over power utilities in most countries of the world. This was as a result of the provision of maximum social welfare with lowest cost to the populace. However, these utilities become huge deficits that cannot be sustained by the government treasury. Hence, there is a paradigm shift from a natural monopoly system of power sector to a relative competitive one. According to World Energy Outlook[1], an estimated average of 1.5 billion people which is an equivalent of 22% of the world’s total population still suffers from adequate electricity and majority of these people are in Sub-Saharan Africa and rural South Asia. The most important factor for the reform is finance[2]. The electricity industries in most African countries are in poor state which need huge amount of human and financial resources to revamp the industry. Estache et. al[3] noted that 60% of Sub-Saharan African countries engaged in some form of reform in late 1990s. They suggested that the industry seems to have improved in technologies and commercial practices since the reforms. This suggests that reforms have played some positive impact on their power sector. Some countries like Senegal and Mauritania faced some challenges in the transition process during reform. Woo et al[4] identified market power, rising marginal cost and financial insolvency as some of the consequence of such flaws. However, despite these experiences, more countries are adopting electricity reforms as a panacea for increased investment and efficiency in the industry.The plan of Nigeria government is to commercialise and privatise the public sectors since the period of Structural Adjustment Program (SAP) in 1986. This arises as a result of inabilities of government to meet its liabilities that triggered from these sectors. A good example is the Nigeria Telecommunication industry which was initially operating under the monopolised market of NITEL which was recently privatised. The industry is now competitive and reaping the benefit of a liberalised market by charging the customers a lower cost. The power utility - initially called National Electric Power Authority (NEPA) but now Power Holding Company of Nigeria (PHCN) - is a natural monopoly, which is state- owned. The industry is vertically integrated such that generation, transmission and distribution segments were managed by NEPA. Over the years, the monopoly has been fraught with poor service delivery, operational losses, distribution losses, poor management and maintenance, under-investment and obsolete facilities. With the passed Reform Act, the industry would be unbundled and privatized to attract the needed resources to boost the sector. This would allow for competition in the generating segment whiles both transmission and distribution segments remain as private monopolies. The reform is expected to generate some economic implications for the citizens and the prospective investors. This study would therefore review the reforms so as to determine its impact and transmission network on private investor’s incentives with emphasis on price and distribution losses. This paper is divided into five parts. Section 2 focuses on the theoretical frameworks of the market structure. Section 3 discusses electricity industry and reforms in Nigeria. Section 4 presents the methodology and analyse the results while the last section concludes the paper.
2. Theoretical Frameworks of the Market Structure
- This section discusses the economic theories of a natural monopoly and a competitive market. This would proffer a better understanding on how firms interact in a market structures. Electricity market was known to be a vertically integrated monopoly market with its various segments- generations, transmission, distribution, and retail supply- managed by a single firm. Fig. 1 below shows a typical structure of the electricity market from generation to distribution.
 | Figure 1. A typical structure of the electricity market |
2.1. Natural Monopoly
- This market structure usually arise when there is a huge capital investment/ sunk cost associated with the provision of such goods/services and which the service cost becomes low when it is only produced by a single firm rather than two or more firms. Newberry[6] noted that this is a situation where a single firm can satisfy the entire market demand for the range of goods and services at lower cost. It can be deduced that electricity market in most African countries is a natural monopoly because it is usually state owned enterprise. Sioshansi[7] identified economics of scale and scope, vertical integration among other benefits as the main reason for natural monopoly. The cost structure of a natural monopoly has been assumed to have declining long-run average cost and a constant marginal cost. As a monopolist, the firm could set prices above marginal cost by exercising its market power, if left unregulated. This could be shown in fig 2 below
 | Figure 2. Graphical Representation of Natural Monopoly |
2.2. Privatisation
- Privatisation arises when government transfer its ownership rights in the public sector to the private organisations. This act is intended to curb the excessive political interference of the government[10]. Bos[11] and some other literatures showed that privatisation leads to improved efficiency, better performance through the interplay of market forces, reduction of National debts among others. Fig. 3 below shows the graphical comparisons between competitive and monopoly market.
 | Figure 3. A Standard Analysis of the comparison between Monopoly and Competitive Markets |
3. Electricity Industry and Reforms in Nigeria
- The first generating plant in the electricity market in Nigeria was installed in 1896. Despite the fact that many bodies had been established by various legislative councils since 1950, the level of development in the power sector had been at a slow rate[12]. In 1950, Electricity Corporation of Nigeria (ECN) was established to be responsible for electricity supply and development in Nigeria. In 1962, Niger Dams Authority (NDA) was established by an act of parliament. This authority was responsible for the construction and maintenance of dams and other works on the River Niger and other hydro generating plants. Okoro and Chikuni[13] noted that the electricity produced by the NDA was sold to ECN for distribution and sales at utility voltages. In 1972, Nigerian Electric Power Authority (NEPA) was established by the Government-sponsored merger of the ECN and NDA. NEPA has since operated as a government-controlled monopoly responsible for power generation, transmission, and generation. Sambo[12] argued that prior to 1999; the power sector did not witness substantial investment in infrastructural development. He stated that new plants were not constructed and the existing ones were not properly maintained, bringing the power sector to a deplorable state.Following the introduction of the Electric Power Sector Reform Act in 2005, NEPA was transformed into a Power Holding Company of Nigeria (PHCN) which was subsequently unbundled into 18 companies, including 6 generators, 11 distributors and one transmission company. These companies are responsible to carry out the functions relating to the generation, transmission, trading, distribution and bulk supply as well as resale of electricity[14]. The reform has been able to introduce new set of players such as the Independent Power Producers (IPPs), Nigeria Electricity Liability Management Company (NELMCO). The power sector is now regulated by the National Electricity Regulatory Commission (NERC) under the Federal Ministry of Power. NERC has issued about 29 power generation licenses to independent power producers since 2006.According to Makwe[15], a wholesale competitive market, like the UK reform, is intended for the generating segment while the distribution companies would be privatized regional monopolies. The Generating Companies (GENCOs) would run concurrently with licensed IPPs. The transmission company (TRANSCO) would remain a state-owned monopoly. TRANSCO shall also play the role of a system operator and would be responsible for transmitting and despatching function. NERC, the regulatory body, was also established. It would, among other functions, ensure fair play and transparency in the wholesale market. It would oversee the activities of TRANSCO and Distribution Companies (DISCOs) to ensure adequate third party access. A Rural Electrification Fund (REF) was also established to enhance electricity affordability by low income consumer. A Bulk trader, Nigeria Bulk Electricity Trading Plc (NBETP), was established and it would be responsible for buying power from the generating companies and the IPP (via PPA) and resell it to the distributors (via a vesting contract) as shown in fig. 4 below.
 | Figure 4. A Graphical Representation of the Proposed Nigerian Reform |
3.1. Challenges Facing Electricity Market in Nigeria
- The challenges facing the power industry in Nigeria ranges from generation to distribution of electricity. In the 1950s, the demand for electricity was below its supply. The industry was able to meet the country’s need at that period. The demand for electricity gradually increased and later outstripped supply as industrialisation come in. The estimated total installed capacity of the combined hydro and thermal power stations is 7,941.1 MW as at December 2008. Meanwhile the power generation capacity available is 4,428 MW of which 3,273MW is from PHCN while 1,155MW is from IPPs. Currently, it is estimated that the demand for electricity is approximately 10,000MW and it is expected to grow in the future. There are three hydro and seven thermal generating stations.Ibitoye and Adenikinju[17] stated that ageing of power plants, poor maintenance and dearth of funds are some of the factors that could be responsible for the sub-optimal operation in the power sector. According to Presidential Task Force on Power Project (PTFP)[16], the sector needs, on a yearly basis, N520 billion (US$3.5billion) to increase generating capacity from approximately 4000MW to 13000MW by 2013. Also, the transmission network is overloaded with a wheeling capacity less than 4,000 MW. There are significant line voltage and power losses, as high as 25% compared with 3% in the US and 0.5% in Japan, in the transmission systems due to the large average distances between 300 and 500km over which electrical energy is distributed. Low transmission grid voltages, typically 330kV and 132kV compared with 765kV in developed countries also cause significant transmission and distribution losses. To worsen the demand shortage, Nigeria experiences a double digit transmission and distribution losses, which are quite large by international standards[18]. The losses could be attributed to the poor and obsolete state of the transmission network. Therefore, a robust transmission network would be vital in connecting to the north. Hence, Borenstein et. al[19] stated that an efficient transmission capacity would reduce market power, increase competition and thereby reduce regulatory interventions.Energy mix is another challenge facing the power sector in Nigeria. The electricity sector has been powered by hydro and thermal plants. These have not been sufficient to meet the electricity need of the country. Nigerian is said to be blessed with abundant solar and wind energy, which are yet to be fully tapped in generating electricity[15]. According to Foster et al[20], Nigerian tariff is one of the lowest in Africa as could be observed in fig. 4. He stated that the reform act passed in 2005 brought about a review of the tariff from $0.04/kwh to $0.06/kwh in 2009. They also noted that it would be increased to $0.07/kwh in 2011.
 | Figure 5. Electricity tariff across some African countries |
4. Research Methodology and Results Analysis
- A LP optimization model is used in this study to analyse the Nigerian Electricity market, pre and post reform. The adopted model is simple and tried to replicate the characteristics of the Nigerian Electricity Industry as a single system/network. The principal use of optimization models in the electricity industry is for scheduling of production at generating plants. The model, solved via General Algebraic Modelling System (GAMS), estimates the profitability of the system which could incentivize private investors under two scenarios. The programme selects the least-cost options among the given plants’ capacities with their transmission costs (between the plant and demand points) and the transmission loss. The model examines the market performance of the industry under two scenarios, which are base and expanded scenarios. The base scenario assumes the pre-reform state of industry as a single organisation, while the expanded scenario tends to capture the post-reform. With the reform, it assumes that additional capacities have been installed in the generating segment. Also sensitivity analysis was run on electricity price and transmission losses parameters and evaluated the impact on the system. The model is a simplified transportation problem, where the generating plants represents the supply nodes (Sn) and the distribution companies (points) are the demand nodes (Dn). The model is design to include the transmission network between nodes. Hence, the model is similar to a typical network in fig. 6 below.
 | Figure 6. A Typical Networking |
|
4.1. Mathematical Model and Assumptions
- Objective function: chooses plant capacities and outputs as well as transmission costs that best maximises investors’ incentives:
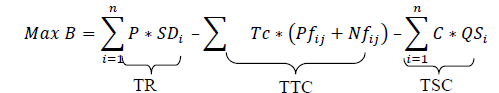 Where, TR= Total revenue, TTC = Total Transmission Cost, TSC = Total Supply Cost Net flow balance:
  This means that the total electricity supplied to a given node must equal to its demand. The distribution losses parameter (α) in the constraint means that plants must produce sufficient electricity to meet the fixed demand and distribution losses.Where, Xij = Pfij – Nfij: it means that the net flow of electricity in and out of a node must satisfy the demand requirement of that node.· Non-negativity of Net flow:Pfij, Nfij 0: it means that all flows in or out of a node must be non-negative· Net flow bounds:Pflo or Nflo = 0: the lower bounds of all flow in or out must equal zeroNfup = -∞; Pfup = +∞: the upper bounds of all flow in or out are infiniteDemand bounds (D):Dup = δ*Ď: upper demand bound is a function of peak load requirement on maximum demand. Hence, the upper bound can never exceed the maximum demand.Dlo = β* δ*Ď: lower demand bound is a function of base load requirement on upper bound· Supply bounds(Q):Qup = Q: upper supply bound is a function of maximum supply capacity at each plant. As such, the output from each plant can never be more than its available capacity.Qlo = 0: lower supply bound is equal to zero; hence, it can never be negative.The maximum demand requirement and the maximum supply capacity were assumed fixed. The units are in Kilowatt hour, as can be seen in table 1 to 3 below. The plant capacities were in MW as obtained from[16] but were converted to KWh by assuming that the plants run hourly. Transmission cost ($) between nodes was estimated in proportion to the distance between the nodes.
|
4.2. Analysis of Results
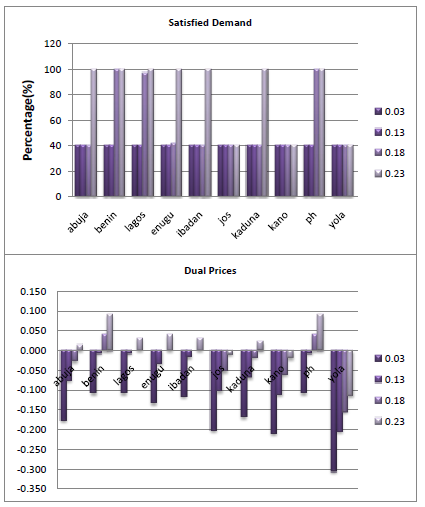
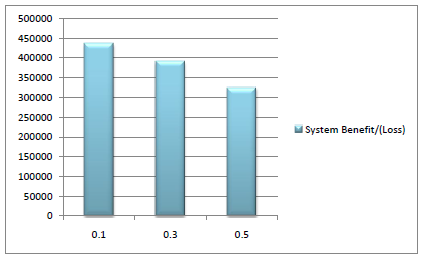
- This section discusses the result obtained from the Linear Programming Optimisation model via General Algebraic Modelling System (GAMS) on pre and post reform of the electricity market. Sensitivity was also run on electricity prices to evaluate the impact on the system and demand satisfied. Fig.7 below shows that price of electricity would influence the performance of the industry base on the based model using table 1.
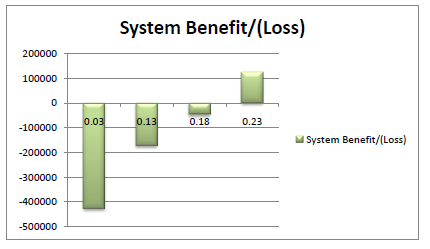 | Figure 7. Impact of Different prices on the Based system |
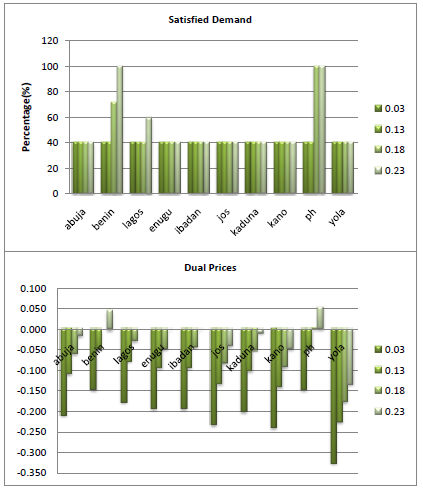 | Figure 8. Impact of Different Prices on Satisfied Demand (%) and Dual prices |
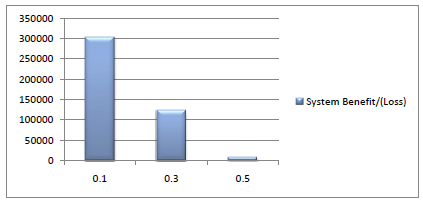 | Figure 9. Impact of Different Distribution losses (%) on the System |
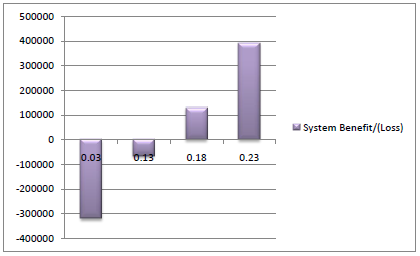 | Figure 10. Impact of Difference prices on Expanded System |
 | Figure 11. Impact of Different Prices on Satisfied Demand (%) and Dual Prices on Expanded System |
 | Figure 12. Impact of Different Distribution losses (%) on the System |
5. Conclusions
- The Nigerian power sector is in a poor state both financially and administratively. The infrastructures are sub- standard, power plants are under operating, transmission losses are high, electricity tariffs are low and black outs are common in the country. The investment need of the sector is so great that government alone cannot bear the burden alone. This had necessitated the sector reform. The reform would allow the unbundling of the industry: a competitive generating segment and monopolized transmission and distribution segments. The reform has also initiated an upward review of tariffs. If the reform is properly designed and implemented, it would promote the flow of both domestic and foreign investment and manpower resources into the sector. From experiences from other countries, this would improve electricity supply to meet the growing demand in Nigeria. Subsequently, it would drive the economic development goals of the country.Using the LP model with the sensitivity analysis, this study analysed the impact of the reform and transmission network on private investors’ incentive. It focused on impacts of electricity price and distribution losses on the industry, both pre-reform and post-reform.The model result revealed that an upward review of electricity price would improve the sector both before and after the reform. This is because more plants would operate when prices are high. Hence, more demand would be met. However, prices could be lower in post-reform than in pre-reform because of the competitive wholesale market. The model also revealed that adequate investment in the transmission network would be beneficial in both pre-reform and post- reform. This recommends to the government that upward review of prices would make the market more viable for investment especially in the generating segment. Also, it reveals to government that transmission network would play a major role in incentivising firms to invest in the generating segment and ensuring that demand points in the country are met. It also reveals to the government that there is spatial distribution of prices. Hence, a standard price for all plants might not be appropriate. The reform could therefore be a panacea to revamping the ailing industry.
Notes
- 1. Developed countries like UK, and Norway; emerging countries like India, China among others2. Banks[9] argued that approximately 120 developing countries have implemented the privatisation program which have generated approximately $410 billion between 1990 and 2003.
References
| [1] | World Energy Outlook (2009) |
| [2] | Williams, J. H. and Ghanadan, R. (2006) ―Electricity Reform in Developing and Transition Countries: A Reappraisal‖; Energy Policy, Volume 31 |
| [3] | Estache, A., Tovar, B. and Trujillo, L. (2008) ―How efficient are African electricity companies? Evidence from the Southern African countries; Energy Policy, Volume 36, Issue 6, Pages 1969-1979 |
| [4] | Woo, C., Lloyd, D. and Tishler, A (2003) ―Electricity Market Reform Failures: UK, Norway, Alberta and California‖; Energy Policy, Volume 31, Issue 11, Pages 1103-1115 |
| [5] | Joskow P. L. (2006) ―Incentive Regulation in Theory and Practice: Electricity Distribution and Transmission Networks; Energy and Environmental Policy available online http://ideas.repec.org/p/cam/camdae/0607.html Accessed: 24/12/11 |
| [6] | Newbery, D. (2000) ―Privatization, Restructuring and Regulation of Network Utilities London: MIT Press |
| [7] | Sioshansi, F. P. (2006) ―Electricity Market Reform: What has the Experience taught us thus far?; Utilities Policy, Volume 14, Issue 2, Pages 63-75 |
| [8] | Carlton, D. and Perloff, J. (2005) ―Modern Industrial Organisation 4th Edition, Boston, London: Pearson Addison Wesley |
| [9] | Banks, J.P. (2006) ―Privatization of the Electricity Sector in Emerging Markets: The Organizational Challenge for Governments; Electricity Journal, Vol. 19, Issue 9, Pages 45-54 |
| [10] | .Laffont, J. (2005) ―Regulation and Development United Kingdom: Cambridge University Press. |
| [11] | Bos, D. (1991) ―Privatization: A Theoretical Treatment‖ New York: Oxford University Press |
| [12] | .Sambo, A.S. (2008) ― Matching Electricity Supply with Demand in Nigeria. IAEE, fourth quarter, pages 32-36. |
| [13] | .Okoro, O. and Chikuni, E. (2007) ―Power Sector Reforms in Nigeria: Opportunities and Challenges; Energy Journal, Volume 18, Number 3, Pages 52-57 |
| [14] | National Technical Working Group, 2009. Report of the Vision 2020 on energy Sector. Pages 63-70 |
| [15] | Makwe, J. (2011) ― The Nigerian electricity Market. University of Aberdeen Business School. |
| [16] | Presidential Task Force on Power (2011)http://www.nigeriaelectricityprivatisation.com Accessed 8/12/11 |
| [17] | Ibitoye, F. I. and Adenikinju, A. (2007) ―Future demand for electricity in Nigeria; Applied Energy, Volume 84, Issue 5, Pages 492-504 |
| [18] | Iwayemi, A. (2008) ―Nigeria‘s Dual Energy Problems: Policy Issues and Challenges; IAEE Energy Forum, 4th Quarter, 2008 |
| [19] | Borenstein, S., Bushnell, J. and Stoft, S. (2000) ―The Competitive Effects of Transmission Capacity in a Deregulated Electricity Industry; Journal of Economics, Vol. 31, No. 2, Pages 294-325 Accessed: 18/12/2011 08:20 |
| [20] | Foster, V. and Pushak, N. (2011) ―Nigeria‘s Infrastructure: A Continental Perspective; Policy Research Working Paper, World Bank |
| [21] | Taha, H. A. (1997) ―Operations Research: An Introduction; New Jersey: Prentice Hall |
| [22] | Jamasb, T. and Pollitt, M. (2007) ―Incentive Regulation of Electricity Distribution Networks: Lessons of experience from Britain; Energy Policy, Volume 35, Issue 12, Pages 6163-6187 |
| [23] | Sonibare, J. A. (2010) ―Air pollution implications of Nigeria‘s present strategy on improved electricity generation; Energy Policy, Volume 38, Issue 10, Pages 5783-5789 |