Hyuntae Shin 1, Daehee Kim 2, Hyungjun Ahn 2, Sangmin Choi 2, Gichul Myoung 3
1Power Plant Engineering Dep., Samsung Engineering Co., Ltd.,Seoul, 135-708, South Korea
2School of Mechanical Aerospace & Systems Engineering, Korea Advanced Institute of Science and Technology, Daejeon, 305-701, South Korea
3R & D Center, SeenTec Co., Ltd., Changwon, 641-969, South Korea
Correspondence to: Sangmin Choi , School of Mechanical Aerospace & Systems Engineering, Korea Advanced Institute of Science and Technology, Daejeon, 305-701, South Korea.
| Email: |  |
Copyright © 2012 Scientific & Academic Publishing. All Rights Reserved.
Abstract
Numerical simulation and experimental study were conducted in order to analyze flow patterns and finally to find out appropriate alternatives for uniform flow in the transition zone of the vertical type Heat Recovery Steam Generator (HRSG) for a gas turbine combined cycle. To understand flow patterns in the interconnecting duct between the gas turbine exhaust and the inlet of the HRSG, flow measurement was conducted in a 1/20 scale-down model. Velocities were measured by pitot tubes on selected sections and uniformity of the flow was quantitatively evaluated. Water table test was also carried out to visualize the flow and to compare the flow patterns according to the selection of alternative shape design of the transition zone, which would lead to better uniformity of the flow in the duct. Numerical simulation by a commercial Computational Fluid Dynamics (CFD) code was performed to augment the model tests and to consider various ideas for better uniformity. Finally, selected alternatives for the uniform flow chosen from the numerical study were checked against in experiments.
Keywords:
Heat Recovery Steam Generator, Transition Zone, Uniformity, Computational Fluid Dynamics
Cite this paper:
Hyuntae Shin , Daehee Kim , Hyungjun Ahn , Sangmin Choi , Gichul Myoung , "Investigation of the Flow Pattern in a Complex Inlet Duct of a Heat Recovery Steam Generator", Energy and Power, Vol. 2 No. 1, 2012, pp. 1-8. doi: 10.5923/j.ep.20120201.01.
1. Introduction
As a part of efforts to enhance power generating efficiency and to meet environmental regulations, application of Combined Cycle Power Plant (CCPP) has been rapidly growing in recent years. A CCPP consists of a fuel-fired gas turbine and a Heat Recovery Steam Generator (HRSG) with a steam turbine. The basic idea for additional power is to produce the high-pressure and high-temperature steam by absorbing the remaining heat of the exhausted gas from the gas turbine. Figure 1 shows the schematic diagram of the CCPP.An important design consideration for heat recovery steam generator of a CCPP is the flow distribution of the exhaust gas throughout the heat exchanger tubes. It is well known that the tubes are more susceptible to corrosion and rupture when the flow distribution is strongly non-uniform[1]. Also, a bias in the distribution of velocity would lead to the temperature and stress imbalance on tubes and it can be a cause of damage on tubes[2].There are two main parameters in determining the flow characteristics in HRSG. The first is geometry of the inletduct. The inlet side of HRSG is connected to the exit side of gas turbine by an interconnecting duct, which is called a transition zone as shown in Figure 1, which guides the flow to the tube zone. The transition zone has an expansion region to reduce the flow speed and to obtain wide enough area for heat exchange. Second parameter is the swirl flow from the gas turbine, which has different swirl angle according to the gas turbine load. Gas turbine load is a key factor affecting the swirl flow. In many CCPP, the Daily Start and Stop (DDS) operation is common because their response characteristics are superior to those of other conventional power plants, such as fossil-fuel and nuclear power plants. Frequent load changes would influence flow characteristics and this makes some problems on tubes as mentioned above. Table 1 shows a typical case of load change of a CCPP during operation in a day[3]. Therefore, flow patterns have to be analyzed and transition zone should be carefully designed for better uniformity. In addition, installation of additional equipments such as flow correction devices (FCD) can be another option for uniform flow[4, 6].Several researches have been conducted in this area. For instance, Hegde et al.[1] studied to obtain simple modifications of their internal configuration which makes the flow of combustion gas more spatially uniform. With the increase of uniformity in flow, efficiency of heat transfer in the heat exchanger increased. Lee et al.[4] investigated the effect of swirl flow of the gas turbine exhaust gas in the inlet duct of a horizontal HRSG. They found that the flow correction devices made the flow entering the duct burner more uniform and the flow uniformity was not affected by the intensity of swirl when the flow correction device was in place. Yoo et al.[5] considered the change of inlet duct shape for the improved uniform flow and showed its possibility. Chong and Song[6] concluded that the non-uniform flow on heat exchange tube leads to lower system efficiency.Objective of this work is to understand special operating circumstance for a selected existing plant and to present alternatives to solve problems in a limited way. To do this, numerical simulation and experimental study were carried out in order to investigate the flow characteristics in the transition zone of a vertical type HRSG. Moreover, several ideas for better uniformity of flow were evaluated by quantifiable performance parameters and performance of selected alternatives was checked with scale-down model tests.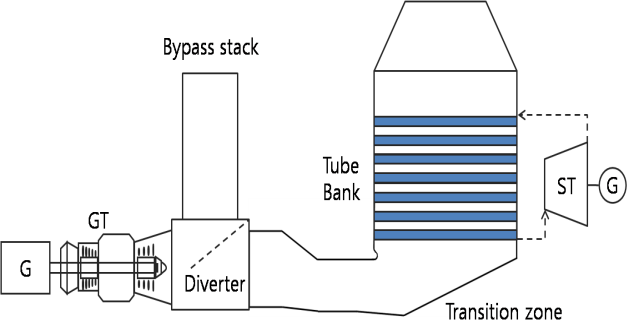 | Figure 1. A schematic to show the exhaust flow; exhaust gas from the gas turbine is introduced into the tube bank of heat recovery steam generator through a complex inlet duct (also, called a transition zone) |
| Table 1. Load percentage of a CCPP during daily operation[3] |
| | Load (%)-Full load 150MW- | Percentage of operation time (%) | | Under 70 | 2 | | 70~80 | 14 | | 80~90 | 27 | | 90~100 | 28 | | Over 100 | 29 |
|
|
2. Approach
It is extremely difficult to measure the flow characteristics in real scale plants, and thus model tests are often preferred instead. Model tests show advantages of being able to easily change specific parameters which affect the system. Hence, cold flow wind tunnel tests were performed to understand the flow patterns in HRSG and to quantitatively evaluate the non-uniformity. To see the flow patterns visually and to verify the effect of inlet duct shape on the flow patterns, 2-dimensional water table model tests were performed. Computational Fluid Dynamics (CFD) analysis was also performed to supplement the experimental investigation.
2.1. Cold Flow Wind Tunnel Tests
1/20 scale model of the 150MWe combined cycle power plant encompasses the G/T exit side, the transition zone, and the exit of the vertical type HRSG, but the bypass stack is excluded. The entrance of the model is connected to the fan.Considering the operating conditions of the fan, the maximum air flow is roughly set to 80 cubic meters per minute. Table 2 shows the Reynolds number according to the flow rate. Assuming that the Reynolds number at the gas turbine exit of the prototype is 3×10⁶, the Reynolds number of the model was estimated at 4.5~6.1×10⁵ at the entrance and 1.2~1.6×10⁵ at the surface of the tube zone area. Although it is usually impossible to get Reynolds similarity exactly between the prototype and the model, it is well known that the turbulent flow pattern does not change any more by increasing the Reynolds number larger than 1×10⁴[7]. In this experimental condition of maximum flow, the Reynolds number is in the range of 1.2~6.1×10⁵ and this means that Reynolds similarity is relatively well kept in this experiment.| Table 2. Reynolds number according to flow rate |
| | Q (m3/min) | 60 | 70 | 80 | | A1 | V (m/s) | 37.6 | 43.9 | 50.1 | | Re | 458,000 | 534,000 | 610,000 | | A2 | V (m/s) | 13.3 | 15.5 | 17.8 | | Re | 241,000 | 282,000 | 322,000 | | A3 | V (m/s) | 2.6 | 3.0 | 3.5 | | Re | 122,000 | 143,000 | 163,000 |
|
|
In addition, considering the swirl behavior in the real gas flow through the HRSG, a swirler is attached at the entrance of the model. A swirler has axial fixed blades with angle, 15°[8, 9]. In order to imitate the tube banks of the HRSG, a small tube bank and perforated plates were installed to produce similar pressure coefficient with that of the prototype, as shown in Figure 2[10]. Velocity measurementswere conducted at the three sections, which are the flow path A1, the entrance of the transition zone A2, and the entrance of the tube zone A3. Considering the size of each section, the number of measurement points was decided to 16 at A1, 20 at A2, and 35 at A3 as shown in Figure 3. Pitot tubes were used for the velocity measurement.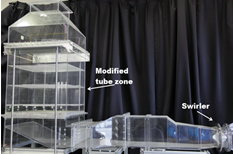 | Figure 2. Cold flow model of 1/20 scale |
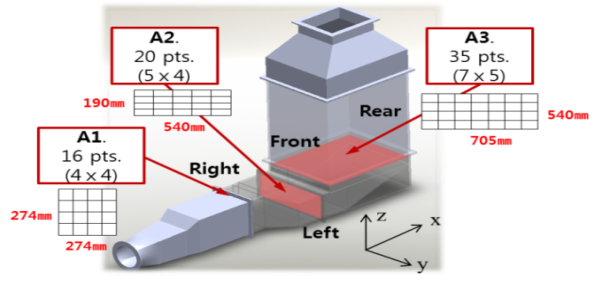 | Figure 3. Flow velocity measurement points |
2.2. Water Table Tests
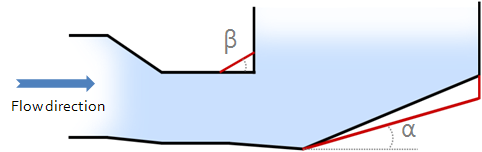
To visualize the flow in the transition zone and thus to check the flow pattern predicted by the result of the 3-dimensional wind tunnel tests, 2-dimensional cold water table test was conducted in a 1/20 scale down model. Table 3 represents the comparison of the operation condition between the prototype and the model. In this test, flow of the exhaust gas is simplified to be uniform. As the tracer for the flow visualization, neutrally buoyant silicon balls which have diameter smaller than 1mm were used. By adjusting the exposure time, trace of the balls were photographed which spread with the water flow. Obviously, there should be certain limitations to employ 2-dimensional model for the fully turbulent 3-dimensional flow in the ducts, but it could be used to observe the qualitative flow pattern and furthermore to generate the basic ideas of design alternatives. Also, 2-dimesional model tests have the advantage of being simple to build and easy to change the test conditions[11]. Another purpose of this set of tests was to perceive how the shape of inlet duct would affect flow behavior. Therefore, 4 cases which have different corner angle, α and bottom angle, β were handled, as summarized in Table 4. Figure 4 shows the schematic of the transition zone which was expressed by the corner angle, α and bottom angle, β.| Table 3. Comparison of conditions between prototype and model |
| | | Prototype | Model | | Main flow media | air | water | | Mean temperature (oC) | 600 | 20 | | Viscosity (m2/s) | 95.15x10⁻⁶ | 1.00x10⁻⁶ | | Length scale (m) | 5.48 | 0.27 | | Velocity scale (m/s) | 37 | 0.13 |
|
|
| Table 4. Selected cases for 2-dimensional water table test |
| | Case No. | α | β | Note | | 1 | 20o | 90o | reference | | 2 | 20o | 30o | roof change | | 3 | 14o | 90o | bottom change | | 4 | 14o | 30o | Roof/ bottom change |
|
|
 | Figure 4. Alterative design modification for the transition zone (see Table 4) |
2.3. CFD Simulation
Computational fluid dynamics (CFD) simulation was carried out to examine the flow patterns in the transition zone. Full scale 150MWe plant at the 100% full load operating condition was considered for the simulation. To model the inflow into the transition zone more exactly, the computational domain was extended from the tail end of the gas turbine to the exit of the HRSG unit. The stack of HRSG and bypass stack were excluded from the domain because they were not expected to have effect on the flow. Commercial CFD software package, Fluent v6.3 was used for the numerical simulation with the RNG k-ε model adopted for turbulence[12]. The total volume divided into about 3 million elements and the grid pattern was selected in such a manner that the grid spacing near the entrance of the tube zone was sufficiently fine. To simulate the tube zone, porous media was adopted. The pressure drop was calculated as source term added in the momentum equation[13]. Number of Transfer Unit (NTU) model was used to calculate the heat transfer in the tube zone and the fan swirl velocity modelling was employed to express the swirl flow from the gas turbine[5]. Inlet conditions of the exhaust gas were summarized in Table 5 and input values to express the pressure and temperature drop at the tube zone were decided based on data of the pressure and temperature in the Ulsan combined cycle power plant unit 2 as shown in Table 6[3].| Table 5. Inlet conditions of exhaust gas |
| | | Value | | Flow rate (Nm3/s) | 345 | | Temperature at the turbine exit (oC) | 605 | | Exhaust gas composition(% weight, ambient temp.15 oC) | O2 | 14.5 | | CO2 | 5.7 | | H2O | 73.5 | | N2 | 1.3 | | Ar | |
|
|
| Table 6. Pressure and temperature change at each level in the tube zone[3] |
| | Level of tube bank | Δ Pressure (Pa) | Δ Temperature (K) | | 1 | 290 | 81.5 | | 2 | 550 | 183 | | 3 | 410 | 59 | | 4 | 200 | 28 | | 5 | 320 | 52 | | 6 | 430 | 52 | | 7 | 400 | 49 |
|
|
3. Result
3.1. Cold Flow Wind Tunnel Tests
From the cold flow wind tunnel tests, the velocity distribution contours at the measured points were presented and the flow uniformity was evaluated by quantifiable performance parameters. Root mean square (RMS) deviation is used to evaluate the uniformity of the flow[5]. According to the definition of the standard deviation as Eq. (1), low RMS deviation means better uniformity. The equations used for the calculation of pressure drop are as below.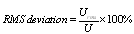 | (1) |
Figure 5 represents the velocity distribution contours at the duct cross-sections of A1, A2 and A3 (see Figure 3). As a result of the swirler installed at the entrance of the cold flow model, the flow at A1 section rotates and it is biased toward the outside of the cross section as shown in Figure 5-(a). Mean velocity is 11.7 m/s and the RMS deviation is 19.6% on this section. At A2 section, the flow expands and its velocity decreases before entering the HRSG boiler. As shown in Figure 5-(b), the velocity is faster at upper side of A2 section. This phenomenon is due to the effect of the inlet duct shape. Also, the velocity is still faster at the left side of A2 section, which could be interpreted as swirl effect on the flow. The mean velocity is 8.3 m/s and this value is smaller than the value at the A1 section. However, the RMS deviation at A2 section increased than the one at A1 section by 28.3%. At A3 section which represents the inlet of the tube zone, the velocity at near front is low value, 1 m/s. The fastest flow appears at the right front side of the section. This shows that the flow approaching the tube zone is not uniform. The RMS deviation at this section is 48.5%. This is noticeably higher than the values at other sections.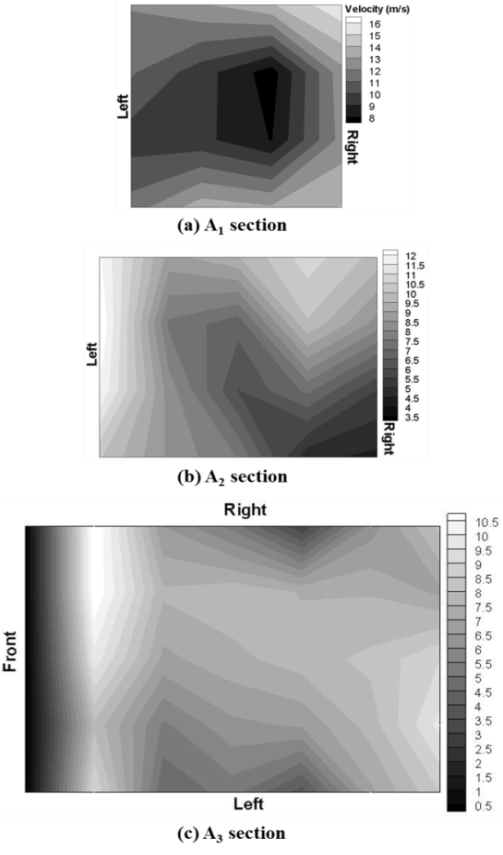 | Figure 5. Velocity distribution contour (see Figure 3 for the location of A1, A2 and A3 section) |
3.2. Water Table Tests
Figure 6 shows the photographs of the flow in 4 cases of different corner angles (see Figure 4 and Table 4 for details). Floating tracer particles represent the streaklines of the flow. The reference case, which has corner angle of 90° and bottom angle of 20° is shown in Figure 6-Case 1. The most notable characteristics of the flow, here exists a recirculation zone near the upper left corner. This recirculation zone can be interpreted along with the low velocity in the A3 section from the wind tunnel model test. From the instant length of the flow path-line, we could estimate the magnitude of the flow velocity. The flow speed is fastest immediately outside of the recirculation zone. This flow pattern is consistent with the result of the velocity measurement data (see Figure 5-(c)). In the flow behavior in Case 3 which only changed the bottom angle to 14° from Case 1, the recirculation zone is also observed distinctly near the corner. However, the flow behavior in Case 2 and Case 4 which with corner angle of 30°, flow recirculation is less distinctively identified as compared to the Case 1 and Case 3. In the Case 3 and Case 4 with the bottom angle of 14°, velocity near the bottom area appears to be decreased. From this set of qualitative visualization, we could interpret that high corner angle makes the flow recirculation and low bottom angle decreases the velocity in the bottom area.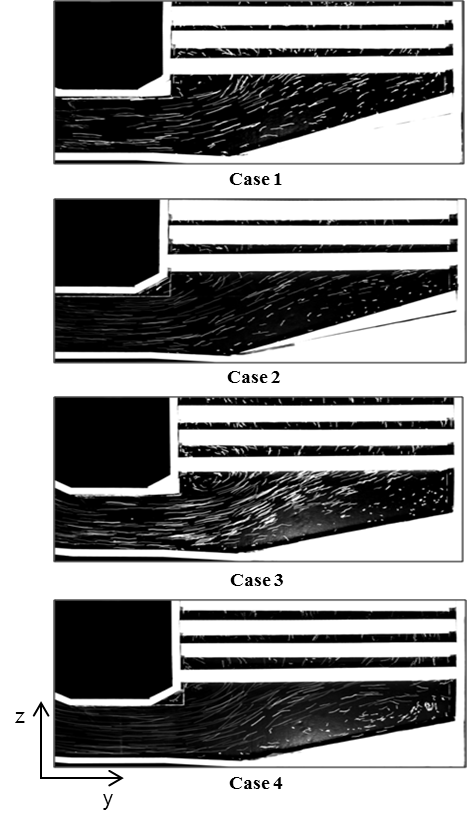 | Figure 6. Flow visualization by water table test |
To supplement the visualization result of the water table tests, CFD analysis was performed for the cases of 2-dimensional water flow. Figure 7 shows the comparison of velocity distributions of each case. As shown in Figure 7-Case 1, CFD analysis data supported the qualitative observation of the water table tests that the velocity is fastest just outside of the recirculation zone near the corner. Also, the flow in Case 1 which has corner angle of 90o and bottom angle of 20o shows the most non-uniformity and flow pattern can be improved according to the selection of the inlet shape, as shown in Figure 7- Case 2-4. Although it is not simple to determine an optimum design of the inlet shape, we could still interpret that low corner and bottom angle do influence the flow pattern, and problem of non-uniform flow can be reduced by changing the inlet shape of the transition zone.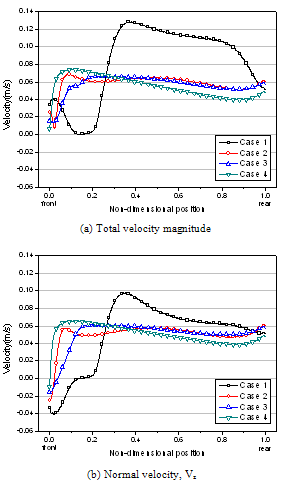 | Figure 7. Velocity distribution from CFD for 2-D water flow |
3.3. 3-Dimensional CFD Simulation
In addition to the scale-down and cold flow model tests, 3-dimensional CFD simulation was conducted for the full scale geometry and hot flow condition. Figure 8 shows the velocity magnitude contour in HRSG by CFD simulation. Flow introduced into the duct is decelerated with the increase of the duct cross-section area. When passing the expansion zone, the flow passes through a complex path and finally into the tube bank area by changing the flow direction at an angle of 90°. Contraction and expansion of cross-sectional area, and sudden change of direction would create non-uniformity of the flow at the tube bank inlet.In addition, to evaluate the simulation reliability, the velocity information by CFD simulation was compared with the data of wind tunnel measurements. Because the uniformity of the inflow to the tube bank area was an object of attention, the velocity distribution of A3 section was selected as a standard position for comparison. Figure 9 shows the comparison of the mean normal velocity Vz at A3 section. In the graph by the numerical simulation, the velocity is very low value, 2.5m/s at 0.04 (non-dimensional x-direction position) and increases very fast to the maximum value, 8.9m/s at 0.16. After that, the velocity decreases slowly to 0.75 position and increases again. In the result of wind tunnel tests, the minimum velocity is 2.5m/s at position 0.04 and the maximum value is 9.8m/s at position 0.2. After that, the velocity decreases until reaching the position 0.64 and increases again. Although the exact velocity value and its position is a little different each other, the velocity profile from the CFD simulation shows a similar trend with the measured one by the experiment.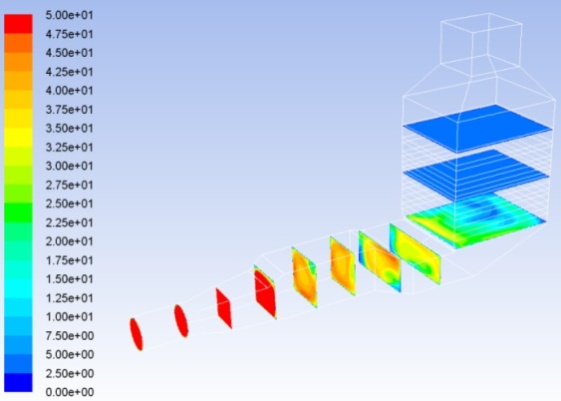 | Figure 8. Velocity magnitude contour in HRSG by CFD simulation |
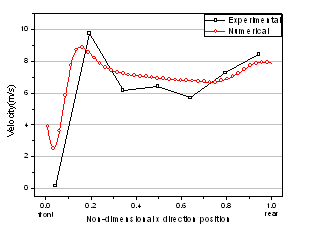 | Figure 9. Comparison of mean normal velocity, Vz at the flow cross section A3 |
4. Improving Flow Uniformity
4.1. Consideration by CFD Simulation
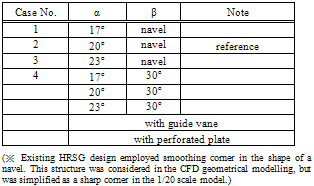
Several studies were carried out to evaluate ideas for better uniformity. As a first trial, changing the shape of transition zone is considered. The geometry of the transition zone is one of the main factors that govern the flow characteristics in the HRSG. 6 cases which changed the geometry of the transition zone were selected as shown in Table 7. Flow correction device (FCD), such as guide vane and perforated plate are commonly employed. In this simulation, additional 2 cases of guide vane and perforated plate as shown in Figure 10 were also considered to investigate the effect of FCD. Case 1-1-2 is the reference case of this work. RMS deviation was used as an evaluation parameter. Simulation was conducted at the inlet cross section of the tube zone, A3 which is consistent with cold flow model tests.Table 7. Selected cases for CFD simulation
 |
| |
|
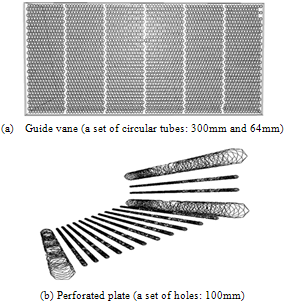 | Figure 10. Flow correction devices |
As a result of the CFD simulation, comparison of RMS deviation in each cases was presented in Figure 11. Case 1-1-1 and 1-1-3 is the case that changed the bottom angle of the transition zone from the reference case 1-1-2. It is not simple to find notable differences among the cases. Effectof the bottom angle to the flow uniformity at the A3 cross-section is shown to be minimal. Cases 1-2-1 through 1-2-3 are the ones that changed the corner shape. RMS deviation based on the total velocity magnitude increased, but decreased highly based on the normal direction velocity. This result means that changing the corner angle improved uniformity of the normal velocity, but at the expense of increased non-uniformity of the x and y direction velocities. Case 2 is the case of considering a guide vane. In this case, RMS deviation based on both total velocity magnitude and normal velocity base are higher than the reference case. The selected design of guide vane is considered to be sensitive in contribution to the flow uniformity. This is considered as a result of 3-dimensional nature of the flow in the duct, and 2-dimensional nature of the proposed guide vane is one of the limiting factor. In Case 3, perforated plate as a flow correction device, flow non-uniformity, or RMS deviation of flow velocity is shown to be lower than in other cases.Current case study is believed to be beneficial in design selection.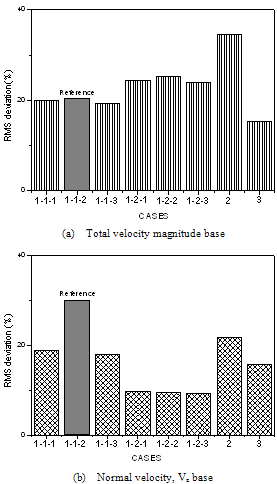 | Figure 11. RMS velocity deviations |
4.2. Verification of Idea through Measurements
To check the effect of the flow correction devices, cold flow model tests were also performed. CFD simulation, the value of RMS deviation in the Case 3 which considered the perforated plate is lower in both bases. So a perforated plate was selected as a FCD in this test and installed in the previous wind tunnel. To be consistent with the CFD simulation, velocities were measured at A3 section which is a appropriate position for the evaluation of the uniformity of the inflow to the tube bank. The measured velocity distribution was shown in Figure 12. The velocity distribution was little changed broadly and the fastest velocity still appeared at the same region as compared to the previous model test without FCD as shown in Figure 5-(c). However, in the region between middle to rear, it looks like that the magnitude of velocity decreases and the flow uniformity increases. This observation can be confirmed more clearly by the velocity RMS deviation. The value of RMS deviation without FCD was 48.5% and this value decreased to 43.6% with FCD. Among the 35 measurement points, 5 measured data in the front line have a very low value and those are tremendous effect on the values of RMS deviation. So the value of RMS deviation was recalculated except those data. In this case, the RMS deviations were 29.7% without FCD and 16.8% with FCD. From this, we could confirm the effect of FCD, perforated plate on the flow uniformity.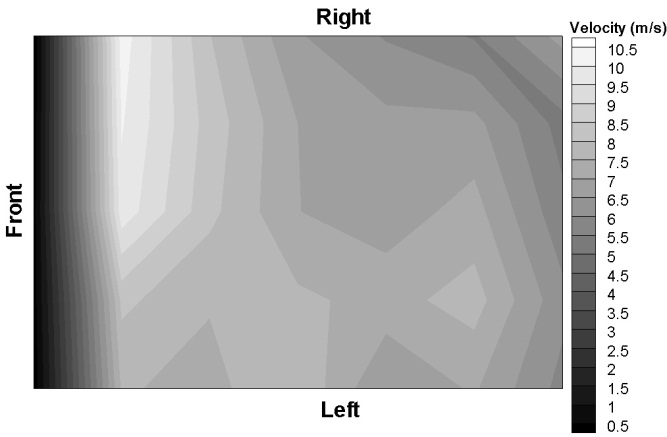 | Figure 12. Velocity distribution contour at A3 (A perforated plate is installed as a flow correction device.) |
4.3. Discussion
Case studies by 3-dimensional CFD simulation were conducted to investigate the effect of inlet duct shape and FCD on the flow uniformity. As a result, the possible alternatives for the improved flow uniformity were presented. Especially, the effect of FCD, perforated plate was confirmed by the cold flow measurements. Presented alternatives, however, were not optimized for better uniformity of flow. Also, it has other problems such as the installation difficulty and the possible occurrence of breaking off from inlet duct during operation. Those facts were not considered in this study and it should be checked before adopting the alternative.Non-uniform flow arising in the transition zone became clear through the investigation by experimental and numerical studies. It can influence the performance and structural damages. Thus, inlet duct should be designed with the consideration of the flow characteristics and perforated plate type FCD can also be used as one option for the problem.
5. Conclusions
Experimental and numerical studies were conducted to understand the flow patterns in the vertical type HRSG. In the cold air wind tunnel test, flow velocity was quantitatively measured with pitot tubes to investigate the flow uniformity. To observe the qualitative characteristics of the flow, water table model tests were carried out. Alternative design of the inlet duct shape on the flow behavior was also investigated through flow visualization. Recirculating flow zone is noticeable near the sharply turning corner, and this non-uniformity can be eliminated by modifying the geometry of the flow passage.CFD simulation results were compared to that of the model tests. From this comparison, computational results showed good agreement with the experimental data, and which was considered to be one example of validation.Design alternatives to reduce the non-uniformity of the flow, such as the change of inlet duct shape, introduction of flow correction devices such as a guide vane and a perforated plate are evaluated. Quantitative comparison based on RMS deviation of the normalized velocity was presented. Among the ideas, a perforated plate showed the best performance for the uniformity improvement. Experimental measurements in the scale-down model were presented as one way of back up to the CFD simulation of the alternative design.
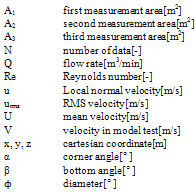
Nomenclatures
ACKNOWLEDGEMENTS
The present work was supported by SeenTec Co. Ltd. and Brain Korea 21.
References
| [1] | Hegde, N., Han, I., Lee, T. W., and Roy, R. P., 2007, Flow and heat transfer in heat recovery steam generators, Journal of Energy Resources Technology, 129, 232-242 |
| [2] | Tenbusch, A. F., 2003, CFD modeling of cogeneration burner applications and the significance of thermal radiative heat transfer effects, Proceeding of International Joint Power Generation Conference, 731-742 |
| [3] | Data Book of Ulsan Combined Cycle Power Plant Unit 2, Korea Power Engineering Company Inc., 2007 |
| [4] | Lee, B. E., Kwon, S. B., and Lee, C. S., 2002, On the effect of swirl flow of gas turbine exhaust gas in an inlet duct of heat recovery steam generator, Journal of Engineering for Gas Turbines and Power, 124(3), 496-502 |
| [5] | Yoo, G.J., Choi, H. K., Choi, K. L., and Shin, B.J., 2009, A numerical study of the turbulent flow characteristics in the inlet transition square duct based on roof configuration, Transaction of KSME(B), 33(7), 541-551 |
| [6] | Chong, C. H., and Song, J. I., 2008, Effect on thermal performance of superheater module under part load operation in HRSG, Journal of Energy Engineering, 17(3), 161-166 |
| [7] | Obata, M., Miyao, S., Kurata, K., and Kusakari, K., 1997, Visualization of gas flow in natural circulation boilers, Proceedings of the International Symposium on Flow Visualization, 189-194 |
| [8] | P. Basu,C. Kefa,and L. Jestin, Boilers and Burners, Springer, New York, 2000 |
| [9] | A. K. Gupta, Swirl Flow, Abacus press, England, 1984 |
| [10] | P. P. Walsh,Gas Turbine Performance (2nd edn), Blackwell Science, Malden, 2004 |
| [11] | Ryu, C. K., Kim, S. K., and Choi, S. M., 1998, A Cold flow experiment for the incinerator shape design, Transaction of KSME, 18(8), 2184-2193 |
| [12] | Fluent 6.3 User's Guide, FLUENT Inc |
| [13] | Cho, J. M., Choi, J. W., Hong, S. H., Kim, K. C., Na, J. H., and Lee, J. W., 2006, Application of computational fluid dynamics analysis for improving performance of commercial scale selective catalytic reduction, Korean Journal of Chemical Engineering, 23(1), 43-56 |
 Abstract
 Reference
 Full-Text PDF
 Full-Text HTML