World Environment

p-ISSN: 2163-1573    e-ISSN: 2163-1581

2024;  14(1): 20-30

doi:10.5923/j.env.20241401.02

Received: Oct. 16, 2023; Accepted: Nov. 20, 2023; Published: May 13, 2024


Characterization of Biochar Produced from Sawdust for Environmental Management

Kumar Latchman1, Dawn Fox1, Patrick Ketwaru1, Dharamdeo Singh2, Diana Seecharan3

1University of Guyana, Chemistry, Turkeyen Campus, Greater Georgetown, Guyana

2University of Guyana, Agriculture, Turkeyen Campus, Greater Georgetown, Guyana

3University of Guyana, Biology, Turkeyen Campus, Greater Georgetown, Guyana

Correspondence to: Kumar Latchman, University of Guyana, Chemistry, Turkeyen Campus, Greater Georgetown, Guyana.

Email:

Copyright © 2024 The Author(s). Published by Scientific & Academic Publishing.

This work is licensed under the Creative Commons Attribution International License (CC BY).
http://creativecommons.org/licenses/by/4.0/

Abstract

Biochar is a natural carbon-rich material produced via the thermochemical decomposition of biomass under inert atmosphere, a process known as pyrolysis. Sawdust is considered a forest waste and has long been researched and considered a feedstock for biochar production. The main objective of this research is to investigate how different types of sawdust composition (Peltogyne spp and Ocotea oblonga) and pyrolysis temperature affect selected properties of biochar. The two types of sawdust were collected from a sawmill in Guyana and were pyrolyzed using a thermogravimetric analyzer at 300°C and 700°C to produce four prototypes of biochar. The two types of sawdust and the four prototypes of biochars were characterized using International Biochar Initiative (IBI) standard. The results indicated the following: (1) there are statistically significant differences between the characterized properties of the types of sawdust, (2) pyrolysis temperature affects biochar yield, and (3) there are statistically significant differences between the physicochemical properties of four prototypes of biochars, specifically volatile matter, fixed carbon, ash, selected total and exchangeable elements, pH and conductivity.

Keywords: Biochar, Pyrolysis temperature, Sawdust

Cite this paper: Kumar Latchman, Dawn Fox, Patrick Ketwaru, Dharamdeo Singh, Diana Seecharan, Characterization of Biochar Produced from Sawdust for Environmental Management, World Environment, Vol. 14 No. 1, 2024, pp. 20-30. doi: 10.5923/j.env.20241401.02.

1. General Introduction and Overview

Biochar is a natural carbon-rich material produced via the thermochemical decomposition of biomass under an inert atmosphere, a process known as pyrolysis (Verheijen et al., 2010). This process is very similar to that of the production of other charred materials such as charcoal. However, it is the application of biochar that distinguishes it from other charred materials. The term “biochar” is a relatively recent name given to charred materials intended for soil application (O'Laughlin & McElligott, 2009). The term was first proposed in 2005, however, as a material, biochar application to soil is an ancient practice dating back to thousands of years (Adeyemi & Idowu, 2017). The incorporation of biochar into soil has been reported to improve soil physical and chemical properties (Wang et al., 2015), including soil organic carbon, aeration, cation exchange capacity, water holding capacity, pH regulation and microbial ecology (Ronsse et al., 2013). The highly porous structure of biochar is potentially responsible for improved retention of water in the soil as well as nutrients and agrochemicals for plants and crops. As a result, more nutrients stay in the soil instead of being leached into groundwater which can lead to environmental pollution. Therefore, biochar has remarkable potential in food security, especially where there is a shortage of water or chemical fertilizers, and areas with poor soils.
Biochar has considerable carbon sequestration value. The international biochar organization proposed that biochar is expected to sequester 2.2 gigatons of carbon by 2050. When biochar is incorporated into soil its carbon fraction is known to be very stable with a half-life of approximately 1000 years (Ronsse et al., 2013). The stability of biochar carbon is of critical importance in the context of environmental management for two main reasons: the stability of the carbon will determine how long the biochar will stay in the soil and help with the mitigation of climate change, and stability will influence how long biochar will aid in providing secondary benefits to soil such as improving its physical and chemical properties (Budai et al., 2013).
Perhaps the most easily and readily understood application of biochar is its role in agriculture and forestry waste management. Biochar can be produced from many different biomass materials including crop residues, manures, forest residues, and urban organic waste (Duku et al., 2011). Thus, residues which pose serious waste disposal issues such as contaminating ground and surface waters can be converted to biochar. Moreover, a significant amount of forest and crop residues in most traditional agroforestry systems is allowed to burn or decay, releasing carbon dioxide and other greenhouse gases into the atmosphere. Hence, converting organic waste into biochar can help in the mitigation of climate change (Lehmann & Joseph, 2015).
Biochar production is a technology that has tremendous potential as an emerging solution in environmental management, climate change mitigation, biomass waste disposal and protection of soil environment (Tag et al., 2016). However, the feedstock composition is highly determined by the botanical species, plant part, soil types, climate conditions, and the time of harvest (Suliman et al., 2016). Further, both feedstock composition and pyrolysis temperature highly influence biochar yield and properties such as ash content, hydrogen/carbon ratio, oxygen/carbon ratio, carbon/nitrogen ratio, pH, surface area, and cation and anion exchange capacity (Mukome et al., 2013). These properties function as proxy and indicator of biochar potential in environmental management via carbon sequestration, mitigation of greenhouse gas emission, soil improvement, and crop productivity (Leng et al., 2019).
Currently, there is no comprehensive assessment of sawdust biomass in Guyana as a feedstock for biochar production. The composition is expected to be unique and will influence biochar properties very differently. Therefore, investigating the effects of sawdust composition and pyrolysis temperature on resulting biochar properties is an area of research that is needed in order to adopt this technology. This knowledge can be utilized in designing and optimizing biochar with properties for the intended application. The main objective of this research was to investigate how the composition of low density Ocotea oblonga (locally known as Silverballi) and high density Peltogyne spp (locally known as Purple Heart) species biomasses and pyrolysis temperature affect selected properties of biochar. The specific objectives were to: 1. characterize the physicochemical properties of the two types of sawdust feedstock (low density and high density), 2. produce biochar and determine precent yield from the two types of sawdust feedstocks at two different pyrolysis temperatures, and 3. characterize the physicochemical properties of the resulting biochars produced from the two types of sawdust feedstocks under the two different pyrolysis temperatures.

2. Materials and Method

Sample collection
Low density (Silverballi) and high density (Purple Heart) sawdust samples were collected at the time of production from a sawmill on the East Bank of Demerara, Georgetown, Guyana. The Guyana Forestry Commission reported the density of these two types of wood as 840 kg/m3 and 420 kg/m3 for the Purple Heart and Silverballi respectively. In this research, the Purple Heart was referred to as high density (HD), while the Silverballi as low density (LD).
Feedstock Preparation
Prior to the experiments, the samples were washed several times with deionized water and dried in an air oven at 80°C for 24 hours. Using a food processor, the sample size was reduced and sieved through an 80 mesh to obtain a uniform particle. The samples were placed in zip-lock bags and stored in a dry environment.
Biochar Production
Pyrolysis experiment was carried out in a thermogravimetric analyser (LECO 701 TGA) under a nitrogen stream (at 5 L min -1, ambient temperature and pressure). A pre-drying programme was carried out at 105°C to establish constant weight, and then pyrolysis was carried out at different temperatures (300 and 700°C) for each species of feedstock. The pyrolysis heating rate employed was 4°C min -1 and a resident time of 1 hour. After pyrolysis, samples were left in the TGA to cool to room temperature under a nitrogen stream of 3 L min-1. The biochars obtained were labelled LD 300, HD 300, LD 700 and HD 700.
Biochar Sample Preparation
The biochar samples were reduced in size using a mortar and pestle, and sieved to obtain a uniform particle size of 80 mesh. Further, they were placed in zip-lock bags and stored in a desiccator.

3. Procedure

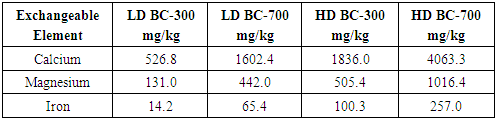
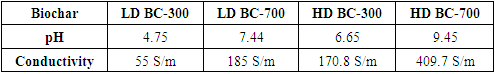
The toxicological characterization (As, Cd, Cr, Co, Pb, Ni, Se, Zn, B & Na) and (Hg) of the two types of feedstocks and the four prototypes of biochar were determined by the method TMECC (2001) and US EPA (2007) (Initiative, 2015). The proximate analysis was done using the thermogravimetric analyser (LECO 701) and the temperatures outlined by the American Society of Testing and Materials (ASTM) D1762-84 method. Total Nitrogen of biochar was conducted by Kjeldahl Digestion for nitrogen followed by measurement at 420 nm with accordance with the manufacturer manual (Agilent Carry UV-VIS spectrophotometer).
Total Sulphur was conducted by using 1 g of ground, oven dried (60°C) sample and digested in 10 ml hydrochloric acid to approximately 5 mL in volume, and then 1 mL of hydrogen peroxide was added. The digest was quantitatively transferred to a 100 mL volumetric flask, filtering through Whatman # 40 filter paper, and left to stand for an hour. 10 mL aliquot of solution was transferred into a 50 mL volumetric flask. The following were added: 2 mL of distilled deionized water, 1 mL of 0.5% Gum acacia, 1mL of 6 M hydrochloric acid and 0.5 g of barium chloride. The flask was swirled and made up to mark with distilled deionized water, capped, mixed thoroughly and left to stand for 10 minutes. Measurement was made at 420 nm with accordance with the manufacturers Manual (Agilent Carry UV-VIS spectrophotometer).
Conductivity and pH of biochar was determined by using 5.0 g of air-dried biochar sample (ground < 2mm) that was weighted into a shake bottle and 50 mL of deionized water was added. The bottle was then shaken for 90 minutes at 25°C on a mechanical shaker. Further, it was allowed to stand for an additional 30 minutes. Measurement was made using pH and conductivity meter.
Extractable metals (Ca, Mg, and Fe) in biochar were determined using 1g of air-dried biochar weighed into a bottle and 20 mL of 1 M hydrochloric acid was pipetted into the bottle. The bottle was shaken on a reciprocal shaker 2 hours at 25°C and was further allowed to stand for 16 hours. The suspension was then filtered through a Whatman no. 42 paper into a 25 mL volumetric flask. The flask was filled to mark with 1 M hydrochloric acid. The samples were then analysed using the flame atomic absorption spectrophotometer (Agilent 240 AA series).

3.1. Experimental Design

The Completely Randomized Design (CRD) experimental design was utilized in this research. This experimental design was used because there was no need for blocking since the experimental units are homogenous. There were four (4) treatments and each treatment was replicated three (3) times. The four (4) treatments used were Treatment 1: LD BC300, Treatment 2: LD BC 700, Treatment 3: HD BC 300, and Treatment 4: HD BC 700.

3.2. Data Analysis

The two feedstock and four prototypes of biochar toxicology data were compared with International Biochar Initiative (IBI) standards. STATISTIX 10 software was used to generate simple ANOVA table at a 95% confidence interval to check for significant difference between the properties of the two types of feedstocks, the yields of the four prototypes of biochars and their properties. A completely randomized design (CRD) ANOVA with replication table was generated using Microsoft Excel to specifically check if there is interaction between temperature and feedstock in determining any define properties in biochar. Further, this design allowed for the approximation of which factor (type of feedstock or pyrolysis temperature) had a greater influence on a given biochar property. Further, Microsoft Excel was used to generate graphs, tables and charts.

4. Results and Discussion

Toxicological Assessment
The two types of biomasses (low density species and high density species) and the four prototypes of biochar (LD BC- 300, LD BC-700, HD BC-300 and HD BC-700) were characterized according to requirements of Test Category B Toxicant Assessment: (As, Cd, Cr, Co, Pb, Ni, Se, Zn, B, Na and Hg) of the IBI Standard (Initiative, 2015). The standard declared that feedstock used for biochar production must not contain unacceptable levels of toxins. Quilliam et al. (2013) reported biochar derived from feedstock contaminated from copper-preservative treated wood and presence of preservative treated timber in the feedstock increased available soil copper. In this study, there was an apparent increase in Cu, Na and B in the resulting biochar relative to the concentration in the respective feedstock. This concentration of elements during pyrolysis was further noted when Zn was not detected in the feedstocks but were quantified in four prototypes of biochar. The process of pyrolysis is known to concentrate inorganic elements present in the feedstock in the resulting biochar (Ok et al., 2015). The other elements were not detected in either feedstocks or the prototypes of biochar. Therefore, it can be concluded that the two types of biomass and the four prototypes of biochar meet toxicological criteria to be qualified as safe feedstocks for biochar production and safe for soil amendment respectively.
Proximate Analysis Feedstock
The proximate analysis includes the determination of moisture, volatile matter, ash and fixed carbon content. Knowledge of proximate analysis gives an insight of the thermal reactivity of the biomass and, therefore, can be useful in understanding how thermochemical conversion processes like pyrolysis will affect the biomass and properties of the resulting biochar, e.g., yield and composition (Acquah et al., 2017). Analysis of Variance (ANOVA) indicated that there is a statistically significant difference (p < 0.05) between the parameters of the proximate analysis for the two types of biomass species.
The moisture contents were 13.97% and 12.03% for the low density species (LDS) and high-density species (HDS) respectively. Therefore, it may be necessary to dry this biomass before it is used for biochar production since the recommended moisture content of feedstock for pyrolysis is less than 10% (Ahmad et al., 2019; Sudagar et al., 2020). The moisture content of biomass is one of the parameter that significantly defines the energy input necessary to achieved pyrolysis temperature (Tomczyk et al., 2020). Generally, lower moisture content biomass is preferred to high moisture biomass because less heat and time will be required to achieve pyrolysis and therefore, the process is more cost effective.
The low-density species had higher volatile matter (83.64%) content relative to the high-density species (78.05%). A study indicated that less thermally stable polysaccharides are responsible for the yield of volatiles (Acquah et al., 2017). Therefore, this variation can be as a result of difference in cellulose and hemicellulose content of biomass. In fact, the proportion of cellulose and hemicellulose is known to vary within the same type of biomass. For example, wood contains approximately 40–45% cellulose and hemicelluloses 15-30% (Waliszewska et al., 2019). The volatile matter content of biomass correlates with the production of bio-oil, one of the co-products of pyrolysis. Therefore, it is expected that feedstock with higher volatile matter content will promote the formation of higher quantity of bio-oil relative to the other co-products such as biochar and syngas (Di Stasi et al., 2021). In fact, the yield obtained from this study supports that the low-density species yielded lower biochar content relative to the high density species because of its higher volatile matter content (see Figure 3).
This study found significantly higher fixed carbon content for high density species (20.89%) relative to low density species (16.12%). This variation in fixed carbon content in wood waste from sawmills is in agreement with findings from similar studies, such as Ogunsola et al. (2018) and Hayee (2012). Acquah et al. (2017) suggested that more recalcitrant lignin composition of biomass is responsible for this higher yield of fixed carbon. Thus, the difference in fixed carbon content in the two types of wood biomass in this study may be as a result of differences in their lignin content relative to hemicellulose and cellulose. Lignin is a type of hydrocarbon polymers (amorphous and hydrophobic) with a high molecular weight and functional groups that are aromatic in nature (Abu & Dahman, 2017). While, hemicellulose and cellulose are simple monomer with low molecular weight (Tomczyk et al., 2020). As a result, each of these chemical polymers has a different temperature range at which they decompose. Hemicelluloses are degraded at 200°C–260°C, while cellulose at 240°C–350°C and lignin at 280°C–500°C (O'Laughlin & McElligott, 2009). Another study done on producing biochar from woody feedstock showed thermochemical lignocellulose degradation begins at approximately 130°C, which is the temperature where lignin starts softening. Hemicellulose degrades at 150–350°C, cellulose at 275–350°C, and lignin at 250–500°C. Thus, hemicellulose and cellulose degrade at relatively lower pyrolysis temperatures compare to lignin (Gezahegn et al., 2019).
Wang et al. (2015) stated that higher lignin biomass is known to enhance carbonization and facilitate higher biochar production rate. Therefore, during the thermochemical degradation of biomass the feedstock composition is expected to determine the quantity of pyrolysis co-products of biochar, bio-oil and syn-gas. Biomass with higher lignin content will enhance carbonization and favor the production of biochar (Shengsen Wang et al., 2015; Yadav & Jagadevan, 2019), while, hemicellulose and cellulose promotes the formation of bio-oil and syn-gas (Yadav & Jagadevan, 2019). As a result, the high-density species is expected to yield higher biochar since biomass with higher fixed carbon promotes the formation of solid products during pyrolysis. In fact, this study supports that higher fixed carbon biomass promotes the formation of greater biochar yield (see Figure 3). Thus, prior knowledge of the fixed carbon content of feedstock can be useful in predicting the yield of biochar.
The ash content is the residue remaining after the biomass is completely oxidized. The main components of this residue are oxides of various metals (Di Stasi et al., 2021). In this study, the high-density species reported significantly higher ash content (1.06% dry wt) relative to low density species (0.25% dry wt). This variation in ash content is also observed in other independent studies. Gérard et al. (2019) surveyed 599 hardwood species and reported a minimum and maximum ash content of 0.02% and 5.00% wet weight. Further, Hayee (2012) reported higher ash content in hardwood species (0.8% dry weight) relative to softwood (0.3% dry weight). This variation in ash content in biomass depends on the organic and inorganic matter, which is influenced by a number of factors such as the species, sampling point and harvesting time (Zajac et al., 2018). Biomass ash content retained in biochar can enhance soil properties to a greater extent than fertilizer (Saletnik et al., 2018). Therefore, high ash content species may be the feedstock to produced biochar with higher ash content with more inorganic metals that can supply soil that is deficient in metals.
Total Selected elements of Feedstock Biomass
The elements N, S, K, Fe, Ca and Mg are among the list of plant macro and micro nutrients and it was on this basis they were selected as the elements for this characterization. The elemental composition of the two types of woody biomass in this study found that low density species has higher N, and S content, while the high-density species has higher content of K, Fe, Ca and Mg (see Figure 1). The higher concentration of the inorganic elements K, Fe, Ca and Mg in high density species can be attributed to the higher ash content reported in this feedstock. On the other hand, greater N and S content in low-density species maybe as a result of more proteins and amino acids in this material (Ippolito et al., 2020; O'Laughlin & McElligott, 2009). The differences in elemental composition were statistically significant for the two types of feedstocks (p < 0.05) in this study. This variation in elemental composition of woody biomass was reported in other studies (Hayee, 2012; Zajac et al., 2018), which can be influenced by a number of factors such as the species, sampling point and harvesting time (Zajac et al., 2018). Therefore, knowledge of elemental composition of biomass can provide information that can give a reasonable prediction about the elemental composition of biochar because it has been correlated with feedstock total nutrient content (Ippolito et al., 2020).
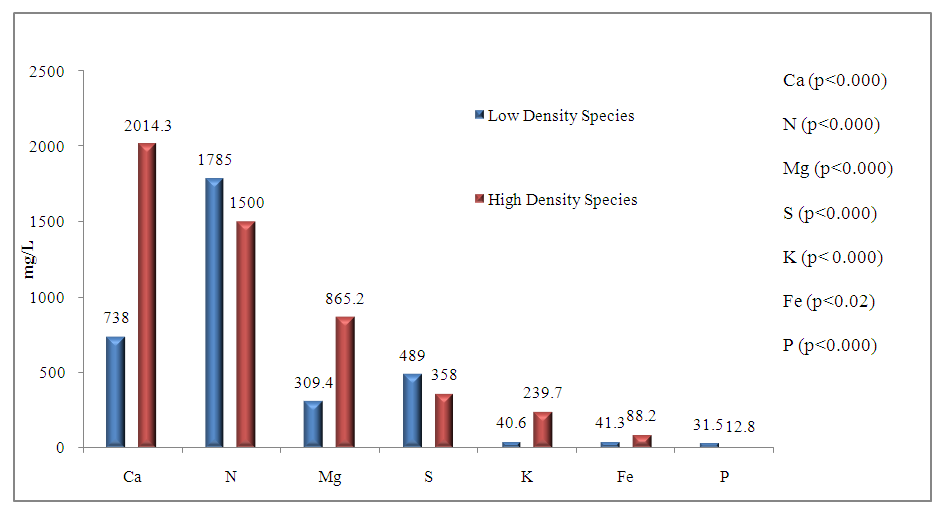
Figure 1. Total Elements composition of the two species biomass
Proximate Analysis of Biochar
The moisture content of the four biochars in this study ranged from 4.26 – 4.45%. Moisture content is not a material property of biochar. However, IBI standard stipulates for the moisture content of biochar to be declared. This may be due to the fact that biochar with higher moisture content can increase transportation and storage costs (Hu et al., 2015). The volatile matter and fixed carbon content have been utilized as in direct estimation of the labile and recalcitrant portions of biochar (Aller et al., 2017). Also, the ash content can provide insight about the nutritional content of biochar (Singh et al., 2017).
ANOVA indicated that there are statistically significant differences between the volatile matter, ash and fixed carbon content for biochars derived from the same type of feedstock at the two respective temperatures. However, when the biochars from different feedstock type and temperatures were compared, they were no significant difference in the ash content for low density biochar derived at 700°C and high-density biochar derived at 300°C. Similarly, there is no significant difference between the volatile matter content for low density species derived biochar and high-density species derived biochar at 300°C. Further, two-factor ANOVA showed that both volatile matter and ash content of any biochar are dependent on temperature and feedstock. However, the fixed carbon of any biochar is dependent on temperature only. Nevertheless, between temperature and feedstock, temperature had greater precedence on determining volatile matter and fixed carbon, while feedstock origin had a greater on ash content.
The biochars derived from the same type of feedstock at the two respective temperatures showed that the volatile matter decreased as pyrolysis temperature increased from 300°C to 700°C. The low density species feedstock derived biochar and high density species feedstock derived biochar volatile matter decreased from 51.35 to 11.19% and 50.35% to 9.35% respectively. This trend can be explained by increasing loss of volatile products (gas tar, low molecular weight hydrocarbons) and an increase in aromatization of the carbon from the original feedstock (Domingues et al., 2017; Tomczyk et al., 2020; Maaz et al., 2021). This decrease in volatile matter with an increase in pyrolysis temperature was also reported in other studies. Domingues et al. (2017) reported a decrease in volatile matter as pyrolysis temperature increased from 350°C to 750°C in biochars derived from different feedstocks including chicken manure, Eucalyptus sawdust, coffee husk, sugarcane bagasse and pine bark. Similarly, Ronsse et al. (2013) also reported a decrease in volatile matter as pyrolysis temperature increased from 300°C to 750°C in biochar derived from wood, straw, green waste and dry algae feedstocks. In the IBI standard, under the soil enhancement category, volatile matter is listed as a parameter to be characterized in biochar. Volatile matter content can affect biochar’s through its mineral stability, availability of its N and sorption capability (Tomczyk et al., 2020). High volatile matter biochar is not suitable for soil with low N content because it can decrease the availability of soil N due to an increased uptake of this N by increasing microbial activity (Li et al., 2019). On the other hand, high volatile matter biochar is suitable for soils with less C but more N because it may enhance soils organic N through increasing microbial degradation. Based on the findings of this study it can be recommended that the biochars obtained at 300°C may be more suitable to be added to soils with high N content. Conversely, the biochars derived at 700°C maybe more applicable to soils with low N content.
As pyrolysis temperature was increased from 300°C to 700°C, the fixed carbon content in the produced biochars increased from 48.19 to 87.45% for low density species biochars and from 48.26 to 86.38% for high density sawdust biochars. Similar observation was reported in several studies for woody feedstock (Ronsse et al., 2013; Domingues et al., 2017; Zhang et al., 2017). This increase in fixed carbon is due to increasing loss of volatile matter (Crombie et al., 2013), thus a general decrease in biochar mass rather than extra carbon fixing reactions (Ronsse et al., 2013). In this study, the biochars also have greater fixed carbon content compared to its biomass. This may suggest that biochar has greater carbon stability compared to the feedstock (Bandara et al., 2017). Therefore, the carbon in biomass that has residence time of just a few years and can rapidly decompose can now be stored in biochar, which has residence time in the range of hundreds to thousands of years (Shackley et al., 2011).
The carbon sequestration potential of biochar is directly related to the stability of its carbon content when added to soil. Although the organic carbon content of biochar is considered to be recalcitrant, it degrades over time (Ok et al., 2015). Therefore, the stability of biochar carbon is inherent in its structure and can be evaluated by assessing the degree of aromaticity (Leng et al., 2019). There is no globally defined method for assessing the absolute stability of biochar. There are a few methods used in approximating their relative stability (Crombie et al., 2013). Fixed carbon has been reported and used as a proxy to measure biochar carbon stability, which translates to its carbon negative potential, with higher yield indicating a greater ability to function as a tool for climate change mitigation (Leng et al., 2019). Fixed carbon is not directly determined by experiment but instead calculated by weight difference from the proximate parameters. Hence, it does not directly measure elemental carbon because it may be conflated by the presence of other stable compounds in the ash content. Likewise, volatile matters show some level of association with liable carbon, and could give some insight into biochars stability. However, volatile matter was eventually rejected as a means of assessing biochar stability because it failed to estimate biochar half-life between biochars from different sources (Spokas, 2010). Nevertheless, volatile matter (VM) when used in conjunction with fixed carbon (FC) showed the best correlation with H/C and O/C elemental ratio (Klasson, 2017) (see Table 1).
The H/C and O/C molar ratio is related to biochar stability and the lower these values are, the greater the stability. However, it has been recommended to utilize the organic carbon (C org) instead of the total carbon (C) because the presence of inorganic carbon is not expected to remain in soil and contribute to carbon sequestration (Budai et al., 2013). Nonetheless, the H/C and O/C are widely accepted because the inorganic carbon is deemed to have an insignificant effect on the overall assessment of stability (Chen et al., 2021). Therefore, these correlations can be used to assess biochar stability based on the criteria of H/C org and O/C org stipulated by the following voluntary standards: International Biochar Initiative (IBI) and European Biochar Certificate (EBC) (Leng et al., 2019). The H/C org is used to distinguish between biochar and partially changed biomass during the thermochemical process. H/C org ratio greater than 0.7 indicates the biomass is being partially converted and retained most of its original composition, while 0.7 H/C ratio or less is an indication of a fused aromatic structure formed, and thus, correlates well with the thermochemical treatment process leading to aromatic structure in biochar. O/Corg ratio is declared by both the IBI and EBC as a parameter that can be used to determine biochar stability. However, EBC adopted it as part of its standard requirement for characterising biochar, while the IBI only made reference to its application and did not adopted it as a requirement. EBC standard required biochar to have an O/Corg ratio of less than 0.4 (Meyer et al., 2017).
Klasson (2017) showed that H/C and O/C mol ratios can be correlated with the volatile matter and fixed carbon mass fraction ratio from proximate analysis. In this study, H/C and O/C were derived from proximate analysis using mathematical expressions (see table 1). Also, caution was taken given that misclassification of biochars by both IBI and EBC were reported when correlation were used for biochar derived at pyrolysis temperature at 400°C and below (Leng et al., 2019). Therefore, it can be deduced that both the LD and HD prototypes of biochar produced at 700°C meets the requirement of H/Corg and O/Corg ratio stipulated by IBI and EBC standards.
Table 1. H/C and O/C ratio for high temperature biochars
     
Spokas (2010) also related VM/FC to biochar stability. Proximate analysis (VM/FC) and O/C ratio showed great correlation (N= 207, R2 =0.802) and can be used to measure biochar stability (Chen et al., 2021). VM/FC values of < 0.88 can approximate biochar with a half-life of > 1000 years. While 0.88 <VM/FC <3.0 can predict half-life of 100- 1000 years (Leng et al., 2019). In this research the VM/FC ratio for derived from proximate analysis (see Figure 2). Therefore, it can be approximated that high temperature prototype biochar is expected to have longer half-life compared to low temperature biochars for both feedstocks.
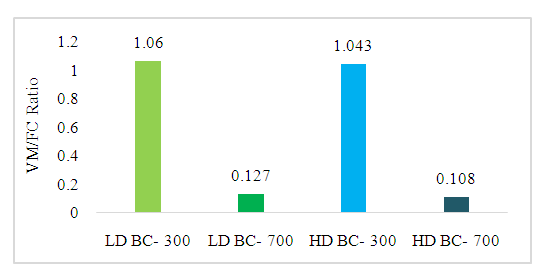
Figure 2. Volatile Matter/ Fixed Carbon Ratio of the four Prototypes of Biochar
The methods incorporated in this study to estimate the biochars stability used the results from characterizing the biochars proximate properties. The advantages of using proximate analysis for assessing biochar stability includes cost effectiveness relative to other methods and good correlation with other methods such as ultimate analysis results and aromaticity. However, the disadvantages are based on variations due to different proximate analysis conditions, R50 index not fully classified and dependence on result from other methods (Leng et al., 2019).
This study showed the trend of biochar ash content increasing with increasing pyrolysis temperature. The low-density sawdust derived biochar at 300°C has an ash content of 0.46%. When pyrolysis temperature was increased to 700°C, the ash content increased to 1.36%. Similarly, the high-density sawdust derived biochar ash content increased from 1.39% to 4.27% as pyrolysis temperature increased from 300°C to 700°C. This observation can be explained due to an increase in the volatilization with increasing pyrolysis temperature (Muradov et al., 2012). The volatilization process involves the loss of carbon, hydrogen and oxygen, while a large proportion of the ash content of the biomass is retained in the resulting biochar where it is concentrated (O'Laughlin & McElligott, 2009). These trends were observed by Crombie et al. (2013) and Klasson (2017). The biochars derived from the high-density sawdust have greater ash content relative to the biochars derived from the low density sawdust. Higher ash content biochar is expected to have more inorganic minerals and can improve soil nutritional content when this biochar is incorporated in to soil (Roberts et al., 2010).
Selected Total Elementals of Biochar
Further, the four prototypes of biochar were characterized to determine their total nutritional content (see Table 2). The total elemental composition of biochar consists of either the portion of the element that is strongly associated with biochar structure and the portion that is available or easily exchangeable (O'Laughlin & McElligott, 2009). This retention and concentration of Ca, Mg and Fe in the biochars, especially with increasing pyrolysis temperature is due to their thermal stability and is said to vaporise only at high temperatures (O'Laughlin & McElligott, 2009; Verheijen et al., 2010). However, K is known to be less thermally stable and vaporises at lower temperatures, yet it was more concentrated in the higher temperature biochars. It can be hypothesized that the rate of vaporization or loss of this element during pyrolysis, especially at higher temperature, is less compared to other components that are volatilize during pyrolysis. This trend was reported by Zhang et al. (2017) and Zhao, et al. (2017).
Table 2. Selected Total Elements of Biochar
     
On the other hand, S and N concentration of the biochars in this study decreased with increasing pyrolysis temperature. This was expected since S and N are only relatively stable at low pyrolysis temperatures, and are expected to volatilize at higher temperatures (Verheijen et al., 2010). Likewise, it was reported as pyrolysis temperature increased from 200- 800°C, S and ratios (O + N)/C, and (O + N + S)/C decreased (Al-Wabel et al., 2013). This decrease in the ratio is an indication of the reduction of N and S as pyrolysis temperature increased. Thus, N and S content decreases in biochar as pyrolysis temperature increases (Cantrell et al., 2012; Zhang et al., 2017). The concentration of these elements, with the exception of N and S, are statistically different (P<0.05) for the four prototypes of biochars. The concentration of any of these elements for any biochar is dependent on feedstock and temperature except for Fe and S. Finally, both pyrolysis temperatures and feedstock selection can be optimized to influence the concentration of these elements with temperature having a greater effect on Ca, K, Fe and S, while feedstock on Mg and N in the biochars.
The IBI standard requires for biochar total K content to be declared and suggested that this concentration of is representative of the available K in the biochar. An increase in total K content in biochar significantly increased its available concentration (Zhang et al., 2013). Ippolito et al. (2020) found that there was a very good correlation between hardwood biochar available K and total K (R2 = 0.87), and available K can be predicted from the total concentration. However, biochar total elements cannot precisely determine its nutrients availability because of poor correlation (R2 = 0.35, 0.11, no fit, and 0.09 for K, Ca, Mg, and Fe) (Ippolito et al., 2020). Thus, it should be highlighted that the total concentration of these elementals in biochar does not necessarily represent the amount that will be available to improve soil nutritional content. Therefore, it is important to characterize the available nutrients content of biochar, especially if recommendation about application rate is to be used to improve soil nutritional content.
Selected Exchangeable Elementals of Biochar
Nevertheless, the exchangeable elements are recommended when assessing biochar's potential to improve soil fertility. Available nutrients are that portion of an element or compound that can be assimilated by growing plants (O'Laughlin & McElligott, 2009). In this study, the availability of Ca, Mg and Fe were determined and the concentration of these elements increased with increasing pyrolysis temperature (Table 3). Also, the feedstock with the higher concentration of these elements produced biochars with higher concentration. Further, there was statistically significant difference between these elements for the feedstocks and well as the biochars. This is suggesting that feedstock composition and pyrolysis temperature can influence the availability of biochar nutrient content.
Table 3. Selected Exchangeable Elementals of Biochar
     
pH and Conductivity of Biochar
IBI Standard stipulates for pH and conductivity of biochar to be declared based on the fact that these are two chemical properties that are routinely measured for biochar application to soils. The pH and conductivity of the four prototypes of biochars are statistically different not only between biochars from same feedstock at different temperatures, but also between biochars from different feedstock at different temperatures. Two-way ANOVA also revealed that both feedstock and pyrolysis temperature can influence these properties with temperature having a greater influence. Therefore, knowledge of feedstock composition and pyrolysis temperature can be useful in designing biochar with specific pH and conductive properties.
Table 4 shows the pH and conductivity of four prototypes of biochar. In this study, the biochars produced at the higher pyrolysis temperature (700°C) have higher pH and conductivity. Also, the high-density sawdust biochars have higher pH and conductivity at the higher pyrolysis temperature. Similarly, studies done by Zhang et al. (2013), Gai et al. (2014) and Zhang et al. (2017) indicated as pyrolysis temperature increases pH and conductivity increase in oak and wheat straw biochars respectively.
Table 4. pH and Conductivity of Biochar
     
This increase in pH and electrical conductivity with increasing pyrolysis may be due to greater degree of volatilization, which promotes the loss of acidic functional groups and concentrates the alkaline salts in the biochar ash fraction (Gai et al., 2014; Suliman et al., 2016). In this study it was observed that the high-density feedstock, with greater ash content and inorganic composition, produced biochars with greater composition of ash and inorganic content relative to low density feedstock at the two different temperatures (300°C and 700°C). Therefore, feedstock composition may influence these properties in resulting biochar.
The pH of biochar has agronomic importance since it has been reported to range between 3.1 and 12 (Suliman et al., 2016). In this study, the biochars pH ranged from acidic (4.75) to alkaline (9.45). Also, the same feedstock can produce biochar that is acidic or alkaline by altering pyrolysis temperature. Alkaline biochar has potential for remediating acidic soils (Ok et al., 2015). Biochar with a higher pH value was incorporated into soil with lower pH it became less acidic (Rawat et al., 2019).
Similarly, high electrical conductivity is an indication of high soluble salt content, and when this biochar is incorporated into soil, especially at a high application rate, it may have agronomic implications. The soil implication may include nitrification, denitrification, organic matter decomposition, respiration, flocculation and generally plant growth (Ok et al., 2015). The foregoing example emphasise the importance of characterizing biochar to understand its fitness for purpose, and demonstrate how knowledge of the feedstock composition and pyrolysis temperature can be utilized to produce biochar with intended properties for a desired application.
Biochar Yield
Two-way ANOVA was used to investigate any main effect interactions. The yield of any one feedstock is dependent on temperature, and the yield at any temperature is dependent on feedstock. Thus, both the density of the sawdust and pyrolysis temperature can affect the yield of the resulting biochar. Therefore, it can be inferred that biochar yield can be optimized by feedstock selection and pyrolysis temperature. Further, the yields of the four prototypes of biochars are statistically different (p< 0.05) and for each investigated group of feedstocks (low density and high density) in this study, biochar yield decreased as the pyrolysis temperature increased (see Figure 3).
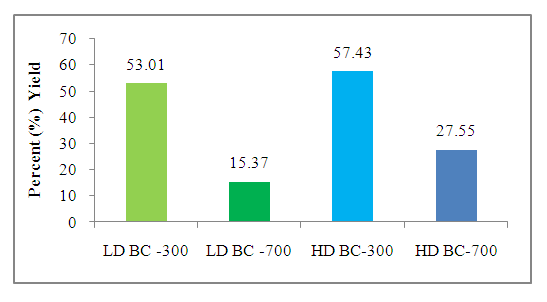
Figure 3. % Yield of the Four Prototypes of Biochar
The lower yields at the higher temperature can be attributed to the greater degree of thermochemical decomposition of the feedstock components such as cellulose and hemicellulose as well as further reaction of the solid residue (organic material) during pyrolysis (Al-Wabel et al., 2013). The decrease in yield with increasing pyrolysis temperature is also reported by other researchers. Ronsse et al. (2013) reported a decrease from 43.7% to 22.7% yield in biochar produced from wood at 300°C and 750°C. Domingues et al. (2017) reported a decreased from 42.5% to 28.2% yield in biochar produced from Eucalyptus sawdust at 350°C and 750°C. In this study, it was also observed that apart from temperature, the yield also varied with feedstock. The high-density sawdust produced higher biochar yield at the two temperatures compared to low density sawdust. This can be as a result of difference in chemical and structural composition, mainly the carbohydrates (hemicelluloses and cellulose) and lignin of the two lignocellulosic biomasses. Each of these chemical polymers has a different temperature range at which they decompose. Hemicelluloses are degraded at 200°C to 260°C, while cellulose at 240°C to 350°C and lignin at 280°C to 500°C (O'Laughlin & McElligott, 2009). Wang et al. (2015) reported higher lignin biomass is known to enhance carbonization and facilitate higher biochar production rate. Hence, it can be hypothesised that the high density sawdust has higher lignin content relative to the low density sawdust. In fact, the proximate analysis of the two biomasses in this study revealed that the high-density sawdust has greater fixed carbon content which is correlated to greater lignin content. Liang et al. (2021) concluded that biomass with greater proportion of hemicellulose and cellulose promotes the formation of tar, while biomass with greater amount of lignin facilitates the formation of biochar during slow pyrolysis.

5. Conclusions

There were statistically significant differences between the physicochemical properties of the two types of sawdust feedstock in this study. Both pyrolysis temperature and feedstock origin affect the yield of biochar. Further, it was inferred that lower temperature and higher density were predictors of higher yield. There were statistically significant differences between the physicochemical properties of biochars produced from the two types of sawdust feedstock under the two different pyrolysis temperatures specifically volatile matter, fixed carbon, ash, selected total and exchangeable elements, pH and conductivity.
These findings hold significant implications for the optimization of biochar production processes. By understanding the influence of pyrolysis temperature and feedstock density on yield, biochar producers can make informed decisions to enhance biochar production efficiency. Moreover, the observed variations in biochar properties across different feedstocks and pyrolysis conditions open avenues for tailoring biochars to specific applications in agriculture, environmental remediation, or carbon sequestration.
Although this study provides valuable insights, future research could look deeper into the effects of additional factors, such as heating rate and residence time on biochar yield and properties. Exploring the optimization of biochar production under varying conditions and assessing its performance in practical applications would contribute to a more comprehensive understanding of this versatile material.
This study significantly advances our understanding of biochar production by exploring the roles of pyrolysis temperature and feedstock density in biochar yield and properties. The identified predictors of yield provide valuable guidance to the agro-industry, while the observed variations in biochar characteristics underscore its versatility for tailored applications. By bridging these knowledge gaps, this research contributes to the ongoing development of sustainable biochar-based solutions.

ACKNOWLEDGEMENTS

Above all, the Almighty God receives the highest appreciation and acknowledgment for sparing life and for providing the energy, time and wisdom to complete this research. Thank you to the numerous persons who assisted in this research. Special thanks the Government Analysis Food and Drug Department (GA-FDD) and the Guyana Sugar Corporation (GUYSUCO) Central Laboratory for giving the opportunity to utilize their laboratory to complete this research in the midst of a global pandemic. Greatest appreciation to the Department of Chemistry, University of Guyana for use of the laboratory and all its equipment and reagents.

References

[1]  Abdul Hayee, M. (2012). Characterization and utilization of agroforestryresidues as energy source in Brazil.
[2]  Acquah, G. E., Via, B. K., Fasina, O. O., Adhikari, S., Billor, N., & Eckhardt, L. G. (2017). Chemometric modeling of thermogravimetric data for the compositional analysis of forest biomass. PloS one, 12(3), e0172999.
[3]  Adeyemi, T., & Idowu, O. (2017). Biochar: promoting crop yield, improving soil fertility, mitigating climate change and restoring polluted soils. World News of Natural Sciences(8), 27-36.
[4]  Al-Wabel, M. I., Al-Omran, A., El-Naggar, A. H., Nadeem, M., & Usman, A. R. (2013). Pyrolysis temperature induced changes in characteristics and chemical composition of biochar produced from conocarpus wastes. Bioresource technology, 131, 374-379.
[5]  Aller, D., Bakshi, S., & Laird, D. A. (2017). Modified method for proximate analysis of biochars. Journal of analytical and applied pyrolysis, 124, 335-342.
[6]  Bandara, T., Herath, I., Kumarathilaka, P., Hseu, Z.-Y., Ok, Y. S., & Vithanage, M. (2017). Efficacy of woody biomass and biochar for alleviating heavy metal bioavailability in serpentine soil. Environmental geochemistry and health, 39, 391-401.
[7]  Budai, A., Zimmerman, A., Cowie, A., Webber, J., Singh, B., Glaser, B., . . . Lehmann, J. (2013). Biochar Carbon Stability Test Method: An assessment of methods to determine biochar carbon stability. International biochar initiative, 20.
[8]  Cantrell, K. B., Hunt, P. G., Uchimiya, M., Novak, J. M., & Ro, K. S. (2012). Impact of pyrolysis temperature and manure source on physicochemical characteristics of biochar. Bioresource technology, 107, 419-428.
[9]  Chen, J., Wang, P., Ding, L., Yu, T., Leng, S., Chen, J., . . . Li, J. (2021). The comparison study of multiple biochar stability assessment methods. Journal of analytical and applied pyrolysis, 156, 105070.
[10]  Crombie, K., Mašek, O., Sohi, S. P., Brownsort, P., & Cross, A. (2013). The effect of pyrolysis conditions on biochar stability as determined by three methods. Gcb Bioenergy, 5(2), 122-131.
[11]  Definition, P. (2015). Specification Standards: Standardized Product Defini-tion and Product Testing Guidelines for Biochar That Is Used in Soil (aka IBI Biochar Standards): Version.
[12]  Di Stasi, C., Greco, G., Canevesi, R. L., Izquierdo, M. T., Fierro, V., Celzard, A., . . . Manyà, J. J. (2021). Influence of activation conditions on textural properties and performance of activated biochars for pyrolysis vapors upgrading. Fuel, 289, 119759.
[13]  Domingues, R. R., Trugilho, P. F., Silva, C. A., Melo, I. C. N. d., Melo, L. C., Magriotis, Z. M., & Sanchez-Monedero, M. A. (2017). Properties of biochar derived from wood and high-nutrient biomasses with the aim of agronomic and environmental benefits. PloS one, 12(5), e0176884.
[14]  Duku, M. H., Gu, S., & Hagan, E. B. (2011). Biochar production potential in Ghana—A review. Renewable and Sustainable Energy Reviews, 15(8), 3539-3551. doi:https://doi.org/10.1016/j.rser.2011.05.010
[15]  Gai, X., Wang, H., Liu, J., Zhai, L., Liu, S., Ren, T., & Liu, H. (2014). Effects of feedstock and pyrolysis temperature on biochar adsorption of ammonium and nitrate. PloS one, 9(12), e113888.
[16]  Gérard, J., Paradis, S., & Thibaut, B. (2019). Survey on the chemical composition of several tropical wood species. Bois et Forêts des Tropiques, 342.
[17]  Hu, Q., Shao, J., Yang, H., Yao, D., Wang, X., & Chen, H. (2015). Effects of binders on the properties of bio-char pellets. Applied Energy, 157, 508-516.
[18]  Initiatve, I. B. (2015). Standardized Product Definition and Product Testing Guidelines for Biochar That is Used in Soil.
[19]  Ippolito, J. A., Cui, L., Kammann, C., Wrage-Mönnig, N., Estavillo, J. M., Fuertes-Mendizabal, T., . . . Spokas, K. (2020). Feedstock choice, pyrolysis temperature and type influence biochar characteristics: a comprehensive meta-data analysis review. Biochar, 2, 421-438.
[20]  Klasson, K. T. (2017). Biochar characterization and a method for estimating biochar quality from proximate analysis results. Biomass and Bioenergy, 96, 50-58.
[21]  Lehmann, J., & Joseph, S. (2015). Biochar for environmental management: an introduction Biochar for environmental management (pp. 1-13): Routledge.
[22]  Leng, L., Huang, H., Li, H., Li, J., & Zhou, W. (2019). Biochar stability assessment methods: a review. Science of The Total Environment, 647, 210-222.
[23]  Li, S., Harris, S., Anandhi, A., & Chen, G. (2019). Predicting biochar properties and functions based on feedstock and pyrolysis temperature: A review and data syntheses. Journal of Cleaner Production, 215, 890-902.
[24]  Liang, L., Xi, F., Tan, W., Meng, X., Hu, B., & Wang, X. (2021). Review of organic and inorganic pollutants removal by biochar and biochar-based composites. Biochar, 3, 255-281.
[25]  Maaz, T. M., Hockaday, W. C., & Deenik, J. L. (2021). Biochar volatile matter and feedstock effects on soil nitrogen mineralization and soil fungal colonization. Sustainability, 13(4), 2018.
[26]  Meyer, S., Genesio, L., Vogel, I., Schmidt, H.-P., Soja, G., Someus, E., . . . Glaser, B. (2017). Biochar standardization and legislation harmonization. Journal of Environmental Engineering and Landscape Management, 25(2), 175-191.
[27]  Mukome, F. N., Zhang, X., Silva, L. C., Six, J., & Parikh, S. J. (2013). Use of chemical and physical characteristics to investigate trends in biochar feedstocks. Journal of agricultural and food chemistry, 61(9), 2196-2204.
[28]  Muradov, N., Fidalgo, B., Gujar, A. C., Garceau, N., & Ali, T. (2012). Production and characterization of Lemna minor bio-char and its catalytic application for biogas reforming. Biomass and Bioenergy, 42, 123-131.
[29]  O'Laughlin, J., & McElligott, K. (2009). Biochar for environmental management: science and technology, Johannes Lehmann, Stephen M. Joseph (Eds.), Earthscan, London UK (2009), 448 p: Elsevier.
[30]  Ogunsola, O., Adeleke, O., & Aruna, A. (2018). Wood fuel analysis of some selected wood species within Ibadan. Paper presented at the IOP Conference Series: Earth and Environmental Science.
[31]  Ok, Y. S., Uchimiya, S. M., Chang, S. X., & Bolan, N. (2015). Biochar: Production, characterization, and applications: CRC press.
[32]  Quilliam, R. S., Glanville, H. C., Wade, S. C., & Jones, D. L. (2013). Life in the ‘charosphere’–Does biochar in agricultural soil provide a significant habitat for microorganisms? Soil Biology and Biochemistry, 65, 287-293.
[33]  Rawat, J., Saxena, J., & Sanwal, P. (2019). Biochar: a sustainable approach for improving plant growth and soil properties. Biochar-an imperative amendment for soil and the environment, 1-17.
[34]  Roberts, K. G., Gloy, B. A., Joseph, S., Scott, N. R., & Lehmann, J. (2010). Life cycle assessment of biochar systems: estimating the energetic, economic, and climate change potential. Environmental science & technology, 44(2), 827-833.
[35]  Ronsse, F., Van Hecke, S., Dickinson, D., & Prins, W. (2013). Production and characterization of slow pyrolysis biochar: influence of feedstock type and pyrolysis conditions. Gcb Bioenergy, 5(2), 104-115.
[36]  Saletnik, B., Zagula, G., Bajcar, M., Czernicka, M., & Puchalski, C. (2018). Biochar and biomass ash as a soil ameliorant: The effect on selected soil properties and yield of giant miscanthus (Miscanthus x giganteus). Energies, 11(10), 2535.
[37]  Shackley, S., Carter, S., Sims, K., & Sohi, S. (2011). Expert perceptions of the role of biochar as a carbon abatement option with ancillary agronomic and soil-related benefits. Energy & environment, 22(3), 167-187.
[38]  Singh, B., Camps-Arbestain, M., & Lehmann, J. (2017). Biochar: a guide to analytical methods: Csiro Publishing.
[39]  Spokas, K. A. (2010). Review of the stability of biochar in soils: predictability of O: C molar ratios. Carbon management, 1(2), 289-303.
[40]  Suliman, W., Harsh, J. B., Abu-Lail, N. I., Fortuna, A.-M., Dallmeyer, I., & Garcia-Perez, M. (2016). Influence of feedstock source and pyrolysis temperature on biochar bulk and surface properties. Biomass and Bioenergy, 84, 37-48.
[41]  Tag, A. T., Duman, G., Ucar, S., & Yanik, J. (2016). Effects of feedstock type and pyrolysis temperature on potential applications of biochar. Journal of analytical and applied pyrolysis, 120, 200-206.
[42]  Tomczyk, A., Sokołowska, Z., & Boguta, P. (2020). Biochar physicochemical properties: pyrolysis temperature and feedstock kind effects. Reviews in Environmental Science and Bio/Technology, 19, 191-215.
[43]  Verheijen, F., Jeffery, S., Bastos, A., Van der Velde, M., & Diafas, I. (2010). Biochar application to soils. A critical scientific review of effects on soil properties, processes, and functions. EUR, 24099(162), 2183-2207.
[44]  Waliszewska, B., Mleczek, M., Zborowska, M., Goliński, P., Rutkowski, P., & Szentner, K. (2019). Changes in the chemical composition and the structure of cellulose and lignin in elm wood exposed to various forms of arsenic. Cellulose, 26, 6303-6315.
[45]  Wang, S., Gao, B., Zimmerman, A. R., Li, Y., Ma, L., Harris, W. G., & Migliaccio, K. W. (2015). Physicochemical and sorptive properties of biochars derived from woody and herbaceous biomass. Chemosphere, 134, 257-262.
[46]  Zajac, G., Szyszlak-Bargłowicz, J., Gołebiowski, W., & Szczepanik, M. (2018). Chemical Characteristics of Biomass Ashes. Energies. 11 (11): 2-15.
[47]  Zhang, H., Chen, C., Gray, E. M., & Boyd, S. E. (2017). Effect of feedstock and pyrolysis temperature on properties of biochar governing end use efficacy. Biomass and Bioenergy, 105, 136-146.
[48]  Zhang, X., Wang, H., He, L., Lu, K., Sarmah, A., Li, J., . . . Huang, H. (2013). Using biochar for remediation of soils contaminated with heavy metals and organic pollutants. Environmental Science and Pollution Research, 20, 8472-8483.
[49]  Zhao, S.-X., Ta, N., & Wang, X.-D. (2017). Effect of temperature on the structural and physicochemical properties of biochar with apple tree branches as feedstock material. Energies, 10(9), 1293.