-
Paper Information
- Paper Submission
-
Journal Information
- About This Journal
- Editorial Board
- Current Issue
- Archive
- Author Guidelines
- Contact Us
World Environment
p-ISSN: 2163-1573 e-ISSN: 2163-1581
2022; 12(1): 4-16
doi:10.5923/j.env.20221201.02
Received: Jul. 3, 2021; Accepted: Jul. 22, 2022; Published: Jul. 27, 2022

Analysis of the Impacts of Population Growth and Land Use Changes on Water Resources in River Kuja Basin, Kenya
 Abstract
 Reference
 Full-Text PDF
 Full-text HTML
Vincent Ogembo, Lorna Grace Okotto, Julius Manyalla
School of Spatial Planning & Natural Resource Management, Jaramogi Oginga Odinga University of Science & Technology, Bond, Kenya
Correspondence to: Vincent Ogembo, School of Spatial Planning & Natural Resource Management, Jaramogi Oginga Odinga University of Science & Technology, Bond, Kenya.
| Email: |  |
Copyright © 2022 The Author(s). Published by Scientific & Academic Publishing.
This work is licensed under the Creative Commons Attribution International License (CC BY).
http://creativecommons.org/licenses/by/4.0/

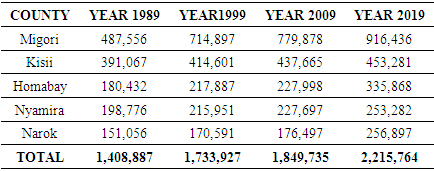
River basins have experienced alterations in their general hydrologic patterns occasioned by the pressure from population growth on land use systems and practices. This has affected natural resources and agricultural activities within the basins. This study sought to analyse the impacts of population increase and land use changes on the water resources of River Kuja basin for the period between the years 1990 to 2020. Population change and growth was analysed based on the decadal census for Kenyan population data from the Kenya Bureau of Statistics. Questionnaires investigating the hydrological and land use changes were administered to a sample population size of 400 households and the data analysed using SPSS software. Land use changes were determined using satellite images analysis for the year 1990 and 2020. The human population in the basin increased from 1,408,887 in 1989 to 2,215,764 in 2019 translating to 57.3% increase with a compounded growth rate of 1.52%. In a survey of 400 households, 75.0% acknowledged land use changes while 78.8% recognized variations in weather and hydrological patterns. 65.6% noted the change in River Kuja flow over the 30 years. Land degradation was a major problem at 95.0% where 48% of households preferred conservation farming to other four measures. The satellite images analysis for the year 1990 and 2020 showed an overall percentage land use land cover change of 82%. The analysis showed surface water resources reduced from 41sq.km to 36sq.km in the three decadal temporal space. This was contributed to by different land use classes pointing mainly to anthropogenic factors as the main cause of the conversion from one class to another. The integration of the population increase, household survey and remote sensing techniques on land use changes revealed that population increase and agricultural expansion stimulated land clearance and human settlement causing land degradation and water resources depletion in the basin. As such, there is a need to design conservation and policy measures to conserve the water resources within the basin.
Keywords: River Kuja Basin, Population growth, Water resource, Hydrology, Respondents, Land use changes
Cite this paper: Vincent Ogembo, Lorna Grace Okotto, Julius Manyalla, Analysis of the Impacts of Population Growth and Land Use Changes on Water Resources in River Kuja Basin, Kenya, World Environment, Vol. 12 No. 1, 2022, pp. 4-16. doi: 10.5923/j.env.20221201.02.
Article Outline
1. Introduction
- Globally, river basins have experienced alterations in their general hydrologic patterns occasioned by the pressure from population growth on land use systems and practices. This has impacted negatively on natural resources and agricultural activities within the basins. The human activities (anthropogenic threats) are activities that could be driven by several factors including population pressure, urbanization, unemployment, or ignorance about the communal role of managing sustainable ecosystem [1]. In the arguments of [2], naturally, any ecosystem requires ecological security in order to function optimally. However, the ecological security could be compromised by anthropogenic processes which interfere with the integrity and health of the ecosystem. According to [3], anthropogenic activities have the potential to alter energy source, cascading system, physical habitat, water quality and biotic relationships). Some of the Anthropogenic activities can cause disturbance of the ecological security of the river basin and the associated watersheds where the process involves are complicated both temporal and spatial scale [4].Most of the anthropogenic activities are those associated with the exploitation of water resources and land use [5]. The process of exploiting the water resources and land use within the water shed and river basin have caused significant changes in the ecosystems of most rivers across the world including River Nile, Songhua, Euphrates, Coloradoand Rhine [6]. [7] identified, evaluated and qualifies 33 potential anthropogenic factors which significantly affect ecological security of river basins. [8] was also able to select 23 factors which he diagnosed as main threats to river basin.Population growth is one of the critical factors affecting long term sustainability at both national and sub-national levels, because it represents a primary indicator for national decision and policy makers. Its significance should therefore at all times be analyzed in relation to other factors which also affects sustainability. That notwithstanding, rapid population growth can add pressure to country’s capacity to handle a wide range of issues of economic, social and environmental significance. This happens when rapid population growth occurs alongside poverty and limited of access to resources, or with unsustainable patterns of food and other basic needs production and consumption, or in ecologically vulnerable zones [9].Although rural populations have generally grown less fast relative to urban populations, the rural growth has been strong in many developing countries in Africa and Asia, and in most of the least developed countries. As was acknowledged by the Commission on Sustainable Development during its 14th conference (E/CN.17/2006/2), protecting and managing the natural resource base is an indispensable requirement for sustainable development. In situations where the policies and initiatives for sustainable agricultural and rural development are not established, high rates of rural population growth could negatively impact on the use of land, water, air, energy and other resources [10].Population growth is often used as a surrogate for changes in land use change, but at lower scales, a set of complex drivers must equally be considered [11]. Population growth implies increasing demand on food and thus more pressure on land resources to sustain the demand (Bongaarts, 2009). In developing countries, rapid population growth, poverty and the economic situation are the main driving forces to land use and land cover changes [12]. The effects of population growth occur mainly through the intensification and intensification of agricultural activities aimed at food production. Different population growth rates and different population densities produce different sets of land use changes depending on the place in question. The evidence is partly logical and historical. More people need more food and more residential land. This factor defines how land is used for agriculture and other purposes. M. Gordon Wolman's paper, which illustrated that land use patterns over the last 6,000 years are associated with the expansion of the human population [13]. This study sought to analyse the impacts of population increase on the hydrology and land use of River Kuja basin for the period between the years 1990 to 2020.
2. Methodology
2.1. Study Area
- The study area was conducted in the South Western parts of Kenya in River Kuja basin. The basin fully covers Migori County and partly covers Nyamira County, Narok County, Kisii County and Homabay County Figure 1. It is located within coordinates 34.883110 -0.996036 and the river has a total running length of 147km. The average altitude of the basin is approximately 2,000m above the sea level. The basin has a population of approximately 2.2 million people and covers an area of 6,900km2 (2,664 sq. mi) [14].
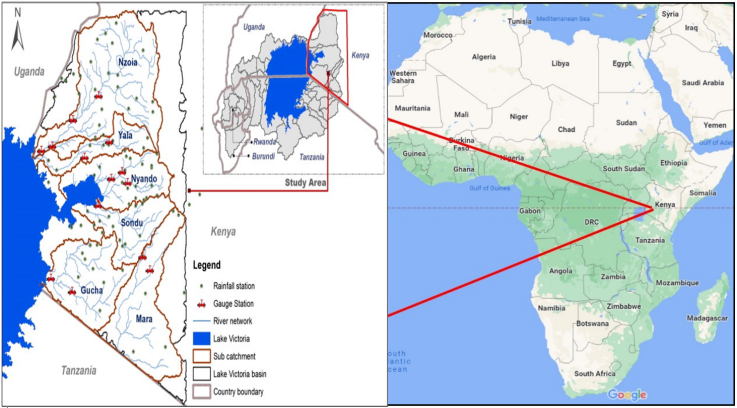 | Figure 1. Map of River Kuja Basin (Source: Gucha-Migori basin IWRM Plan) |
2.2. Study Design
- The study involved sourcing and analysing population data from the Kenya National Bureau of Statistics; the household administration and analysis of questionnaires; and downloading satellite images for land cover changes with the comprehensive application of quantitative and qualitative methods to validate ground observations. Primary and secondary data were collected and applied to the models and the conceptual framework. The primary data was acquired through formal and informal field surveys of randomly identified riparian households, and key informants’ interviews (KII). The secondary data was obtained from literature reviews on studies conducted on the research topic. The sources included published books, articles, journals, reports, and existing maps.
2.3. Human Population Data
- The basin’s population data was sourced from the population censuses conducted by the Kenya National Bureau of Statistics (KNBS) for the years 1999 and 2009 and 2019. The data obtained included the human demographic parameters and sizes across the study area as per the administrative units. The 1999 and 2009 population census data was analyzed based on Districts administrative boundaries while the 2019 census data was analyzed based on County and Sub-county administrative units. The resulting data were tabulated in Excel 2016 worksheet for analysis and synthesis.
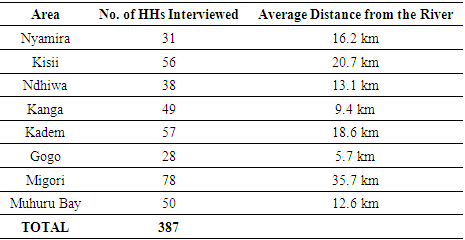
2.4. Sampling Design and Frame
- The study involved administering a designed questionnaire to 30 households as a pretest population sample followed by actual data collection of 400 households across the three counties within the basin. Yamane’s Sample Size Formula from Kuja basin’s population of 2.5 million people determined the population sample size of 400 households. The formula is applicable in determining survey sample size of high population numbers like in the case of Kuja basin.
 | (1) |
 | (2) |
|
2.5. Socio-ecological Data
- An initial ground survey and observation was conducted to familiarize with regions, administrative boundaries and geographic features of interest. The exercise focused on homesteads near the river at sampled regions, crop cover types, sugar factories, Gogo hydropower dam and River Kuja confluence into Lake Victoria. A pretest survey was done to specifically explore the targeted population sample of the basin. Questionnaires designed for the overall survey were pretested on a sample size of 30 households randomly selected across the sampled villages in Kisii County, Homabay County and Migori County. The pretest sample size was dictated by the minimum required household number of 30 households. This is the standard pretest population sample size by the statistical methods and softwares under normal conditions (Fabrigar, Wegener, MacCallum & Strahan, 1999). The data was collected and analysed where the results helped in improving and refining the questionnaires by correcting ambiguous questions, incorporating more information, and removing irrelevant sections. The actual data collection after pretest sampling involved questionnaire administration and observations. The household surveys using questionnaires covered approximately 400 households. A sample questionnaire is attached in the Annex I herein. Those who were surveyed during the pretest process were excluded from the main survey. Secondary data were sourced to give background information on physical and soci0-ecological aspects of the study area. The survey was aimed at providing perceptional and factual occurrences and information on the ecological changes and aspects in the basin [16]. Independent verification of information generated by the questionnaires was carried out by involving key informants and participants observations. The findings were analysed using SPSS software and results presented and discussed. The resulting information is essential in generating a plan on how water resources in the basin should be sustainably utilized under the growing population in River Kuja basin.
2.6. Questionnaire Administration
- A questionnaire was administered to the targeted respondents across the basin under study. After identifying a respondent in a household, an amicable environment was created for further engagement during the interview. This was achieved by first giving a clear introduction and explaining the purpose of the research thereafter seeking permission from the respondent. The researcher administered the questionnaires in a language the respondent could easily understand and speak. In cases of a language barrier, the researcher engaged an interpreter or translator. Answers were recorded concurrently as the interview continued. The interaction continued throughout to ensure all questions were answered and the recording was completed before the researcher left.For the households whose heads were literate and were willing to fill the questionnaires by themselves, the researcher allowed them to do so under his supervision and guidance. After the respondent was done, the data provided were cross-checked and any further clarifications were sought in case some information filled was not clear to the researcher. At the end field survey, all the questionnaires were serialized, safely stacked together, and transported to the analysis center awaiting processing and analysis.
2.7. Key Informants Interviews
- Key informants’ interviews were carried out to obtain data from stakeholders such as government officials, community-based organizations, farmers associations, and community settlements. Highly prioritized respondents were selected from some regions and extensively interviewed for full historic accounts of the socio-ecological factors of the basin. The questions were open-ended hence prompting uninterrupted explanations relevant to the field of research. The information gathered was triangulated by the primary and secondary data obtained from household surveys. This was relevant to authenticate other sources of information acquired in order to understand the hydrodynamics of the basin.
2.8. Land Use Land Cover Change
- Methods employed to achieve the desired objective of land use land cover mapping for river Kuja entailed a couple of sequential steps; Data acquisition, Data processing, Training Data collection, Image classification, Accuracy assessment and Change detection. The data used on Spatio-temporal changes on land use land cover included a thirty-year decadal satellite images 1990 and 2020, Digital Elevation Model (DEM) of resolution 30m x 30m, soils in the basin, field surveys data and basin shapefile. The study area was first delineated using DEM data and river shapefile. It was measured by acquiring remotely sensed satellite images of River Kuja basin and ground truthing processes. Reference data was collected from the field in order to understand and correlate the satellite image features with study area features. The training sites were selected randomly based on observable features and information like government reports and vegetation maps were also collected during the field reconnaissance. The images were captured over different times and compared while considering different temporal phenomena like water bodies, agriculture, forests, shrub land, urban areas and grassland. The different classes were analyzed and results presented and discussed.
2.9. Population Data Processing and Analysis
- Population data was imported into the Excel 2016 worksheet and an analysis was conducted to determine the changes leading to growth. The population growth rate was calculated using the compound rate of growth method in order to determine population projections as shown in Equation 3 below;
 | (3) |
 | (4) |
2.10. Socio-ecological Data Processing and Analysis
- The questionnaires were duly completed and serialized for ease of identification. During the process, some 13 questionnaires were excluded from data entry due to inadequate information provided by the respondents. Coding of the sheets from the first to the last assisted in linking the information from the data to ideas in all cases in the database. For the dichotomous responses of yes or no, values of either 1 or 0 were assigned whereas for ordinal and explanatory data of low, medium, or high, values of 1, 2, 3, onwards were assigned. The data were thereafter entered into Microsoft Office Excel 2016 worksheet and SPSS software for analysis. The data was cleaned to achieve quality and be fit for use by managing errors for improved documentation and presentation. The cleaning process included checks such as, completeness, format, limit, duplicate, spelling, validity, reasonableness, and review of the data for outliers identification. This entailed excluding rows or characters that were not necessary in the analysis, deciding upon a single coding scheme then converting and replacing values and using logic to manually discover errors and replace or exclude characters.
2.11. Analysis of Population Growth and Water Resources Status in the Basin
- The relationship between population growth and the hydrologic situation in the basin was determined using proportional odds and logistic regression models. The models were fitted to the selected parameters of exploratory variables [17,18]. To understand the relationship of the variables, a correlation analysis was conducted to determine the impact of exploratory variables such as population growth and land-use changes on the dependent variable water resources (hydrology) of the basin.
3. Results
3.1. Characteristics of Human Population in the Basin
- The study interviewed 56.1% male and 43.9% female headed households. In some households, the women were the bread winners and this accounted for only 7% of the sampled population. Majority of the households heads were married (69%), while 23% lost their spouses and 8% were single. The lager number of respondents were 30years and above at 50.2% followed by 20-30yrs at 38.2% and the least being 0-20 years at 11.6%. It was also found that 55.2% of the respondents were native around the Kuja River basin whereas 44.8% are immigrants over the period of 30 years (1990-2020) from other regions. Further a majority of immigrants had stayed in the area for over 11 years representing a 23% of the population in the area with the least immigrant being within 6-10 years with 9.4% of the population.About 15.3% of the respondents completely had no formal education. The number of people who had attained primary education were about 74.4% in total. The secondary school education was attained by 7.1% while 3.2% reached post-secondary, middle level college and university levels (Figure 2).
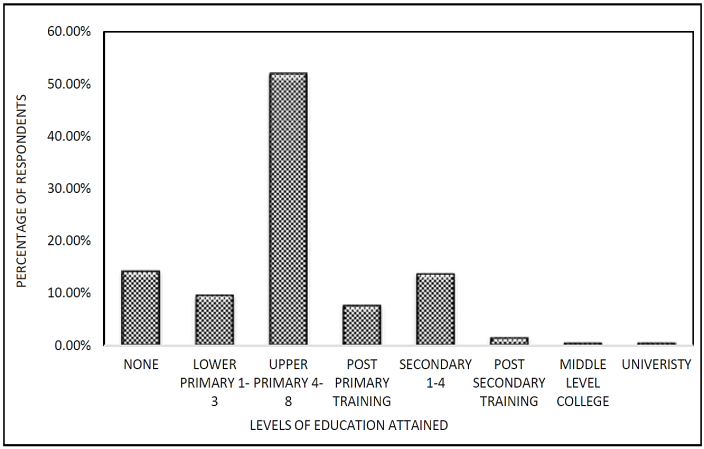 | Figure 2. Education Attainment Levels of the Household Head in River Kuja basin |
3.2. Change in Unit Per Parcel of Land Owned and Change in Land Use
- It was noted that 85.3% of the respondents acknowledged that there was change in the land owned while 14.7% noted no change over the period. The respondents noted that there was a decrease of 60.8% in the size of land parcel where as 10.4% noted an increase in the size of land parcels (Figure 3).
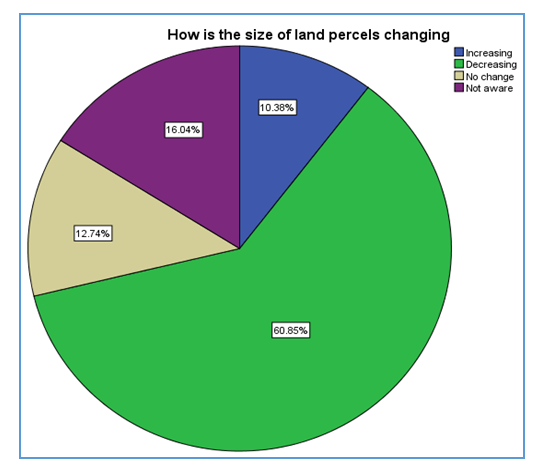 | Figure 3. Change in unit per parcel of lands |
3.3. Human Population Growth
- The human population growth rate per annum over the 30 year period from 1990 to 2020 was estimated at 1.52% (as per Table 3 figures). This was determined by the compounded growth rate formula as below;
 | (5) |
|
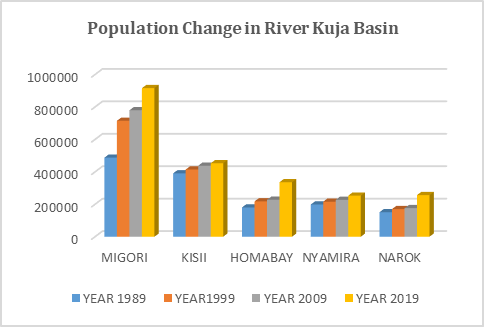 | Figure 4. Population Trends within the portions of Counties under River Kuja basin |
3.4. Changes in Land Use and Land Cover
- 75% of the respondents acknowledged that there was change in land use and cover over the years while 25% of the respondents noted that there was no change or they were not aware of any change in land use and land cover. Among the various changes in land use and land cover, it was evident that the major factor reported at 25% was the natural forest converted to cropland and the least factor being wetlands converted to cropland at 10% (Figure 5).
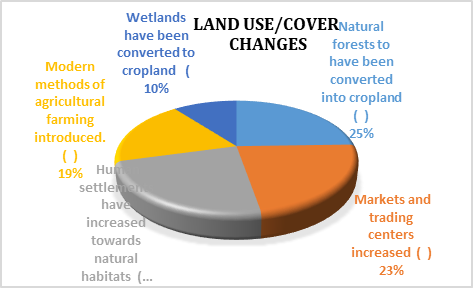 | Figure 5. Interrelationship of Land Use/Cover changes of Kuja basin |
3.5. Water Resources
- 78.8% of the respondents acknowledged that there was a variation in weather conditions for which rain, temperature and windstorm increased over the years whereas the fires reduced over the years. With various water resource problems experienced over the years it was noted that the majority (20%) noted that flooding was the main problem faced with the least at 8% being human-Human conflict. The respondents acknowledged that there were various activities that led to water abstraction in river Kuja Migori with domestic use being the lager activity at 39% and the least of all being industrial use at 12%. 65.6% of the respondents noted that there were changes in the flow of river Kuja Migori as compared to 34.4% of those who did not see any change in the flow of the river over the years. Further looking into the trends of the river flow it is evident that there is an increase change in trend as the years goes by with the highest change in increased trend noted within <10 years ago at 53% and the lowest being 20-30 years ago at 15%.
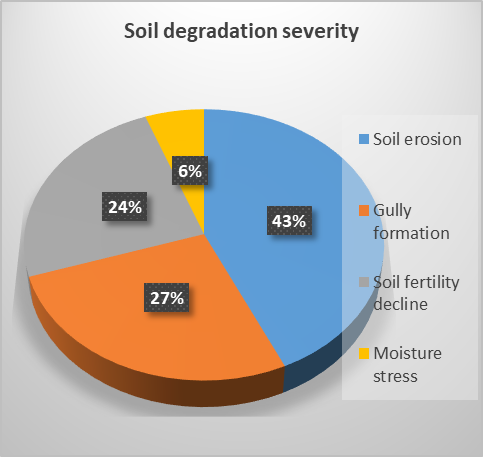
3.6. Land Management and Degradation
- Over the years land degradation has been noted with 95.8% acknowledging it with the most affected activity being crop-rain-fed at 63% and the least affected activity being shrub-land at 1% (Figure 6). Soil degradation has been a key factor in the area with soil erosion being prominent at 43% over the years with the least being moisture strength at 6%. Looking at Land and Water management practices along river Kuja Migori 48% of the respondent’s preferred conservation farming as a method of land and water management as compared to other methods with installing of water tanks being the least method at 3%.
 | Figure 6. Soil degradation severity of the basin |
3.7. Land Use Land Cover Changes by Remote Sensing Techniques
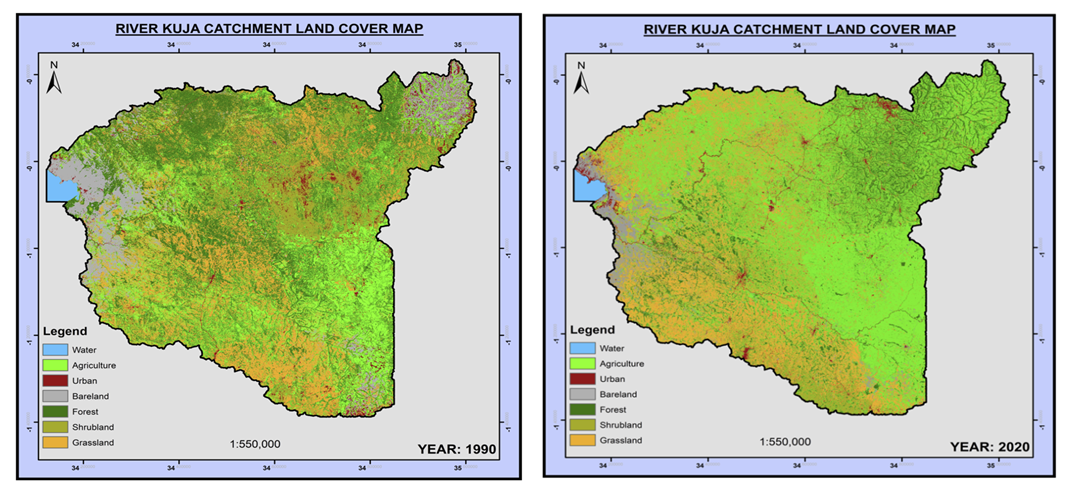 | Figure 7. Land Use Land Cover in the year 1990 and 2020 |
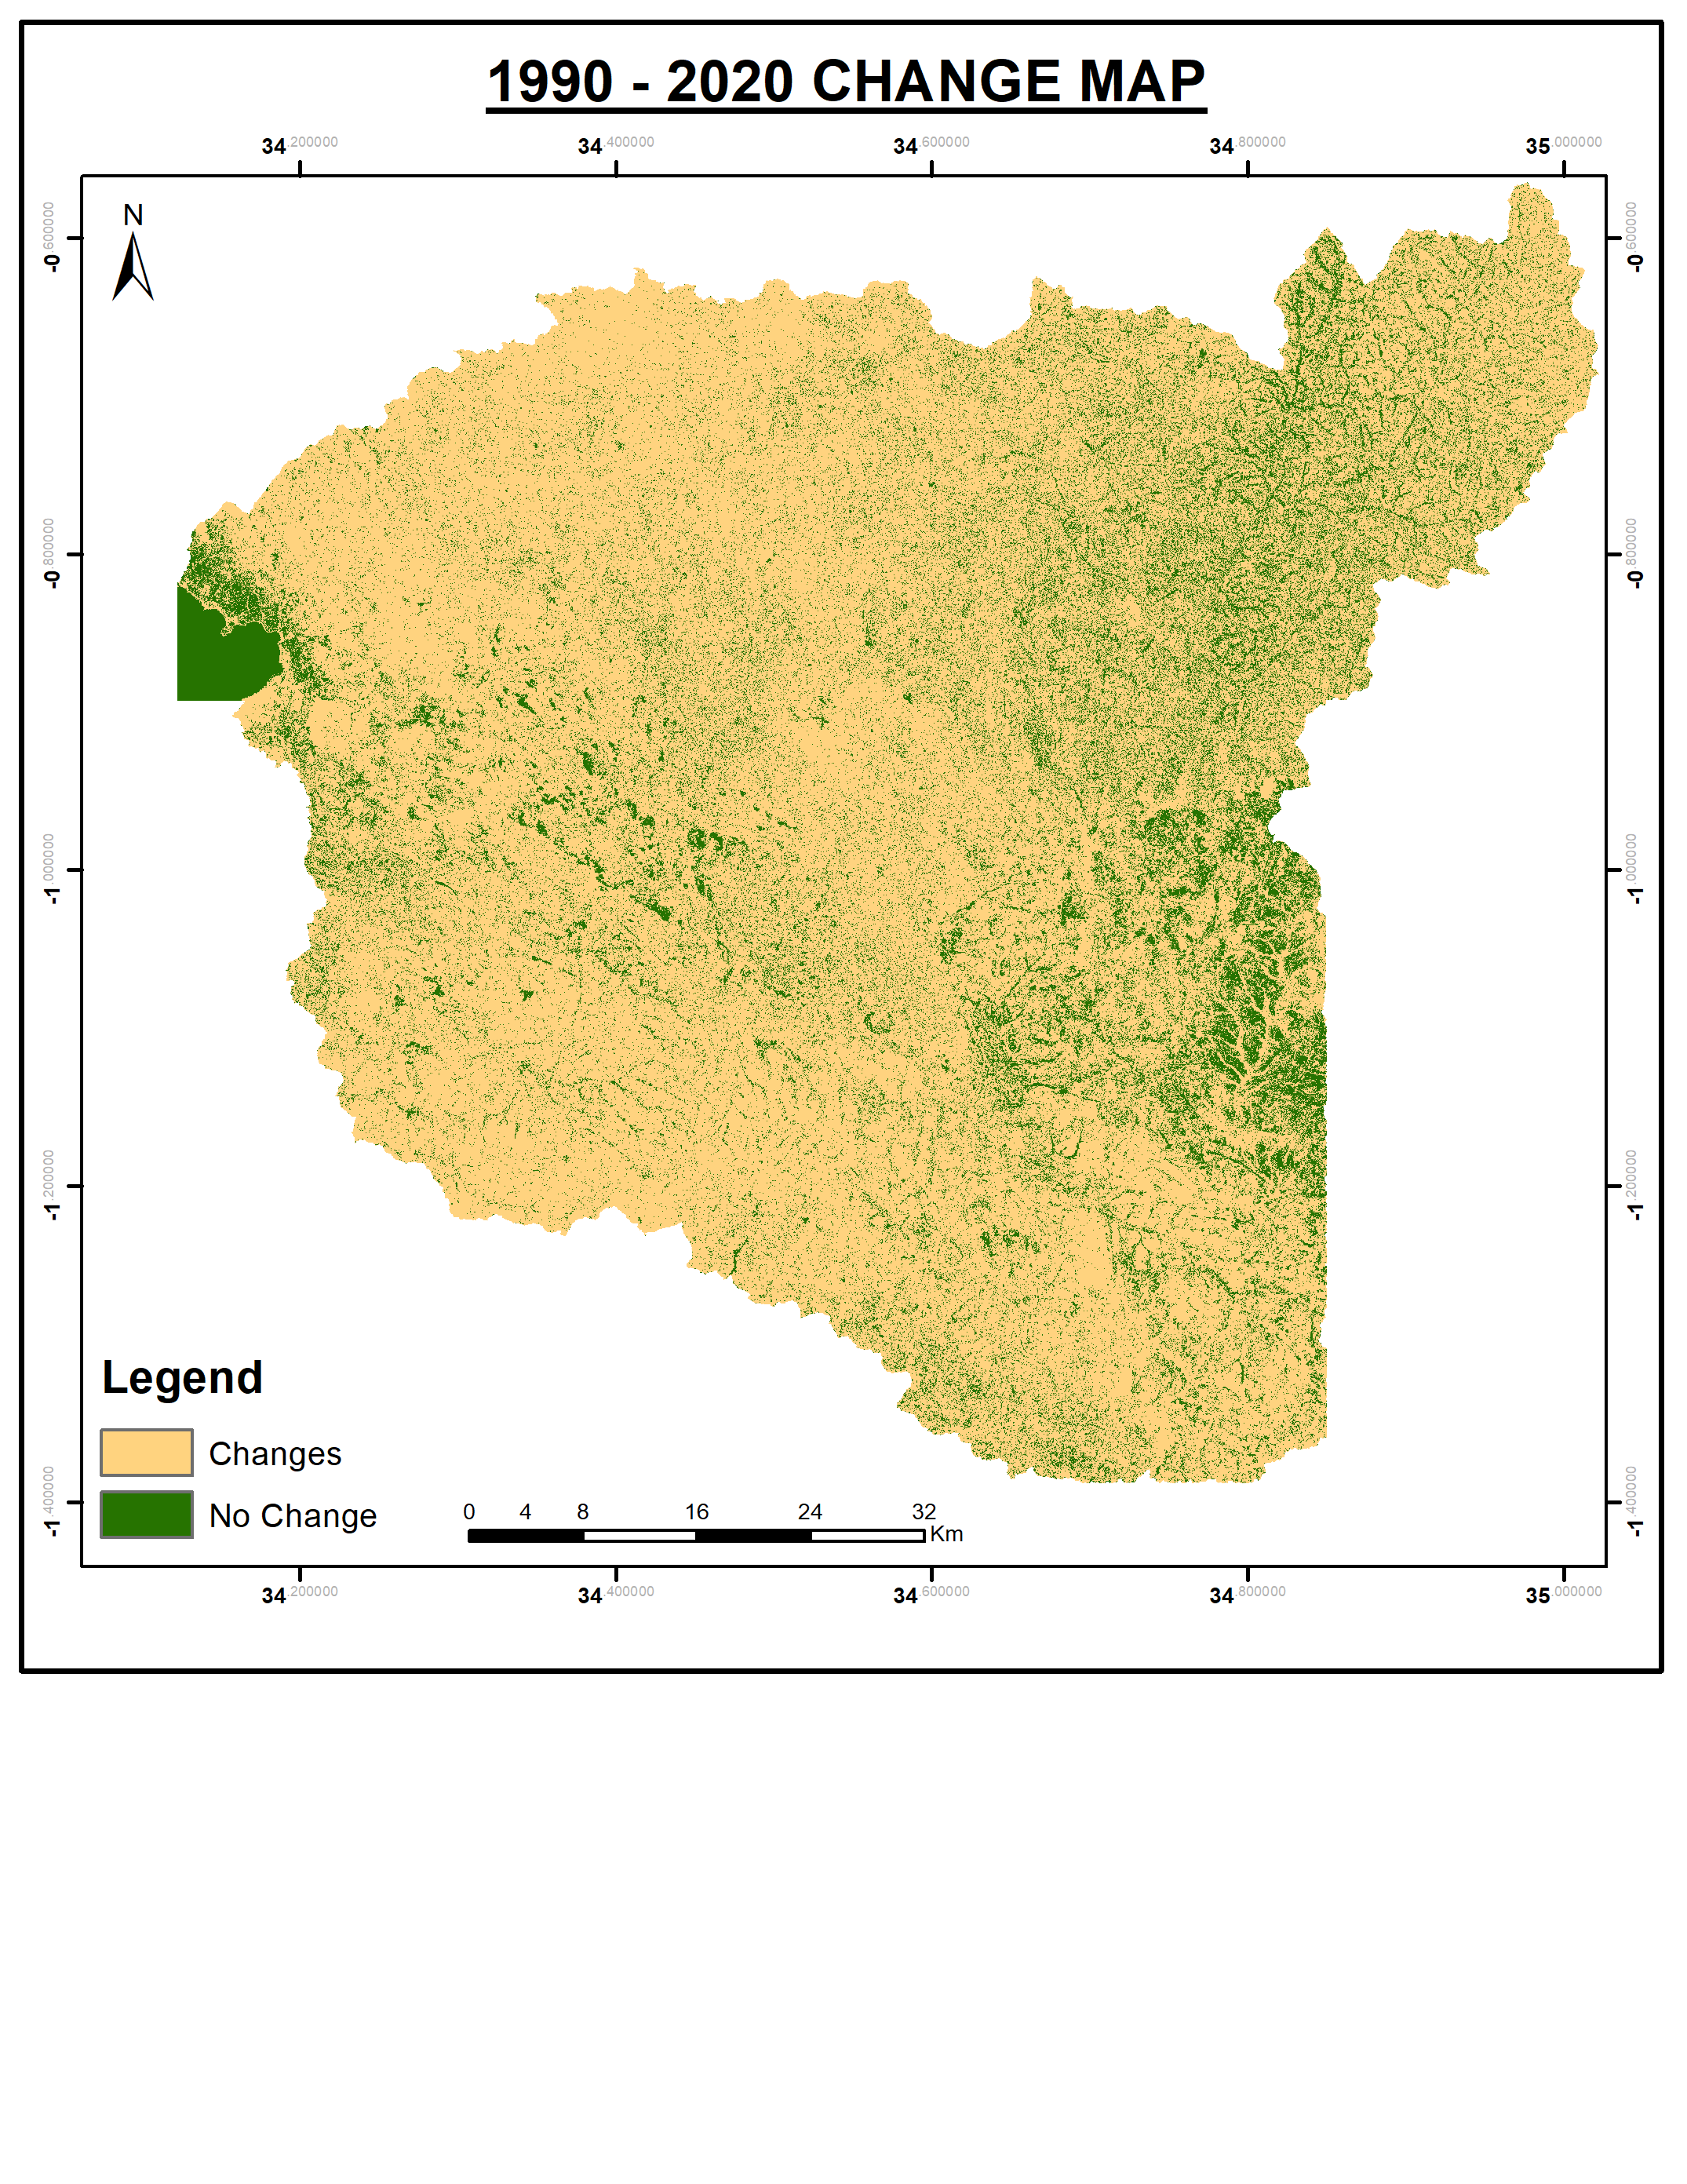 | Figure 8. Land Use Land Cover Changes between 1990 and 2020 |
3.8. Integration of Population Increase, Household Survey and Land Use Changes Analysis
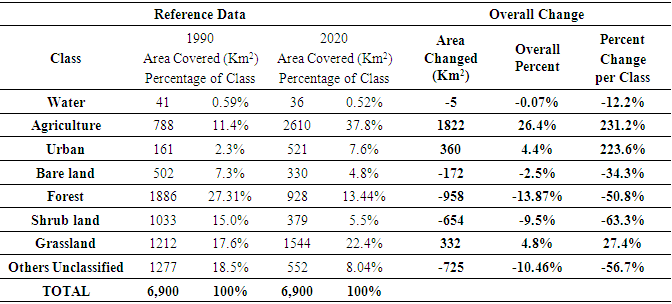
- The land use land cover classification identifies seven land use classes which included; water bodies (rivers, ponds and dams); Agriculture (cropland, farming, arable land); urban (residential, commercial, roads, industrial, recreational areas and institutions); bareland (without structures or vegetation); forests (trees dominated areas); shrub land (shrubs, herbs and ngeophytes); grassland (grass cover). The rest of any land feature were categorized as others during analysis. The year 1990 was the baseline time for the decadal satellite images analysis process. The image showed that agriculture occupied 11.4% with an area of 788 sq.km while water 0.59% with an area of 41 sq.km. Forests covered the greatest area of River Kuja basin followed by grassland and shrub land (Figure 7). The high forest cover was attributed to the fact that some areas within the basin had not been opened for agriculture and urbanization hence remained under indigenous forest cover. The overall vegetative cover in the basin added up to 4,920.39sq.km. This translated to 71.31% of the total basin area. Urban areas covered an area of 161sq.km which translates to 2.3% of the land. The urbanized area include residents, industrial spaces, commercial areas, road networks and road facilities.In the year 2020 classification temporal space, water bodies reduced to 36sq.km while agriculture shot up to 2610sq.km occupying 37.8% of the entire River Kuja basin area (Figure 7 and Table 3). Urban area of coverage constantly increased to 521sq.km. Forests have also reduced significantly to 928sq.km translating to 13.44% basin coverage. The overall accuracy in the classification was 87% while overall Kappa accuracy analysis was at 88%.
|
4. Discussion
- Population growth has a direct impact on River Kuja basin water resources. By the year 2020, the basin had a population density of 321 persons per square kilometer compared to 1990 when it was 204 persons per square kilometer. The increase of 117 people per unit area of land heightened land use dynamics. The survey results of this study demonstrate that the basin experienced hydrological alterations and changes in the land use systems over the thirty years study period. Key issues affecting the basin included increased flooding during rainy seasons, land degradation (both physical and chemical) and general water shortage for both domestic and agricultural use. Both the natural forests and wetlands were converted to cropland in order to attain food security towards the increasing population. Results show that soil erosion is prominent at 43% among the factors causing land degradation. This has been occasioned by the increased land clearance for agricultural activities. The basin is hub for sugarcane production. Over the last three decades, four sugar factories were installed in the region. Many subsistence farmers changed to large scale sugarcane farming and a result, deforestation, increased road networks, urbanization and immigration sprung up. Coupling these factors with the steady population increase, soil erosion intensified which in turn increased siltation in River Kuja and its tributaries. During heavy storms, runoff easily flows with little vegetative resistance and upon reaching highly silted rivers, flash floods are generated in the basin.The river hydrodynamics were acknowledged by 65.6% of the survey respondents with its severity being experienced in the recent 10 years compared to 20-30 years ago. According to key informants and according to [19], flash floods have been a disaster in the basin claiming human and livestock lives, destroying farmlands and properties, and disrupting transport networks. The lower regions of the river comprises of Rongo, Ndhiwa and Nyatike constituencies. Flood plains hot spots in Nyatike constituency include Nyora, Kabuto, Kimai, Sere, Aeko, Aneko among others which they suffer from riverine floods. During wet seasons, these areas experience flood inundation period of one to two months. The inundation takes a long time because the lower parts of the basin has black cotton soil with high rate of water retention. The key informants in Kuja Basin included Water Resource Authority (WRA), Kenya Forest Service (KFS), Ministry of Agriculture (MOA), National Environmental & Management Authority (NEMA), and Kenya Meteorological Department (KMD). The interviews that were conducted to the representatives from these institutions provided information on the environmental and climatic changes within the basin. It was noted that there had been population increase in the basin which in turn fostered anthropogenic activities. The basin suffers severe flash floods and river outbursts during rainstorms. The land surface has been exposed to degradation by factors such as; deforestation for cultivation, urbanization, human settlement, prolonged droughts and soil erosion. They asserted that the public needs capacity building and awareness on sustainable land management techniques. Consequently, the basin’s water resources are gradually declining with several natural springs, ponds, streams and dams drying up during dry seasons. The analysis of satellite images with reference to the respondents experience in the basin for the past thirty years show that the entire basin experienced overall land use land cover change over the past 30 years (Figure 8). More of forests, shrub land and bare land were converted to cultivated agriculture and infrastructural development. This has exposed the soil surface and reduced indigenous land cover hence resulting to hydrological alterations Recharge of water resources like rivers, springs, tributaries, natural ponds, natural dams etc. was affected. During precipitation, excess surface runoff accumulates and flow downstream from tributaries into the river and finally into the lake without reduced resistance. Many water resources are, therefore, exposed to increased evaporation with low ground water recharge thus reduced water bodies’ capacity in the basin [19]. Remote sensing results show that area under agriculture expanded by 231.2% during the period under study. This is explained partly by increasing sugarcane production in the basin as an economic activity. There are three sugar factories that rely on sugarcane production i.e. Sony Sugar, Sukari Industries and Kisii Sugar Factory. Sony sugar factory also called South Nyanza Sugar Factory is located in Awendo Town in Migori County Kenya. It was established in 1979 and currently produces over 60,000metric tons on sugar with a Kenyan market share of 10.14%. Sukari Industries also called Ndhiwa Sugar Factory is located in Ndhiwa Constituency Homabay County, Kenya and started in 2015. The factory produces over 45,000 metric tons of sugar with a market share of 7.12%. There is a relatively new sugar factory, Kisii Sugar Factory located in South Mugirango constituency. It was established in 2016 and is estimated to produce 500 metric tons on sugar per day. Several cash crops are also grown in the region. These included maize, tobacco, rice, coffee, tea, sorghum, millet and cassava. This is likely to be the basis for the increase in area under agriculture.Urban and infrastructural developments increased by 223.6%. This e could also because of the sugar production companies that have resulted into expansion of the market centers, constructed more roads and boosted the general economy in the region where giving the natives opportunity to improve their livelihoods including opening of more businesses. Due to road accessibility, trading activities heightened across the southern parts of Kenya hence the expansion in the towns and market centers. In addition, construction of more schools, hospitals and social amenities accompany such kinds of development. These were further boosted by the Kenyan constitution 2010 adopted also during the period under study that has led to devolution of governance and resources to the county government thus contributing to several infrastructural developments.
5. Conclusions
- The human population in the basin increased from 1,408,887 in 1989 to 2,215,764 in 2019 translating to 57.3% increase with a compounded growth rate of 1.52%. In a survey of 400 households, 75.0% acknowledged land use changes while 78.8% recognized variations in weather and hydrological patterns. 65.6% noted the change in River Kuja flow over the 30 years. Land degradation was a major problem at 95.0% where 48% of households preferred conservation farming to other four measures. The satellite images analysis for the year 1990 and 2020 showed an overall percentage land use land cover change of 82%. This was contributed to by different land use classes pointing mainly to human activities as the main cause of the conversion from one class to another over the three decadal period under study.The study reveals that population increase stimulated expansion of cultivated land and human settlement causing water resources depletion and land degradation in the basin. As such, there is a need to design conservation and policy measures to conserve the water resources within the basin.
Appendix I: Questionnaire on Population Growth, Land Use Land Cover Changes, and Hydrology of River Kuja Basin, Kenya
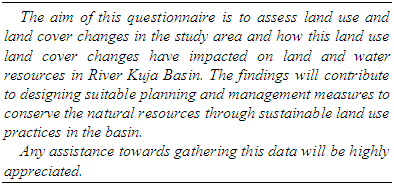
- Questionnaire on Population Growth, Land Use Land Cover Changes, and Hydrology of River Kuja Basin, KenyaIntroduction
 Instructions: Tick as appropriateName of Enumerator ………………………………… Date of Survey…………………Section I Personal details
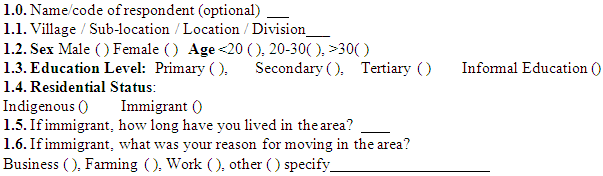 Section II Knowledge of benefits derived by Locals from River Kuja Basin2.0. Do you derive any benefit from River Kuja Basin? Yes ( )
 No ( )2.1. What benefits do you derive from the Basin? Rank in order of importance (5=highest value, 4=very high value, 3=high value, 2=low, 1=very low)
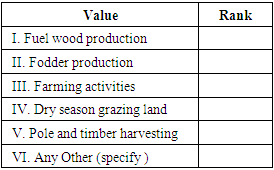 2.2. Are there any restrictions prohibiting locals from deriving benefits from the catchment? Yes ( )
 No ( )2.3. Name those restrictionsI. Fee restrictions ( )II. Permit restrictions ( )III. Seasonal ban ( )IV. Total government ban ( )V. Cultural restrictions ( )VI. Other ( )
  2.4. Are there any problems you face from deriving the benefits from the catchment mentioned above?Yes ( )
 No ( )2.5. Name the ProblemsI. Poaching ( )II. Human-Wildlife conflict ( )III. Human-human conflict ( )IV. Over exploitation of resource ( )V. Others specify
  Section III Land use change, their drivers and impact3.0. Are there any changes in unit per parcel of land owned by households? Yes ( )
 No ( )3.1. If yes, how is the size of land parcels changing among different households?A. Increasing ( )B. Decreasing ( )C. No change ( )D. Not aware ( )3.2. Have you noticed any change in land use and land cover in your locality. Yes ( )
 No ( )3.3. What are the major land use changes that have occurred on Kuja basin since the 1990s in your locality? (Provide qualitative description; +, - & No change)?What major shift in land use occurred?
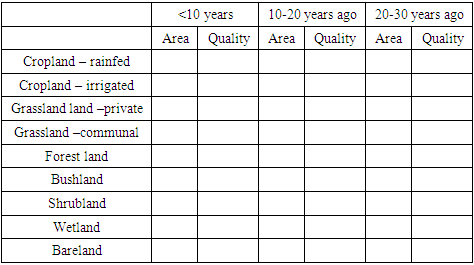 3.3. Please mention the nature of changes.I. Natural forests to have been converted into cropland ( )II. Markets and trading centers increased ( )III. Human settlements have increased towards natural habitats ( ),IV. Modern methods of agricultural farming introduced. ( )V. Wetlands have been converted to cropland ( )3.4. What are the cause of the above-mentioned changes? Please list the causes from the most critical to least important cause. Highest score 5 and lowest 1
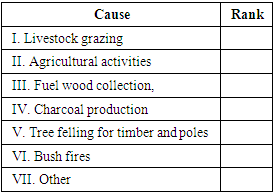 Section IV Climate change related issues4.0. Have you noticed any change in weather patterns? Yes ( )
 No ( ) (specify period)4.1. Please tick the period which changes were observed
 4.2. How has the weather patterns changed over time?
 4.3. Has this weather patterns posed any problems to the livelihood of inhabitants within the catchment? Yes ( )
 No ( )4.4. What has been the nature of the threatsI. Flooding ( )II. Water shortages ( )III. Forage shortages ( )IV. Migrating from lowlands to highlands ( )………………….V.
  4.5. How do you cope with this changes mentioned? Section V Land and Water related issues5.0. What are the major problems associated with water resources in your locality?I. Flooding ( )II. Water abstraction ( )III. Human settlement ( )IV. Water pollution ( )V. Water shortage ( )VI. Human-Wildlife conflict ( )VII. Human-human conflict ( )VIII.
  5.1. Are there any activities involving water abstraction from the Basin? Yes ( )
 N0 ( )5.2. If Yes,
  I. Domestic use ( )II. Livestock watering ( )III. Crop irrigation ( )IV. Industrial use ( )V.
  5.3. Have you noticed changes in the trend of the river flows within River Kuja Basin between 1990 and 2020? Yes ( )
 No ( )5.4. What has been the trend within the different periods below?
 5.5. Is land degradation a problem in your locality? Yes ( )
 No ( )5.6. What type of land cover is vulnerable to land degradation (in order of vulnerability score of 5 (most vulnerable) - 1 (list vulnerable) score)?I. Crop irrigated ( )II. Crop rainfed ( )III. Forest ( )IV. Bushland ( )V. Shrubland ( )VI. Wetland ( )VII. Grassland ( )VIII.
  Provide reason for above
  5.7. What type of Soil degradation is prominent in your area in order of severity 5 most severe, 1-Least severe?I. Soil erosion ( )II. Gully formation ( )III. Soil fertility decline ( )IV. Moisture stress ( )V. Others, specify ( )5.8. How do you evaluate trend of land degradation over?
 1. 1: light; 2: moderate; 3: severe; 4: very severe2. 1: absent; 2: present on vulnerable land units; 3: widespread everywhere3. 1: soil erosion; 2: gully formation; 3: vegetation degradation; 4: soil fertility degradation; 5: water stress; 6: others (specify)5.9. What land and water management practices are present in your locality and which ones are your preferences 5 to 1 (most to least preferred)?I. Conservation farming ( )II. Tree planting ( )III. Installing water tanks ( )IV. Constructing earth dams ( )V.
  5.10. Are there organizations working towards management of various land and water based resources in your locality? Yes ( )
 No ( )5.11. What initiatives are being done to protect the Basin by different organizations? (name them under categories provided)
 5.12. How do you evaluate the efforts made?I. Excellent ( )II. Very good ( )III. Good ( )IV. Poor ( )V. Very Poor ( )5.13. What’s not achieved so far and what could have been done differently?
 5.14. What are the most priority issues in your locality that needs intervention and please suggest ways to address it?I. Land degradation ( )II. Flood control ( )III. Water scarcity ( )IV. Forage shortage ( )V. Resource use conflict ( )VI. Food shortage ( )VII. Poverty ( )VIII.
  Section VI Institutional issues6.0. What are the major factors that affect your decision related to land use or Management in order of importance (+explain)?
 6.1. Describe new practices & regulations that influence land management in your locality at different points in time and their impact.
 6.2. What are the major changes in land use (area + quality) and management you noted in communal properties over the last 30 years and the institutional changes that go along with these…………………………………………………………………………………………………Section VII Miscellaneous6.3. Do you have additional issues to forward pertaining points discussed?………………………………………………………………………………………………….………………………………………………………………………………………………….………………………………………………………………………………………………….6.4. Would you like to make any comments, observations or recommendations that would be helpful to addressing the land use issues and water resources management?………………………………………………………………………………………………….………………………………………………………………………………………………….………………………………………………………………………………………………….
Appendix II: Key Informants Interview Protocol for River Kuja Basin Study
- 1. What is your current position in the community or in your current employment and your employer?2. What role does your organization or agency play in the management of water resources in the Kuja River Basin area?3. What are the challenges that face the area in terms of land use, water resource use and the entire river basin ecosystem?4. In decision-making process about river basin, what are the influencing factors?5. What do you think the public or residents know about the resource depletability of the river basin ecosystem resources?6. How does the public view Kuja river basin area?7. What environmental changes in the basin have occurred over the years?8. What relationship exists between human activities and the declining water resources in Kuja river basin?9. Who are the key stakeholders in decision-making about the use of water resources?10. Which of these stakeholders exert the most influence?11. What role can the public play in the design of sustainable water resource management measures?12. How does the public influence regulatory decision-making in the area?13. How effective is current water resource management policy if it exists or regulation?14. What can be done to improve current or future water resource utilization controls?15. Explain, in your own opinion, the link between population growth and the land use changes in Kuja river basin?16. What are the effects of sugarcane production in the basin’s water resources?17. Any suggestions on mitigating the changes in the land use/cover and population growth?18. Anything you would like to add that we have not covered?Thank you for your time!