E. C. Merem 1, Y. A. Twumasi 2, J. Wesley 1, D. Olagbegi 1, M. Crisler 1, C. Romorno 1, M. Alsarari 1, P. Isokpehi 1, M. Alrefai 1, S. Ochai 3, E. Nwagboso 4, S. Fageir 5, S. Leggett 6
1Department of Urban and Regional Planning, Jackson State University, 101 Capitol Center, Jackson, MS, USA
2Department of Urban Forestry and Natural Resources, Southern University, Baton Rouge, LA, USA
3African Development Bank, AfDB, 101 BP 1387 Avenue Joseph Anoma, Abidjan, AB 1, Ivory Coast
4Department of Political Science, Jackson State University, 1400 John R. Lynch Street, Jackson, MS, USA
5Department of Criminal Justice and Sociology, Jackson State University, 1400 John R. Lynch Street, Jackson, MS, USA
6Department of Behavioral and Environmental Health, Jackson State University, 350 Woodrow Wilson, Jackson, MS, USA
Correspondence to: E. C. Merem , Department of Urban and Regional Planning, Jackson State University, 101 Capitol Center, Jackson, MS, USA.
| Email: |  |
Copyright © 2021 The Author(s). Published by Scientific & Academic Publishing.
This work is licensed under the Creative Commons Attribution International License (CC BY).
http://creativecommons.org/licenses/by/4.0/

Abstract
Recent narratives in various areas of Africa reveals the growing influence of China in many facets of the economy with a hold on the control of the continent’s natural resources based on invitation. Just as every nation has a right to trade with others, commerce remains the life blood of many African countries where natural resources commodity flow stands as the economic engine driving the generation of revenues. While African countries rely on the ensuing bilateral deals often tagged as resources for infrastructure swaps. The lust for foreign assisted programs in economic development in exchange for natural resources access among African countries over the years provided an opening for China’s presence in the spirit of global commerce in the continent. While China’s robust investments in physical development, renewable and non-renewable resources can no longer be dismissed as solely a pretense to aid African development in exchange for something given some of the upsides. The scale of these activities continues to have profound effects on the ecology of the countries in the continent in the form of degradation of natural areas, deforestation, and erosion of biodiversity. Yet very little exists in current studies to assess the ecological risks from the growing presence of China and the scramble for Africa’s natural resources. For that, this enquiry will fill that void by using mix-scale methods of Geographic Information Systems (GIS) and descriptive statistics in assessing China’s presence and the quest for natural resources in the continent. Emphasis are on the issues, trends, factors, impacts and efforts. The results reveal vast exploitative activities directed at renewable and nonrenewable assets involving mineral ores, oil and gas, lumber, and fishery with notable impacts on the ecosystem. With the effects manifested in the form of environmental degradation, loss of biodiversity, and resource depletion and fiscal burdens on African nations. The problems come from a whole range of socio-economic, policy, and environmental factors located in the larger global system. As a remedy, the paper suggests the need for ethics and transparency, tight fiscal policy, ecological monitoring, enlightenment campaigns, public input in bilateral deals and the design of an interactive natural resource information system for Africa.
Keywords:
China, Natural resources, Scramble, GIS, Impacts, Factors, Ecosystem Degradation
Cite this paper: E. C. Merem , Y. A. Twumasi , J. Wesley , D. Olagbegi , M. Crisler , C. Romorno , M. Alsarari , P. Isokpehi , M. Alrefai , S. Ochai , E. Nwagboso , S. Fageir , S. Leggett , The Assessment of China’s Scramble for Natural Resources Extraction in Africa, World Environment, Vol. 11 No. 1, 2021, pp. 9-25. doi: 10.5923/j.env.20211101.02.
1. Introduction
The African continent as new frontier inhabited by 18% of the world population boasts of over 60% of arable land and 30% in top 10 global strategic minerals [1]. Just as such endowments in natural resources triggered the illegal occupation of the continent by foreign powers in the 1800s, the motives behind China’s presence and obsession with natural resources extraction in Africa regardless of the environmental impacts [2,3,4] is beginning to draw similar comparisons as new form of colonialism [5,6,7]. But as a non-colonial power, China had no history of pitting African tribes against one another for economic influence and greed nor sow the seeds of religious and regional political hegemony in favor of feudal agenda at the expense of ethnic minorities and the enlightened as past European powers did [8]. Nevertheless, China’s emergence as 2nd largest economy globally and the most populated nation on track to overtake the US amidst growth of its cities, relies heavily on raw natural resource access particularly the energy types for viability [9,10]. In that light, during the past years, the literature continues to point to the widespread influence of China in the economy with a major hold on the control of the continent’s natural resources by mutual agreements [11]. Since countries can enter bilateral deals with each other in the name of global trade, ventures between Africans and China are legit. Accordingly, most African nations now see bilateral agreements rooted in infrastructure for their local growth and natural resource rights for Chinese investors as an ideal scheme in line with China’s Africa Strategy [12]. In the process, the lust for foreign assisted programs in exchange for natural resources access among Africans over the years ushered an opening for China’s presence after being shot out by Western firms for decades in the continent [13].Additionally, soaring needs triggered by local spending and significant production of commodities for trade, are pushing the widespread quest for natural capital in the people’s Republic of China. In line with that, Chinese firms, financiers, and dealers seeking out raw materials throughout the globe formed a network of formidable presence in overseas markets. Over the years, the speed and size of the Chinese visibility overseas did prompt worldwide discussions on the effects of such tendencies on nations in the global south. With some of the eyebrows raised at Chinese fiscal dealings in Africa. The so called ‘economic cooperation’ ploy, many argue, consists of monetary deals among China and Africa at the state and individual firm scale. The accrued leverages in such settings seem to generate doubts on the sincerity of China’s backing for her firms in Africa, since the sole aim centers on locking up deals and natural resource exploitation [12]. Moreover, there is also widespread scepticism in different quarters on current trade deals rooted in infrastructure for natural resources access in Africa given the exploitative nature, the impacts on resource stock, and ecosystem viability [15-22]. Even though the literature dismisses China’s eagerness to finance African growth [23] as a new form of economic colonialism, the country has over time, overtaken other powers as the biggest investor in Africa since 2014. At the same time, Western businesses in Africa dread to give up their long-established presence in the continent’s rapidly expanding marketplaces and its abundant natural capital. While Western nations worry about losing economic and political clout, those concerns are again increasing the public discourse on the effects of China’s operations in Africa. As much as China’s robust investments in physical development and natural resources [24,25] can no longer be dismissed as solely a pretence to aid Africa’s growth in exchange for something given some upsides [26]. The quickly expanding financial links with China appears to be driving market surge in Africa in most current times. Essentially, prior ties in the nonaligned nations implies, China stands in a better position to offer support and things more viable to the needs of Africa. Perhaps, China’s global ingenuity in renewable power machineries serves crucial desires when it comes to countryside electric power access in Africa. Yet, the extent of China’s activities continues to have profound effects on the ecology of the African nations in the form of degradation of natural areas, deforestation, and the erosion of biodiversity [27-32].Building on years of solid fiscal footprint in Africa, China wasted no time in turning to the continent for raw materials to ensure resource security critical to a policy of expansion. Despite China’s aid of over $400 billion from 1979-2002 to Africa and beyond. The fact that these funds were funnelled to natural resource rich areas raising their debt profiles to China to $89 billion, aroused doubts given the exposure to fiscal stress [33]. Accordingly, in 2014 rose wood import from Africa to China totalled $2.5 billion implying that at most, one tree was destroyed per minute. Even at that, Africa faces the threats of illegal exports of forest products to China with Ghana now reeling from $10 billion dollars in lost revenues through the pillage of rose wood sold to dealers in China [34,35,36]. Given the backlash from these practices, China now requires adherence to environmental regulations in nations where her firms operate. While these directives have not quelled the concerns, the effects should be assessed [28]. Still very little exists in current studies to assess the ecological risks of China’s scramble [37]. For that, this enquiry will fill that void using a mix-scale model of GIS and descriptive statistics [38,39,40]. Emphasis are on the issues, trends, factors, impacts and efforts. The paper has five objectives. The first aim is to assess the natural resource potentials of Africa with GIS while the second purpose centers on gauging the growing influence of China in resource exploitation. The third objective weighs the ecological risks. The third objective analyzes resource use and impacts, and the fourth aim tracks the driving elements and future lines of action. The fifth objective focuses on the design of mitigation tools for planners.
2. Methods and Materials
The study area of Africa (Figure 1) with a population of 1.3 billion people in March of 2020 and the 2nd largest continent covers 1/5 of the earth on a land area of 29,648,481 km2 [41]. It extends from the Atlantic in the West, the Mediterranean, on the North and Red Sea and Indian Ocean on the East and on the South by mingling of the Atlantic and Indian Ocean. Given Africa’s diverse eco-zones and immense natural resources like gold, diamonds, oil, and timber etc., the lower and central parts are mega diversity states. In the zone, the tropical rainforest extends from the South to West Africa, as the Serengeti includes parts of Tanzania and Kenya followed by the Desert ecosystems of North Africa [42,33]. 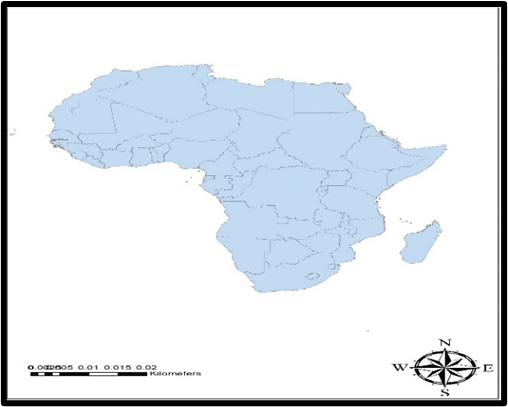 | Figure 1. The Study Area, Africa |
With China’s emergence as the 2nd largest economy globally and the most populated nation currently itching to overtake the US with a surging economic output. Being constantly dependent on raw natural resource access particularly the energy types, China faces rising demands fuelled by the growth of its cities. Building on many years of unprecedent growth and links in Africa, China did not relent in turning to the continent for the needed raw materials to ensure resource security critical to its policy as an emergent economic power. In a continent where China has overtaken traditional European and US investors with over a trillion dollars over the past decades. Such a sudden shift precipitated a major scramble for Africa’s natural capital on the part of China with broad implications on economy and environment from South to west Africa [43-46]. Despite its reputation as a major operating partner, China’s image in the nation of Ghana appears to be at crossroads, in lieu of the rising wave in illicit mining operations involving Ghanaians and Chinese operators. Since the influx of almost 50,000 Chinese citizens in Ghana in 2005 during the gold rush [47,48,49]. The pace of informal mining operations has amplified ecological degradation, made up of loss of woodlands [33-35,50], disturbance of cocoa plantations and pollution of lakes and rivers. All these have resulted in losses in state revenues estimated in the billions of dollars.With that, China's rising power and clout in Africa is shifting towards Nigeria, a nation that has traditionally shipped the bulk of her petroleum to the West especially US and the EU [51]. China, though, is emerging in relevance to the African nation [52]. While over time, most Western businesses dominated the market scene in Nigeria. Yet, with perseverance, political manoeuvring, and high-tech capacity building. Chinese firms are gradually penetrating and securing a grip of the nation’s petroleum sector. By December 2004, Sinopec, and Nigeria National Petroleum Corporation (NNPC) jointly entered a contract to create Oil Mining Lease (OML) 64 and 66, situated in the deep shores along the Niger Delta in Nigeria’s lower South [53]. At the same time, Nigeria sought $10 billion yearly to fulfil its projections for crude petroleum output of 40 barrels daily (bpd) for 2010 and gas venting elimination in 2008. Added to that, in November 2018, China Rail Construction Corp initialled a $12-billion high-speed rail design transaction with Nigeria [54]. But no one asked about the ecological costs to Nigeria’s fragile ecosystems along the project’s routes across the country. From all these, commentators are already implying that Africa is turning into a China’s second continent in the same manner the defunct Roman Empire restructured and meshed dissimilar European nations using a classy web of highways. Accordingly, China’s scramble in Africa is poised to leave an enduring impact on the continent’s economic welfare and natural resources assets like never as highways, mines and critical public infrastructure are funded and designed at a faster rate. This requires an overdue appraisal.
2.1. Methods Used
The paper uses a mix scale approach of descriptive statistics and secondary data connected to GIS. The spatial information for the research was obtained from various sources including the University of Maryland Online Data services, the African Development Bank, (ADB), United Nations Economic Commission for Africa (ECA) and the US Geological Survey (USGS) Mineral Resource System Online Spatial Data. Other sources consist of The USGS World Mineral yearbook International mineral and statistics and information and databases. This was essential in the provision of the solid mineral time series data for the periods of 1979-2015. Added to that are International Monetary Fund (IMF), UN Conference on Trade and Development, Deutche bank, Mckinsey Quarterly, the World Nuclear Association and US Global investors and World Resources Institute. These groups helped furnish the spatial info highlighting some of the strategic minerals highlighting shares from uranium, phosphate to copper and chromium. Given that some of these entities furnished the solid mineral time series data and economic geology index for the periods of 1979-2015. The geographic identifier codes for nations, cities and regions were used to geo-code the information contained in the data sets. This information was analysed with basic descriptive statistics, and GIS, with particular attention paid to the temporal-spatial trends at the national and regional and state boundary levels. The relevant procedures consist of two stages.
2.2. Stage 1: Identification of Variables, Data Gathering and Study Design
The first step involves the identification of non-fuel and fuel solid minerals, fishery, and lumber indices; land use and land cover elements and economic variables needed to assess degradation and depletion in areas where the scramble for natural resources thrives in the producing regions of the continent via export and investments. The solid mineral variables consist of energy, precious metals, and rare earth minerals such as copper, diamond, gold, potash, and uranium. The others cover oil and gas, bauxite, crude oil, platinum, coal, cobalt, iron, phosphate, iron ore, chromium, production of mineral commodities and percentage change and percentage share of Africa’s global commodity resources. Added to that, are mineral types and production rankings by country while land use elements cover rose wood volume, logging, volume of forest products, illegal rose wood volumes, sand mining areas and the number of sites, arable land, degraded area, forest, natural areas, and habitats. In the same vein, econometric and fiscal indices encompass Chinese investment and contracts, China’s total investments, percentage of exports and imports, the percentage of China’s investments, nations with the largest Chinese debts, veneer exporters, volume, and share, African sawnwood exporters, log exporters to China and their volume and share, African forest product exporters and their volume and share. Additional monetary elements consist of volume of African mineral exports to China and the percentages and value of the minerals coupled with China’s overseas mining investment by region and $ values, the percentage share of China’s main oil suppliers and the trade with China. There were also data on places in Africa where China invested the most, China’s total investments in Africa share’ and percentages, rose wood exports and the monetary losses from rosewood depletion and illegal export. Given that the official boundary lines between the nations remained the same, a common geographic identifier code was assigned to each of the area units for analytical coherency.
2.3. Stage 2: Step 2: Data Analysis and GIS Mapping
In the second stage, descriptive statistics and spatial analysis were employed to transform the original socio-economic and land-use data into relative measures (percentages/ratios). This process generated the parameters for establishing the scale of China’s economic investments, export and import activities together with the attendant explorations for natural resources of all kinds, the degradation and change on the landscape in areas set aside for mining operations. This was facilitated by measurements and comparisons of the trends over time. While this approach allows for change detection, the tables highlight stressors, indicators of degradation, mineral and renewable resource consumption involving logging and fishery as well as demands and supply and the corresponding volume of monetary investments in the natural resources sector. The remaining steps involve spatial analysis and output (maps-tables-text) covering the study period, using Arc GIS 10.4 and SPSS 20.0. The spatial units of analysis consist of mineral sourcing sites, (mining) sites across the continent, regions and nations from the North, West to East and the Southern tip of Africa. The geographic data for Africa, which covered national boundaries and regions, also include ecological data of land cover files involving forests through rose wood export, illegal exports, rosewood depletion and mineral production. They highlight mining activities from gold to bauxite along with paper, and digital maps from 1979-2015. The outputs of the spatial data were mapped and compared to see the dispersion of mineral output, stressors and socio-economic and physical factors fuelling upsides in investments and environmental degradation tied to China’s scramble for natural resources in various regions of Africa. With very slight knowledge of the gravity of accumulated impacts of the scramble, GIS analysis provides a tool for understanding the spatial patterns of natural use impacts on fragile ecosystems throughout the various regions in the African continent.
3. The Results
This part of the research delves on temporal and spatial analysis of the scramble for natural resources in the study area. There is an opening stress on the analysis of natural resource production and strategic mineral export in the key regions using descriptive statistics. The other portions focus on the economic geology, natural resources investment, China’s reliance on forestry and fishery products across the continent. This is followed by the remaining segments of the section including an impact assessment, GIS mappings, and the identification of the factors associated with the rush for natural resources in African nations and the efforts towards mitigation.
3.1. Natural Resources and Mineral Production in Africa
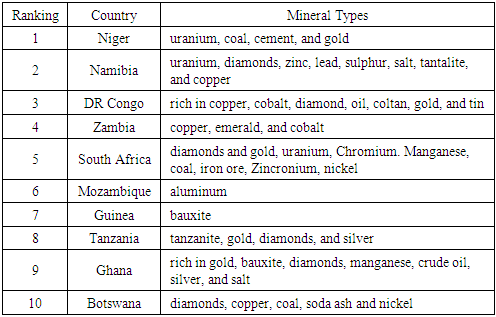
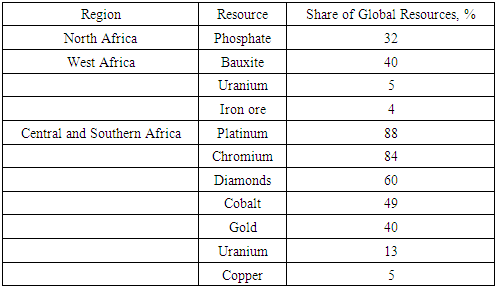
Considering the vast natural resources endowment in Africa and the attractions to potential consumers. The items in place fall under renewable and nonrenewable materials specifically found in individual nations and regions from East to West and the Southern zones. The region’s huge abundance in strategic mineral types from uranium to nickel of immense necessity spans across the top 10 countries as the table indicates. The large presence of uranium particularly in Niger and Namibia and South Africa in the mid and lower side of the continent does loom larger as speculative commodity in international market given the uses. Added to that, is the occurrence of the combination of gold and diamond in a hand full of places like Ghana, South Africa, the Democratic Republic of Congo, and Tanzania where these group of minerals rank high as part of their exports. Elsewhere, comes the presence of aluminum, copper, manganese, zinc, and other non-renewable minerals. In terms of the actual rankings in place, the countries of Niger, Namibia, the Democratic Republic of Congo, Zambia, and South Africa sit on the top 5. The nations of Mozambique, Guinea, Tanzania, Ghana, and Botswana finished in the 6-10 category of top mineral sources in the continent (Table 1). In the same order, a look at the regional distribution of the top 10 global resources areas, shows a dominance of the Sub-Saharan side of West, Central and the South African zones. Of the entire 12 mineral types and their global share of the resource rankings, aside from North Africa’s 32% of phosphate deposits. The West African portion maintains 40-5% of the international market share in both bauxite and uranium together with 4% in iron ore. This leaves both Central and Southern Africa region as the mega resource rich areas with the regions’ global stake of platinum and chromium at over 80% and diamonds estimated at 60%. With that, both areas share in the world’s cobalt and gold availability hovers around 49 to 40%. The same trend applies to the Central and Southern regions whose shares of global uranium and copper deposits stands at 13 to 5% (Table 2). Table 1. Top 10 African Nations With Most Mineral Deposits
 |
| |
|
Table 2. African Regions As Top 10 Global Mineral Resource Areas
 |
| |
|
3.1.1. Output of Strategic Minerals, Energy Resources and Export to China
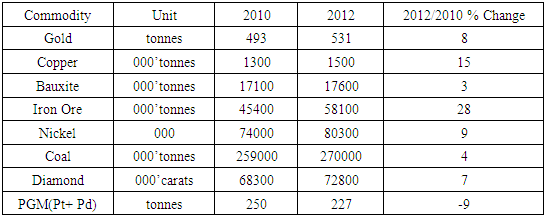
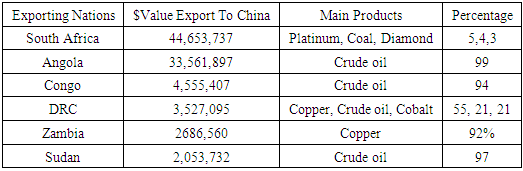
With such abundance of mineral resources spread all over the continent, the production of these resources not only surged notably across Africa in 2010-2012, but gold’s opening output of 493 tonnes in 2010 finished at 531 tonnes by 2012. During the same period, copper and bauxite production went from 1300-171,00 to 1500 -176,00 thousand tonnes. Also, both iron ore and nickel jumped by 45,400 to 58,100 thousand tonnes and 74,000- 80,300 thousand tonnes. Over time, coal output in the continent increased too from 259,000 to 270,000, thousand tonnes followed by diamond at 68,300 to 72,800 carats as pgm also changed by 250 to 227 tonnes all through 2010 to 2012. Of the percentage of changes in the volume of produced commodities, copper and iron ore posted the highest level of gains of 15 to 28% between 2010-2012, while gold and nickel rose by identical levels of 8 to 9%. The other proportion of changes encompasses 3 to 4% for bauxite and coal and -9% for pgm during the same periods 2010 to 2012. In lieu of such volume of mineral abundance, there seems to be a greater mix of crude oil and minerals flow as part of major exports to China in 2012 among half dozen African countries. They ranged from those (South Africa to Sudan) that are actively involved in the commodity transactions (Table 3-4). Beginning with South Africa where the export of main products involves platinum, coal, and diamond at percentage levels of 5,4 to 3. China’s penchant for these items in 2012 fiscal year gulped a whooping US $44,653,737 billion dollars. In that same year, China imported sizable volumes of crude oil out of a trio of nations most notably Angola, Congo, and Sudan. The deals earned an estimated US $33,561,897 billion, US $4,555,407 to $2,053,732 billion dollars. The export of other commodities like copper and cobalt which constitutes 55%-21% from the Democratic Republic of Congo, (DRC) and $2,053,732 to 92% of mineral products out of the non-crude oil producing nation of Zambia exemplifies the depth of China’s stockpiles of African imports in 2012. The tabular display in the case of South African reveals a far greater flow in a variety of export items out of the country destined to China in the fiscal year 2012 compared to Sudan, Angola, and Congo where crude oil accounts for over 90% of the exports to China (Table 4). Table 3. The Production of Mineral Commodities In Africa
 |
| |
|
Table 4. African Exports To China in 2012
 |
| |
|
3.1.2. Economic Geology and China’s Investment in Africa’s Natural Resource Sector
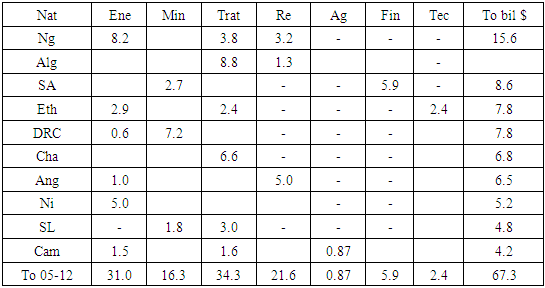
To further buttress the viability of mineral resource transactions and activities involving China all these years. The scope of operations in some twelve African nations that are beneficiaries of Chinese mining investments offer insights on 20 mineral sites operated by Chinese firms. With these sites split between 6 Western African states, 4 South African countries and 1 each from North and Central Africa. The network of Chinese investments in mineral resource production in these regions destined for markets in China remains solidly firm throughout the continent. While this coincides with the breakdown by country and sectoral activity of Chinese investments in 2005-2012. It covers various sectors made up of energy, mining, transport, real estate, to agriculture finance and technology. Among these sectors, the overall sum of Chinese investments in 10 nations in the natural resources sector affirms the dominance of energy and mining at $31.0-16.3 billion with the $8.2 billion to $5.0 billion earmarked for energy resource production in Nigeria and Niger, the highest. In the mining area, both South African and Democratic republic of Congo took the center stage alongside Sierra Leone with investments worth $2.7 to $7.2 billion and $1.8 billion, respectively. Even when disaggregated by percentage levels between the individual country’s energy versus mining investments in Nigeria, Ethiopia, South Africa, and the Democratic Republic of Congo. China’s investment in the first two nations (Nigeria and Ethiopia) at the time, constitutes about 52% to 37% with mining in the latter two group of nations of South Africa and the Democratic Republic of Congo at 31-92%. Also, consider the distribution of additional energy investment values of 15 to 100% and 32% for Angola and Niger, Cameroun, as Sierra Leone finished at 32% in Chinese mining investments (Tables 5).Table 5. Breakdown by Nation and Sector of Chinese Investments in 2005
 |
| |
|
3.1.3. China’s Reliance on Africa’s Forestry and Fishery
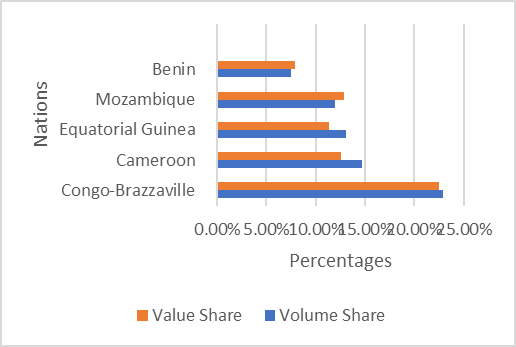
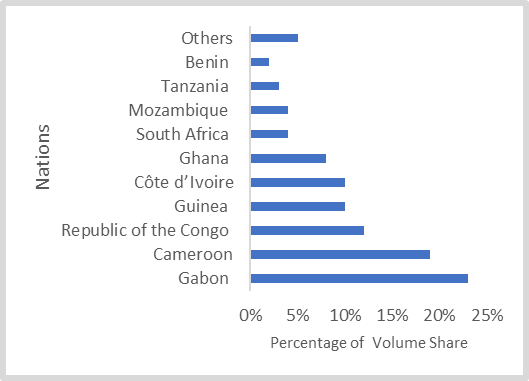
Realizing the growing increases in China’s importation of forest products from Africa between 2006-2012. The top African forest product exporters to China by volume shows Gabon, Republic of the Congo, Equatorial Guinea, and Cameroon with high double digit percentage shares in ranking by 2006. In 2012, South Africa and Congo-Brazzaville held the top 2 spots in forest export to China. For more, see the GIS mappings of the trends for the spatial patterns over time. In putting the forest exports to China from Africa into further context. By 2006, the classification of the top 5 African log exporters to China, shows Gabon as the leading nation with 43.60% in market transactions. In the other ventures, the 2nd and 3rd nations of Equatorial Guinea and Republic of Congo maintained identical values of 17.30%-16.70%. Elsewhere, Cameroon the 4th leading log exporter accounted for 13.60% as the 5th listed nation of Mozambique only finished at 5.80% of the log export market to China (Figure 2). During 2012, Congo-Brazzaville outpaced its neighbors by a mix of 22.90%-22.50% in both volume and value share. The trio of other nations (Cameroon, Equatorial Guinea, and Mozambique) ranked 2nd to 4th, had slightly identical percentage values in the transaction volumes coupled with Benin Republic at over 7% (Figure 2.1). In that order, sawnwood exports listing to China puts Gabon, Cameroon, and the Republic of Congo in the top tier rankings for 23-19% and 12% of the volume of traded products in 2006 (Figure 2.2).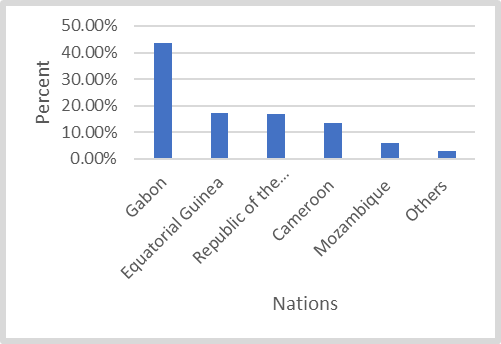 | Figure 2. Top 5 African Log Exporters to China, 2006 volume |
 | Figure 2.1. Top 5 African Log Exporters To China, 2012 |
 | Figure 2.2. Top 10 African Sawn wood Exporters to China, 2006 volume |
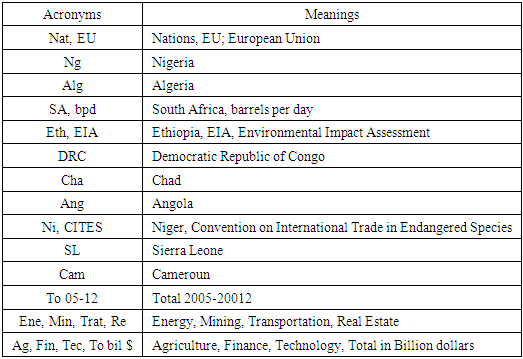
The other way to gauge China’s involvement in the exploitation of Africa’s natural resources stems from unusual quest for fishing rights access to Africa’s territorial waters and the attendant illegalities often engaged by Chinese trawlers. In that case, one need not lose sight of the grand total of 4682,046.896 tons in missing and unreported items out of the continent’s fishery stock from Central to West Africa. With China’s fishing practices implicated in the accumulated losses to the continent, estimated in the billions of dollars since the 1980s. In tallying the volume of fish production in the West African region, it is worth noting that despite the endless wave of unsustainable practices, along the West African lower coastline. The leading countries made up of Nigeria, Ghana to Senegal and the others in the zone still produced about 10,579,910 MT in 1980-2015. Of these nations, the output for Benin and Cameroun estimated at under 1 million MT (299,276-963,341MT), stayed below the levels for Ghana, Nigeria, and Senegal of more than 3-2 million tons. See Appendix B for the Acronyms.
3.2. Impact Assessment
In the face of a widespread scramble for natural resources in Africa on the part of China over the years. The countries of the different regions in the continent with active Chinese investments have experienced mounting impacts of various forms from coast to coast. The nature of the impacts faced in the individual nations from the accumulated ventures left in their wake notable ecological and economic burdens as shown in the following headings.
3.2.1. Ecological Risks: Forests Exploitation
Considering the growing forest exports, several west African countries have seen large scale demands for rosewood forests products from China amidst unprecedented level of logging now threatening the ecosystem. In fact, in 2016 at least seven Nigerian states from Kogi to Cross River states in the Southern forest ecozone and some in central Nigeria’s Savanna forest grappled with increased demands for rosewood amidst clear cutting and deforestation surge. Seeing the threats that unfolded in a couple of states over illegal rose wood demands among the impacted areas in Nigeria. Multiple lower West African nations such as the Gambia, Guinea Bissau, Togo, Benin, Ghana, and Nigeria were not only major targets in illegal rosewood export between 2009-2015, but there are alarms over the dangers of increased activities from 2011 to 2015. The incidence of rosewood pillage has become so dire that growing concerns over the matter stood on top of the agenda during a regional Interpol meeting in 2015. In terms of timber, China became the largest export market for timber from the Congo Basin between 2001 and 2015. While over that same period, the share of furniture export from China to the US grew from 30%-50%. West African countries, particularly Ghana and Nigeria, are currently bearing the brunt of rosewood demand [Fig 13-15]. In 2012, over 540,000 tons of rosewood the equivalent of 23,478 twenty-foot containers or 6 million trees were illegally harvested and imported into China from Ghana despite the bans. At a price tag of $17,000 per tonne, Ghana lost $10 billion in over 6 years.
3.2.2. Mining, Energy and Hydro Impacts
Part of the unsustainable practices now threatening the continent’s ecosystem in various nations emanates during sand mining in pristine coastal beaches along the Nagonha axis in Northern Mozambique in the Indian ocean. The activities of Chinese mining company therein, has irrevocably tarnished the landscape scenery, and people’s lives. This happened to a community of 1,329 residents and a vulnerable village of 236 huts. The mining activity led to filling of 280,000 m2 of wetland, lagoon channel blockage and changes in tidal flow of fresh H2O. Additionally, the loss of $2.3 billion in 2016 from illegal gold mining and cases of water pollution and land degradation prompted a crackdown that nabbed 311culprits including 169 Chinese in Ghana. Bauxite mining in Guinea has been known to trigger similar risks as well. At the same time, many leading cases attests to the dangers associated with Chinese venture capital swap for Africa’s natural resources. In the case of Gabon, Sinopec’s initial phase of petroleum exploration along Loango National Park came to a halt in September 2006 at the insistence of the country’s park authority out of concerns over degradation and resource depletion risks. Most environmental organizations indicated that hydrocarbon extractive activities in the area posed threats to biodiversity in the absence of the required EIA study demanded by the host Environment Ministry. Also, even China’s Kongou Dam, that was planned to provide energy and drive the Belinga iron ore venture in Gabon, had the potentials to severely damage forest habitats at the Ivindo National Park. Elsewhere, Sinohydro’s Bui Dam, a venture sponsored by China’s Exim Bank, was deemed at risk, given the anticipated flooding of almost 40% of Bui National Park in Ghana. In other places like the South East African zone, the Lower Kafue Gorge Dam, as part of the Sinhoydro project with funds from China’s Exim Bank in Zambia, still could not meet safety standards. For that, it was later deemed a risky venture given the strain on biologically essential Kafue Flats and the nation’s recreational assets.
3.2.3. Economic Implications
The massive loans owed to China by several African countries remains an indication of how economic dependence of the continent on the former provides the leverage to exploit Africa minerals with impunity. With over $80 billion dollars in debts, the quest for better environmental regulations to verify operations often takes the back seat among African nations. In such situations, speculators from China always had their way with host nations approvals in the continent. This has been the case in several places of Africa beginning with West Africa where the governments in Ghana, Nigeria and Guinea went into lucrative deals in mining and oil and gas barter in the name of nature for infrastructure or cash swap. In such settings, access to lucrative bauxite and oil gas reserves and China’s apparently avid craving for minerals also lured other West African countries into the deals. Evidently, short term economic gains from China’s presence at the expense of widespread impacts on fragile ecosystem seems to be the hallmark of fiscal policies among African nations who thrive on that path over the years.
3.3. GIS Mapping and Spatial Analysis
The GIS analysis consists of the visual display of spatial patterns pinpointing various dimensions illustrating the natural resource potential of Africa and contours of the scramble for these assets by China. With the scope built on exports, investments, mineral rights, and the distribution of Africa’s minerals across regions. From the experiences of those at receiving end of these activities over time. The mapping also highlights the magnitude of forestry trade and incidence of illegal rosewood export to China and the nations besieged by the alarm in Africa. Displaying the spatial dispersal of the trends and the challenges involved in a GIS environment as analytical device, provides opportunities for Sino-African dialogue rooted in adjustments in areas deemed anomalous in future ventures. Bearing in mind, the economic significance of exports as key fiscal indicators in global commerce. In the search for natural resources over the years, amidst surging transactions, China expanded its fiscal imprint throughout Africa. While this is evident with the higher volume of export activities out of Africa to China estimated at 2,126% between 1998-2006. During the same period, note that Africa’s exports to the European Union and the USA measured at 136% to 402% stood far lower compared to the trade volumes with China (Figure 3). This coincides with the pace of Chinese investment devoted to mineral deposits and extractions. Thus, aside from the sole manganese prospects in Algeria, much of the stocks that attracted interests like iron, chrome, uranium, phosphate, cobalt, bauxite, copper and ferro chrome etc., stretches deep from the lower West African region to the central, East, and South African zone of the continent. In all that, the overwhelming nature of these spate of transactions in diverse array of natural capital, exemplifies the size of fiscal assets poured into strategic minerals in the various sub regions of the continent (Figure 4).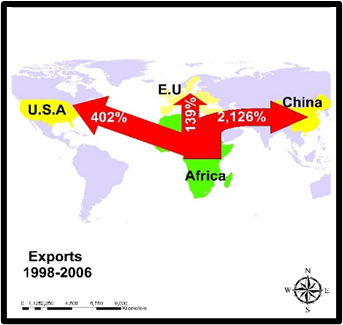 | Figure 3. Spatail Distribution of Africa’s Global Exoport 1998-2006 |
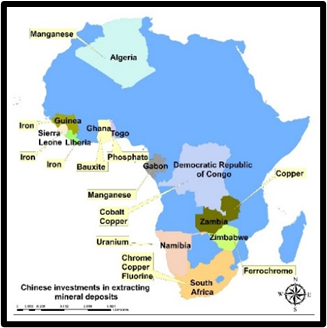 | Figure 4. Geographic Dispersion of Chinese Investments in Mineral Deposits |
Accordingly, the scale of Chinese investments throughout the select areas of the continent which ranged from the percentage points of 80 plus, over 90% to 100 seemed deeply concentrated in the West, Central and South African zone. Among the nations that benefited from the investments in West Africa. The nations of Niger and Sierra Leone as sites of 100% values in Chinese deals, took in maximum investments. Within nearby areas, Nigeria, Chad, and Cameroon saw 97% of those assets. In the Horn of Africa and Central Africa side of the continent, both Ethiopia and the Democratic Republic of Congo accounted for 99% as both Angola and South Africa posted between 92-100% in terms of Chinese investments (Figure 5). This reflects the positive view of China’s economic and political influence which reached over 80% among nations in the Sahel region of West Africa in dark green color. This seems like others in lower West Africa in light green and mild green color along the coastal south west with 71-80% and 61-80% together with slightly identical levels of positive view of China in the Southern African region (Figure 6). The robust form of these prospects regionally has not only intensified China’s widespread acquisitions of mineral rights involving oil and minerals in a multiplicity of the nations as distinguished in the colors of light orange, dark red, and blue. From the distribution, there exists a notable Chinese foothold on mineral rights. The sites are firmly planted in parts of the Northern area, Western and Central and Eastern African zones of the map with the rights to drill oil clustered in the places on the map identified in dark red with more prominence in the west and north as well as other countries in South West Africa. 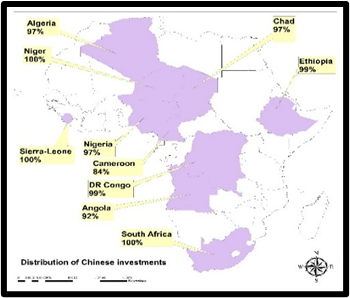 | Figure 5. The Level of Distribution Chinese Investment In Africa |
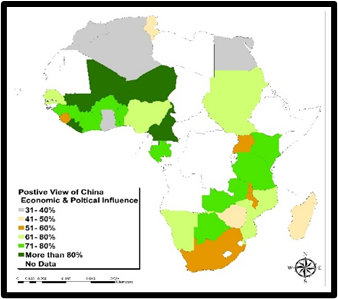 | Figure 6. The map of Opinion on China Across Africa |
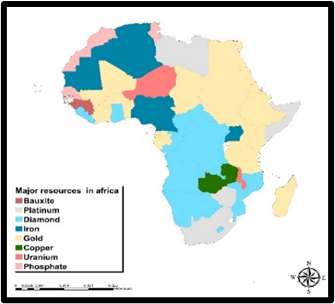
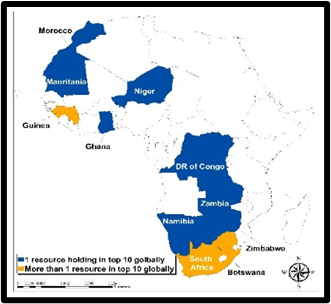
Other dimensions from the emerging spatial patterns point to places where China maintains both oil and mineral rights in blue color. This is manifested with slight presence in lower side of West Africa followed by far greater concentration in the South West and South East Africa (Figure 7). Said that, this may not have been possible without the vast presence in large stock of minerals dispersed across various regions. Being a continent endowed with some of the most strategic natural resources from bauxite to phosphate represented in pink to light yellow colors. The diamond corridor in light blue parts of the map starts from the two locations in lower west African zone along the Gulf of Guinea coupled with extensions deep into Central and South west Africa together with platinum sources (light gray) in the North and South Africa as well. Of great spatial importance are the gold producing areas in both North west and North Africa, the East and South East African zone known for its copper deposits. Added to that are the areas endowed with large bauxite, iron and uranium and phosphate deposits along the West and Northern region of the continent (Figure 8). Given the capacity of China in securing multiple rights across Africa with many sources and large deposits of minerals spread all over the nations. Much of the natural resource base in the continent ranked high in the global top 10 classification run through sub-Saharan side of Africa from Mauritania in the West to Botswana and South Africa in the South with the latter nations having more than one resource in the ranking. With 7 nations identified in blue across the continent listed amongst among top 10 producers of a major resource, 3 others (Guinea, Zimbabwe, and Botswana) in yellow spots of the map, maintained higher spatial rankings in two key resources (Figure 9). 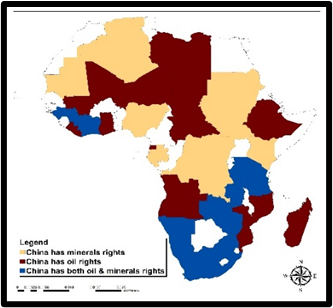 | Figure 7. Locations of China’s Natural Resource Rights |
 | Figure 8. Major Mineral Resources of Africa |
 | Figure 9. Natural Resource Potential and Ranking |
On the ecological side of things, in terms of renewable resources like forestry. The inferences to be drawn from China’s natural resource scramble in Africa stems from the spatial concentration in forest and sawn wood exporters from 2006-2012. Since this involves the intrigues embedded in the continent’s deep richness in timber along the Atlantic side of the Sub-Saharan region of Africa spanning from West, central, East, and South African subregions. The highlights of principal exporters in 2006 shows Gabon at 38.5% with a trio of other nations like Democratic Republic of Congo, Equatorial Guinea, and Cameroon responsible for over 14% to 12% of the trade with China in 2006. This seems different when compared to the rest of over half a dozen nations in the continent where export activities in single digits seems concentrated in several central, western, and south African countries (Figure 10). In the following period 2012, when Congo Brazzaville emerged as the largest forest exporter with 16.4% total exports to China, another trio of nations made up of Cameroon, South Africa, and Mozambique and those classified as others followed up with over 12% of the transactions destined to China (Figure 11). During the same year, the country of Gabon outpaced its neighbors as largest exporter of sawn wood at a rate of 40% as both Cameroon and Mozambique portions of the trades at over 21%-22.1% exceeded those of the other regional exporters (Figure 12). Notwithstanding the scope of forest exporters, the frequency of illegal rosewood export to China from a handful of West African nations rose significantly from Gambia to Nigeria since 2009-2015 (Figure 13). This comes amidst widespread Interpol concerns and mounting alarms over exploitations across the forest belt of West Africa (Figure 14-Figure 15).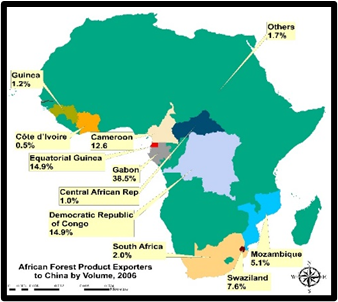 | Figure 10. African Forest Product Export to China 2006 |
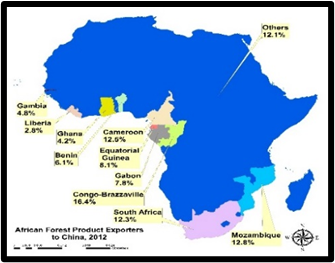 | Figure 11. African Forest Product Exporters to China 2012 |
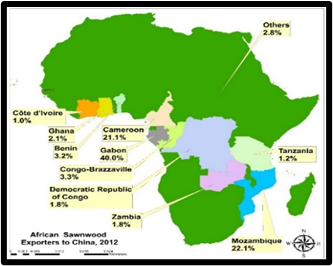 | Figure 12. African Sawnwood Exporter to China 2012 |
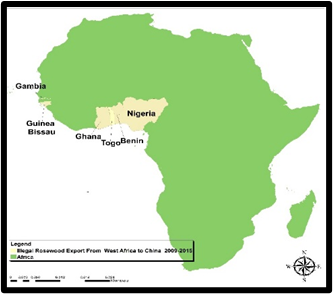 | Figure 13. Illegal Rosewood Export To China 2009-2015 |
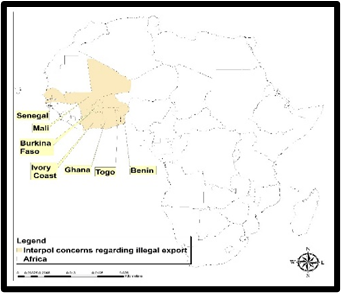 | Figure 14. Interpol Concerns Regarding Illicit Rosewood Export |
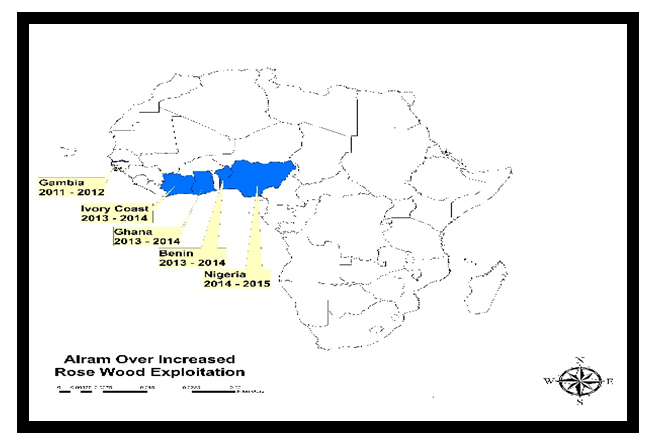 | Figure 15. Alarm Over Widespread Rosewood Exploitation |
3.4. Factors Responsible for China’s Scramble for Natural Resources in Africa
The scope of China’s search for natural resources assets in African countries are so extensive that they do not operate in isolation. The pace of those activities across commodity sectors and markets within regions of the continent transcends a host of policy, economic and physical-environmental factors. These forces are assessed in detail in the following paragraphs.
3.4.1. Economic Elements
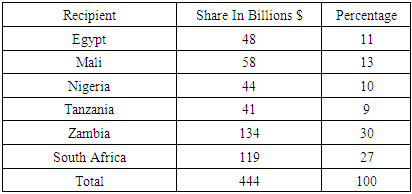
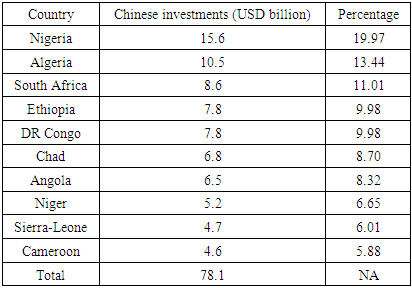
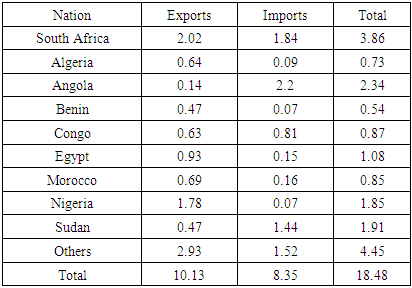
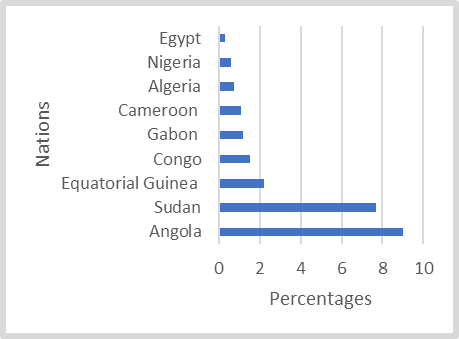
On the economic side, China invested about $444 billion in Africa from 1979-2002. Most of these amounts were in the non-oil producing but mineral rich Southern Africa nations of Zambia and South Africa. Being the largest recipients of the ventures worth $134-$119 billion and 30 to 27% of the entire investments. Both countries were closely followed by Egypt and Mali with $48-58 billion at 11 to 13% as well as Nigeria and Tanzania with funds more than 40 billion. This represents 9-10% of the overall Chinese investments over a period of 23 years (Table 6). By 2005-2013, the $78.1 billion dollars from the investments were fully concentrated in Sub Saharan Africa. At that time, Nigeria and Algeria topped the listings with $15.6-10.5 billion dollars and 19.97 to 13.44% above South Africa, Ethiopia, Democratic Republic of Congo, and Chad. The last four nations held $8.6, $7.8, and $6.8 billion in Chinese funds. Those figures exceeded the amounts devoted to the other group of nations and bigger than the rest including Angola, Niger, Sierra Leone, and Cameroon (Table 6.1). The trade volume of the era coincides with the earlier investment patterns in the early 2000s. In the entire continent, both Nigeria and South Africa exported more products valued at $2.02 to $2.93 billion with the remaining nations below that threshold. On the imports, Angola, South Africa, and Sudan held the top positions as the principal importers of Chinese goods estimated at 2.2 billion, 1.84 billion to 1.44 billion dollars (Table 6.2). In 2003 when China’s percentage share of African oil supply of 97.7% to 2.2% held firm in Angola, Sudan, and Equatorial Guinea. The Central African nations of Congo, Gabon, and Cameroun accounted for over 1% of the volume of exports (Figure 16). With such an interest, Africa’s portion of Chinese mining investment across the world grew from $15 billion to $155 billion in 2010-2011. Table 6. China’s total investments in Africa between 1979 and 2002
 |
| |
|
Table 6.1. Top ten countries in Africa where China invested the most between 2005 and 2013
 |
| |
|
Table 6.2. Trade between China and Africa in 2003. (in billions of dollars)
 |
| |
|
 | Figure 16. Percentage Share of China’s Main Oil Suppliers, 2003 Exports |
3.4.2. China’s Policy In Africa
On the policy side, together with the commercial inroads, China has swiftly consolidated its ecological footprint in Africa. The vital policy aim embedded in China’s Africa policy hinges on the mining of inaccessible natural resources. With these kinds of assets usually found in delicate environments and nations run under feeble and undemocratic political structures. Being members of the nonaligned movement, both China and Africa speedily increased their ties in the domain of political economy in the onset the century. Given Chinese efforts in gaining a commanding foothold in resource extraction lacking in Asia, Africa’s willingness provides a booming market for Chinese companies under a strategy aimed at garnering natural assets deemed unexploitable and politically risky in the west. Since such policy demands heavy ventures in renewable and nonrenewable resources. The position of China’s Exim Bank in directing export promotion of goods and services, ensures the flow of lines of credit to sustain Chinese firms and their overseas customers through lending, loans, and pledges. Under Beijing’s ‘go global’ strategy policy, China’s Exim Bank provided foreign financiers reduced interest rates worth billions of dollars in revolving loans in 2007. While China’s Exim Bank surpassed the World Bank together with any other known global trade guarantors with billions of dollars in loans to Africa. In September 2006, the Exim Bank entered deals involving over three dozen African nations with 259 ventures under its operation.
3.4.3. Ecological and Physical Factors
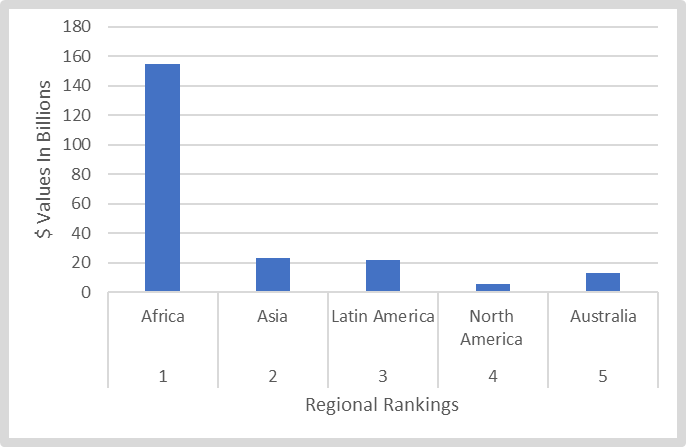
Being a continent holding 1/3 of global minerals, the most cultivable land with vast reservoirs of mega diversity and rainforest spanning west to south, makes Africa the place to meet China’s demand for natural resources. Accordingly, the extent of China’s investment in minerals in Africa remains a testament to the role of ecological and physical elements in spurring the scramble for natural resources. The fact that most of the mine fields and sedimentary basins across the world are aging and with Africa’s rich deposits in diverse ores from gold, bauxite, diamonds, and other gems together with the extensive fishery habitats. There is nothing else to deny about China’s coordinated rush to the African continent for these resources. To that effect, between 2010-2011, Africa’s share of Chinese mining investment globally went from number 3 (at $15 billion and 14.79%) to number 1 based on $155 billion to 70.84% of the entire stake of $ 218.8. billion. Such rise in asset in African mine fields on the part of China, would not have happened without the large deposits of mineral ores in the continent (Figure 17-Figure 18). 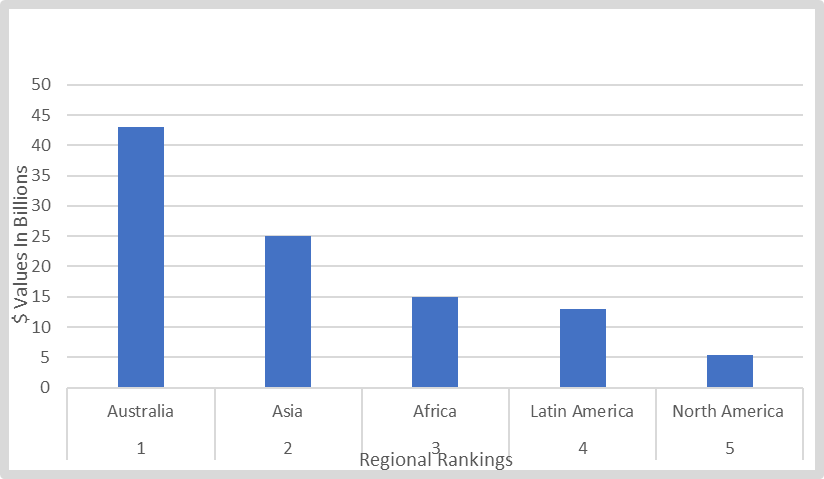 | Figure 17. Rankings of China’s Overseas Mining Investments by Continents, 2010 in Billion $ |
 | Figure 18. Rankings of China’s Overseas Mining Investments by Continents, 2011 in Billion $ |
3.5. Efforts and Initiatives
The rising implications from China’s quest for natural resources out of Africa has now attracted the attention of various stakeholders on both sides towards the search for mitigation measures. Accordingly, actions are now being taken through collaborative and individual efforts by agencies and states to ensure best management practices to limit current impacts on the continent’s ecosystem.
3.6. Sino-African Partnerships and Local Measures
From some of the growing concerns, there have been moves to limit collaboration gaps between key players in Africa and China. For that, the China-Africa Forest Governance Learning Platform was launched in 2013. While this effort emerged out of the ongoing problems, it stems from a preference by groups like practitioners in governance in 10 African and Asian countries working to coalesce over common causes a decade ago. Since its inception, the platform has brought together forest governance players from China and eight African countries. To tackle major concerns like the African rosewood pillage. The officials of the Ministry of Environment in Senegal upon a return from China stepped up actions that resulted in moving rosewood species to the CITES Appendix II extinction list unless the trade is controlled. While Zambia in the copper Belt in 2011, through its Environment Management Agency (ZEMA), demands impact assessments on Chinese projects prior to execution. China now requires the nation’s firms operating in Africa to adhere to local environmental regulations.
4. Discussion
The perception of the African continent in the past as resource endowed continent at the disposal of European colonizers in search of raw materials to spur global capital never seems to go away. This now coincides with China’s current scramble for the same treasures a century later under different circumstances. At a time in which some see Africa as China’s second continent voluntarily entrapped in a second scramble as a willing participant. The current activities of China in the continent under the guise of building and funding infrastructure in exchange for natural resources access even though it is not an exception, has pushed those interests onto the arena of scrutiny in the west. This stems from the one-sided leverage in the transactions. Yet, in the absence of vast reserves of mineral resources, there would have been no way to imagine the inflow of Chinese cash in the past two decades amidst current issues. In assessing China’s scramble for natural resources, this enquiry drew from analytical proficiency of the mix-scale model of descriptive statistics and GIS to track the problems, the potentials of the continent and the effects on the ecology. In a temporal profile of the continent’s rare mineral resources capacity, the study affirmed Africa’s abundant deposits in precious materials from gold to diamonds coupled with hydrocarbons and timber that sparked China’s scramble. To fully understand the scope of China’s scramble for natural resources in Africa, the enquiry tracked the investment trajectory over the years. With most mining fields around the world nearing exhaustion, China's stake in mining ventures in a new frontier like Africa rose from $10 billion to $150 billion. Being the largest recipient in Chinese investment in the mining sector in a decade, Africa overtook the previous number one in the globe, Australia. Also, China wasted no time in surpassing the EU and the US as largest investors in Africa. In having cemented the ingredients, for dominance ahead of its western competitors based on patience, support from China’s state-owned Bank and the Sino-African links in the non-align movement. Such familiarity appears fully entrenched in Chinese investment in the areas of energy, mining, and infrastructure across various nations. Accordingly, some of the biggest recipients embody the copper and gold and diamond belt in the Southern Africa region states of Zambia, South Africa, and Angola, as well as the Democratic Republic of Congo under related ventures in East, Central Africa, and West Africa. To some degree, the costs of illegal export practices pertaining to rose wood products from West African nations of Ghana and Nigeria to China represents $10 billion in lost revenues to these nations. Considering the rising ecological footprints from China’s scramble in Africa, there exists rising impacts. The enquiry not only captured the gravity of the environmental liabilities on Africa’s fragile ecosystem and biodiversity rich habitats threatened by degradation. But the sequence of disasters emanating from some of these deals remains visible. Overall, much of China’s operations in host nations inflicted unwanted damages to the ecosystems. Some of the major cases consists of dams’ design incidents in Sudan and the dislocation of citizens without meeting EIA standards. Undertaking key energy and mining projects on terrains adjacent to protected areas in national parks without local consents in defiance to community concerns in Ghana, Gabon and Guinea are common. Recent images of accumulated impacts from beach sand mining activities involving a Chinese firm in Southern Mozambique shows the obliteration of a coastal town subjected to erosion hazards exposure in a fragile terrain. The other known impact of fiscal nature stems from debt load exposures of over $140 billion accumulated by African nations. The heavy debt concentration in resource rich nations like Angola, Nigeria, the Democratic Republic of Congo, and others calls into question whether the accrued ventures serve the interest of needy citizens of these nations or are they mortgaging their future? The spatial analysis of these tendencies using GIS mapping, underlined the dispersion of various dimensions of Africa’s natural resource endowments across regions of the continent germane to China’s scramble. Thus, the geographic visualization further identified clusters of areas that are indicative of Africa’s forest export, the concentration of Chinese investments in mineral deposits and fiscal ventures. These patterns depict also points in space in West Africa that are vulnerable to illicit rose wood exploitation destined to China. As a remedy, the paper suggests the need for ethics and transparency, tight fiscal policy, ecological monitoring, enlightenment campaigns, public input in bilateral deals and the design of an interactive natural resource information system for Africa.
5. Conclusions
This enquiry analysed the ongoing scramble for natural resources in the African continent by Chinese operators together with the production levels in various regions with valuable insights specified in the following order. a) abundant natural resource/mineral production potentials in Africa; b) investment pursuits on the rise; c) impacts obvious; d) activities prompted by many factors; e) mix scale model very effective. Considering the attributes of Africa as frontier of nature spread across mega diversity zones endowed with vast precious possessions like gold, diamonds, oil, and timber etc. The variety of rare natural assets in the continent attractive to consumers are specifically found in individual nations and regions from East to West African zones. While such versatility exemplifies the capacities of the continent. The Sub-Saharan region’s enormous richness in strategic mineral types consisting of uranium, nickel, and others of great needs, spans over some top 10 nations in the continent. Given the presence of uranium in Niger, Namibia, and South Africa in the central and lower zone of Africa. The sheer capacity of mining activities in these areas are crucial for speculative trading in strategic minerals within the orbit of global capital. Compiling info on vital assets at the center of competition among global economic powers amidst Chinese scramble, is laudable in natural resource planning where managers are regularly kept informed on the sustainability of commodity holdings slated for investment under speculative portfolios.Drawing from decades of robust fiscal imprint and on the feasibility of Africa’s natural abundance. The continent’s attractive rate of returns in transactions did accelerate Chinese investment to record levels in various areas. As much as China poured in $400 billion by 1979-2002 into deals in African nations. The vast part in initial capital of $134-$119 billion concentrated in the non-oil producing and mineral rich Southern Africa nations of Zambia and South Africa at the rates of 30-27% were no handouts. Worthy of note in 2005-2012, are 12 nations bustling with mining activities in a network of 20 sites under Chinese firms from West to South Africa through which the ores ended at markets in China. Having gleaned the scope of Chinese investment in Africa, the capacity of this study in tracing the trajectory and concentration of these deals in a way not imagined before stands out given the need for equity and clarity. Plenty chance exists for African nations and stakeholders in China to carefully gauge loopholes in ventures to ensure public faith, protection of natural resources and citizens welfare in the continent. The scope of large-scale impacts of ecological, physical, and economic nature from Chinese scramble have been fully manifested in the continent. In 2009-2015, in west Africa, the demands for illegal rosewoods escalated to the extent that 6 nations from Gambia to Nigeria saw unprecedented level of deforestation prompted by pressures from Chinese dealers. In the same vein, in 2019 Africa still incurred about $17 billion in lost revenues from stolen rosewood export to China. Consistent with these liabilities are the damages inflicted on coastal community landscapes by Chinese sand miners in Northern Mozambique. Others are the impacts tied to gold mining as shown by water pollution and land degradation in Ghana in 2016 and the risks in hydro projects from Gabon to Zambia. Surely, the jumbo loans owed to China over these projects by African nations triggers ecosystem liabilities. Highlighting these risks herein signals original evaluation of Africa’s dilemma in these ventures as an alternative to previous ones. The nations can then draw from the annotations as templates for good practices when assessing the interactions between nature and economy in impact analysis. Clearly stated, the enquiry was firmly on schedule in capturing the host of physical, environmental, and socio-economic forces at the center of the scramble. With the fiscal dilemma faced by Africa limiting the capacity of the nations to leverage much of deals from China. China’s economic power based on a robust investment in needy nations and Beijing’s knowledge of Africa, ensured the path to success for Chinese firms. Aside from China’s Africa policy on mining inaccessible natural resources in places where western firms rarely go. The activities of China’s Exim Bank in providing the impetus, cemented the nation’s robust foothold in mineral extraction in Africa. Being a continent with 33% of global minerals, the most cultivable land with vast swaths of mega diversity and rainforests, makes Africa an attractive frontier for Chinese investment in raw natural resources, hence the late scramble therein.Additionally, the applications of mix scale methodology as analytical tool did stand out. Applying the model made up of descriptive statistics and GIS mapping as analytical devices provided a novel way to assessing continental and regional natural resources potential. The model was quite efficient in defining the study site and detecting the trends, along with the compilation of data on the elements and variables from mineral production, changes, to forest exports. This technique remains very vital in meeting the needs of scholars interested in geo-spatial analysis of natural resources management. Besides, the geographical visualization of the trends via GIS analysis indicates concentration of precious natural resource potentials across Africa together at places with exports to China. Subsequently, GIS mapping as a planning tool highlighted the dispersion of Chinese mineral rights, spatial trajectory of investments and locations of illegal rosewood exploitation across space. The capability of GIS in pinpointing these anomalies raises the gravity of the concerns in the affected regions and its proficiency.Bearing in mind the viability of Africa’s natural resources potential and China’s scramble for these assets across the nations. The managers and planners will face the urgent task in the years ahead of responding to various questions rooted in sustainable use, access, production, impacts, rare minerals, natural resource exports, and the interactions between economy and ecology. The queries center on which challenges will Chinese quest for Africa’s minerals encounter in the coming years? How will it affect future access? Which factors will shape future deals between African nations and China in natural resource supply? How will local communities manage the degradation inflicted on their ecosystem? How will multilateral agencies and civil societies in China and Africa contain challenges from resource extraction? Building on these questions, provides plenty of opportunities for scholarship and practice to affirm the basis of equity, transparency, local participation, and environmental sustainability given the affinity towards infrastructure for natural resource deals common in Africa.
Appendix A
Acronym
 |
| |
|
References
| [1] | Lawrieon, Willilams Gold. (2015 February). Into Africa – China’s Resource Investment Target. Online Available: https://lawrieongold.com/lawrieongold-58/. |
| [2] | Hubert, Thomas. (2016 July). Growing Chinese Presence, a Wake Up Call For African Natural Resource Managers. Center for International Forestry Research. Bogor: Indonesia. |
| [3] | Dollar, David. (2016). China‘s Engagement With Africa. From Natural Resources To Human Resources. Brookings Institute, DC: Washington. |
| [4] | Gandolfo, Ariel. (2015 June). Chinese Investment in Africa – Where Do the Jobs Go? Prospercis. CSIS. Online Available: https://csisprosper.com/2015/06/17/chinese-investment-africa-jobs/. |
| [5] | Wan Chan, Mary Madeleine Edel. (2018 December). China in Africa: A Form of Neo-Colonialism? Online Available: https://www.e-ir.info/2018/12/02/china-in-africa-a-form-of-neo-colonialism/ https://www.e-ir.info/pdf/76655. |
| [6] | Lumumba-Kasongo, T (2011). China-Africa Relations: A Neo-Imperialism or a Neo-Colonialism? A Reflection. African and Asian Studies, vol. 10, pp. 234-266. |
| [7] | Langan, M (2017). ‘Emerging Powers and Neo-Colonialism in Africa’, in M Langan (ed.), Neo-Colonialism and the Poverty of ‘Development’ in Africa, Palgarve Macmillan. Newcastle:UK. pp. 89-117. |
| [8] | Frederick, Stakelbeck. (2005). China's Growing Influence In Africa. American Thinker. Online Available: https://www.americanthinker.com/articles/2005/05/chinas_growing_influence_in_af.html. |
| [9] | Campbell, H (2008). China in Africa: Challenging US Global Hegemony. Third World Quarterly, vol. 29, no. 1, pp. 89-105. |
| [10] | Freemantle, Simon. (2018). The Race For Raw Materials and The 9 Things You Should Know About China’s Ties With Africa. Sierra Stream Technologies. Online Available: https://4m.cn/7ENGz. |
| [11] | Bradley A., Thayer. (2019 November) China Is Not In Africa For Charity, But To Control Its Resources. Chinese imperialism has come to Africa. The National Interest. 1-7. |
| [12] | Wu, Yabin (2017 March). Chinas International Development Strategy In Africa. Mutual Gain. Bridges Africa. 6:2:1-6. |
| [13] | Nantulya, Paul (August 2018). Grand Strategy and China’s Soft Power Push In Africa. Global Sentinel. DC: Washington -1-12. |
| [14] | Mark, Esposito. (2015). China Is Expanding Its Economic Influence in Africa. What Is Africa Getting Out of It? The Slate Group LLC. 1-11. |
| [15] | Parks, Bradley. (2016 October). Chinese Aid is Helping African Economies, but Not In the Places That Need it Most. The Washington Post. |
| [16] | Weng, X. (2014). The African -China Timber Trade: Diverse Business Models Call For Specialized Policy Responses. CIFOR Brief No 34. Center For International Forestry Research CIFOR. Bogor: Indonesia 1-3. |
| [17] | Hanauer, Larry. China In Africa; Implications of A Deepening Relationship. Rand Corporation. National Security Research Division. Santa Monica: California. pp 1-6. |
| [18] | Dahir, Abdi Latif (2019 April). Africa’s Resource Rich Nations Are Getting Even More Reliant On China For Their Exports. Quartz Africa. 1-15. |
| [19] | Institute of Developing Economies. (2013) China In Africa. Japan External Trade Organization. IDE-JETRO. |
| [20] | Myers, James. (2015 June). Briefing The Dragon and the Giraffe; China in African Forests. International Institute For Environment and Development. IIED. 1-4. |
| [21] | Adisu, Kinfu. (2010 September). The Impact of Chinese Investment In Africa. International Journal of Business and Management. 5: 9: 3-9. |
| [22] | US GAO. (2013 February). Sub Saharan Africa.: Trends in US and Chinese Economic Engagement. GAO. DC: Washington. |
| [23] | China File Center (2016 June). Visualizing China’s Aid to Africa. China Aid Map Reveals Nearly $100 Billion Infrastructure Investment Boom in Africa. China File Center on U.S.-China Relations; 2000-2013. pp 1-18. |
| [24] | Forbes Africa. (2017 September). Is China Really Helping Africa. Forbes Africa. 6. |
| [25] | Kartik, Jayaram. (2017 June). The Closest Look Yet At Chinese Economic Engagement In Africa. McKinsey & Company. DC: Washington. |
| [26] | Kaplinsky, Raphael. (2009 September). Chinese FDI In Sub Saharan Africa: Engaging with Large Dragons. The European Journal of Development Research. 21: 4: 551-569. |
| [27] | Merem, E.C. (2019). Analyzing the Tragedy of Illegal Fishing on the West African Coastal Region. International Journal of Food Science and Nutrition Engineering, 9(1): 1-15. |
| [28] | Bosshard, Peter. (2008). China’s Environmental Footprint in Africa. International Rivers. Working Papers in African Studies. African Studies Program The Johns Hopkins University. Paul H. Nitze School of Advanced International Studies. DC: Washington. 1-19. |
| [29] | Lafargue, Francis. (2009). International Relations; China’s Presence In Africa. China Perspectives 1. 1-6. |
| [30] | Putzel, Louis. (2011). Chinese Trade and Investment and the Forests of the Congo Basin. Synthesis of Scoping Studies in Cameroon, Democratic Republic of Congo and Gabon. Working Paper 67: Center for International Forestry Research. |
| [31] | Leung, Denise. (2014 May). Where are Chinese Investments In Africa Headed? World Resources Institute. 1-7. DC: Washington. |
| [32] | Li Bo 2016 Feb. How Does Chinas Growing Overseas Investment Affect Africa’s Forest? 5 Things To Know. World Resources Institute DC Washington. 1-8. |
| [33] | Merem, E. C. and Twumasi, Y. A. (2020, March). The Assessment of China’s Scramble for Natural Resources Extractions In Africa. 16th International Symposium on the Recent Advances in Environmental Health. Jackson, MS. 2020, March 29-April 1. |
| [34] | Effa, K. (2019). Ghana Lost $10 Billion Through Illegal Rosewood Logging Export to China. Genesis Media 35. |
| [35] | Abdur, Rahman. (2020). Alfa Shaban Exposé: How Illegal Rosewood Logging Robs Ghana In Multiple Ways. Africa News. Online Available: https://www.africanews.com/2020/02/11/expose-how-illegal-rosewood-logging-robs-ghana-in-multiple-ways. |
| [36] | Jere, Joshua. (2019 August). Ghana Lost $10 Billion Through Illegal Rosewood Logging Export To China. (YEN). Online Available: www.znbc.co.zm/news/ghana-lost-10-billion-through-illegal-rosewood-logging-export-to-china/. |
| [37] | Jan Willem, van Gelder, (2013 August). Biodiversity Impacts of Chinese Economic Activities in Africa. Online Available: http://chinagoesglobal.org/wp-content/uploads/2013/08/Sanne_van_der_LugtII_Biodiversity.pdf(20132013/08/. |
| [38] | Merem, E. C. (2017). Regional assessment of energy trends in West Africa using GIS. International Journal of Energy Engineering, 7(1), 1. |
| [39] | Merem, E. C. (2018). Assessing Renewable Energy Use In Ghana: The Case of the Electricity Sector. Energy and Power, 8(1), 1-17. |
| [40] | Merem, E. C. (2017). Assessing the ecological effects of mining in West Africa: The case of Nigeria. International Journal of Mining Engineering and Mineral Processing, 6:(1), 1-19. |
| [41] | Innes. John. (2020). Africa: Continent. Encyclopedia Britannica. Chicago, IL. |
| [42] | Merem, E. C. (2018). Assessing the Menace of Illegal Wild Life Trade In the Sub Saharan African Region. Advances in Life Sciences, 8(1), 1-23. |
| [43] | Visual Capitalist. (2015 December) Infographic: Visualizing Chinese Investment in Africa. Base Metals Battery Metals Energy. |
| [44] | Cannon, John. (2018 August) US demand for Chinese furniture linked to deforestation in Africa. Mangabay/ Eco-business. Online Available: https://www.eco-business.com/news/us-demand-for-chinese-furniture-linked-to-deforestation-in-africa. |
| [45] | Tabate, Shunsuke. (2018 September). China Turns To Africa To Mitigate Impact of US Trade War. Nikkei Asian Review. 1-6. |
| [46] | Wang, Chaorong. (2018 April) Understanding The Top Sectors For Chinese Foreign Aid To Africa. The Borgen Project.1-3. |
| [47] | Merem, E. C. (2020). Exploring Cocoa Farm Landuse Trends in The West African Region. International Journal of Agriculture and Forestry. 10(1): 19-39. |
| [48] | Yang Jiao and Deborah Brautigam (2013 June). Guest Post: Chinese Illegal Gold Miners in Ghana 2016 China Africa Research Initiative. Johns Hopkins University SAIS. |
| [49] | Matthew C. DuPée (2017 September). China Races Into West Africa’s Mineral Rush, and the Environmental Costs Rise. Online Available: https://4m.cn/6T3lW. |
| [50] | Gaworecki, Mike. (2015December). China’s Demand For Rosewood is Destroying Forests in Southeast Asia and, Increasingly, In Africa. Mongabay. |
| [51] | Merem, E. C. (2017). Assessing Ecosystem Liabilities of oil and Gas Activities In Southern Nigeria. Public Health Research, 7(1), 3-26. |
| [52] | Brookes, Peter. (2006 February). Chinese Influence In Africa; Implications For The United States. The Heritage Foundation 1-14. |
| [53] | Hurst, Cindy (2008 September). China's Oil Rush in Africa – Nigeria. Alexanders Gas and Oil Connections. An Institute For Global Energy Research Online Available: http://gasandoil.com/news/africa/9b30ee10c1625d74b883bf35e951c77a. |
| [54] | Braudgam, Deborah. (2010 August). The Real Cost of Chinese Railway Construction In Nigeria. China In Africa The Real Story. Johns Hopkins University School of Advanced International Studies. DC: Washington. |

 Abstract
 Reference
 Full-Text PDF
 Full-text HTML