-
Paper Information
- Paper Submission
-
Journal Information
- About This Journal
- Editorial Board
- Current Issue
- Archive
- Author Guidelines
- Contact Us
World Environment
p-ISSN: 2163-1573 e-ISSN: 2163-1581
2020; 10(2): 45-51
doi:10.5923/j.env.20201002.02

A Survey of Household Solid Waste Practices in Barnawa District, Kaduna, Nigeria
 Abstract
 Reference
 Full-Text PDF
 Full-text HTML
Fanan Ujoh1, Martyn Clark2, Stephen Hemba3, Adebola Adenekan4
1Centre for Sustainability and Resilient Infrastructure and Communities (SaRIC), London South Bank University, United Kingdom
2Max Lock Centre, University of Westminster, London, United Kingdom
3Department of Geography, University of Nigeria, Nsukka, Nigeria
4Max Lock Consultancy Nigeria, Kaduna, Nigeria
Correspondence to: Fanan Ujoh, Centre for Sustainability and Resilient Infrastructure and Communities (SaRIC), London South Bank University, United Kingdom.
| Email: |  |
Copyright © 2020 The Author(s). Published by Scientific & Academic Publishing.
This work is licensed under the Creative Commons Attribution International License (CC BY).
http://creativecommons.org/licenses/by/4.0/

The Barnawa district’s settlement pattern is made up of several households in a set of built houses generally regarded as compounds. A semi structured questionnaire was self-administered to a total of 166 households in 105 compounds in Barnawa districts. The compounds were selected through multilevel sampling procedure involving convenient and random techniques. Findings showed in general, households in Barnawa would be willing to pay for improved solid waste management (SWM) services irrespective of household size or their relative wealth-status as measured. However, willingness to pay for improved SWM services was generally common among households least satisfied with the current service they receive. Also household size, location of a household in relation to an existing official solid waste collection point are observed to be major drivers of how much households are willing to pay for improved SWM services in the district.
Keywords: Waste management practices, Improved solid waste management services, Willingness to pay, Household
Cite this paper: Fanan Ujoh, Martyn Clark, Stephen Hemba, Adebola Adenekan, A Survey of Household Solid Waste Practices in Barnawa District, Kaduna, Nigeria, World Environment, Vol. 10 No. 2, 2020, pp. 45-51. doi: 10.5923/j.env.20201002.02.
Article Outline
1. Introduction
- The problem of solid waste management (SWM) is a major issue in urban governance [1]. Different models have been designed to deal with the problem; some of these models include free waste management services provided by governments across many cities, especially in developing countries. It involves the collection, transportation and disposal of waste from residents within the urban area without any fee charged. A second model is the system where those who generate waste are made to pay for waste collection, transportation and disposal services provided. In the third model, which is still evolving in many cities in developing countries including Nigeria, is a combination of the free and paid waste management services [2,3]. This model evolved out of the apparent failure of the public system to sustain the free waste management system. In urban centres where free waste services are provided by the government in Nigeria including Kaduna, heaps of wastes are a common site along roads, streets and other open spaces. This happens because the waste management authority is often unable to satisfactorily deal with the quantity of waste generated [4]. Various reasons have been identified including poor funding, inadequate and untrained personnel, absence of waste infrastructure and technology to manage waste effectively and efficiently. This has resulted into dirty looking urban spaces, with waste adorning the streets and constituting serious health risk to urban neighbourhoods [5]. As a result, many private initiatives involving individuals or organisations have taken up the task to provide waste management services at specific fees. Interestingly, this is practised under both formal and informal arrangements [6]. The formal arrangement connotes that there are institutional provisions with definable mode of operations while the informal arrangement connotes that it is practiced under no identifiable institution provisions involving permits and other practice regulating instruments [1]. However, there appear to be a consensus among practitioners and scholars that the most sustainable waste management model in urban settlements is the model that requires residents to pay for waste management services provided [7]. This generally aligns with the global thinking and the “polluter pays principle” of environmental management. And the thinking of many governments of developing countries is shifting to adopting this approach. There are ongoing reforms across many urban centres seeking to improve services by adopting the recognised sustainable options of waste management [8,9]. However, especially for countries like Nigeria, the push towards privatization represent the current economic climate of the country yet private participation in waste management services will depend entirely on the willingness of residents to pay for services provided. This will drive the sector towards profit and ultimately lead to efficient service provision. However, the willingness to pay for SWM is not sufficiently understood in Nigeria. Attempts at examining the willingness to pay for SWM associated the willingness to pay with household characteristics like household size, income, education, age and quantity of waste generated [10,11,12,13,14,15] as well as in urban and semi-urban areas [16]. However, little is known about the relationship between neighbourhood’s characteristics and the willingness to pay for SWM. Although urban planning tries to zone residencies according to specific characteristics, this has not evolved sufficiently in Nigeria to the point of creating neighbourhoods with homogenous household characteristics and practices. As a result, it is important to examine practices in context and time. This study therefore, was designed to examine how the location of households influences willingness to pay for waste management services.
2. Methodology
2.1. The Study Area - Barnawa District
- Barnawa District represents an interesting case-study for studying domestic SWM practices and the willingness to pay among households located in specific urban neighbourhoods. Barnawa is predominantly a residential district of the city with a range of settlement types; formally laid, low density, and tightly packed, higher density development in the core areas of the district (Figure 1). The District is located south of the Kaduna River, which forms the District’s northern boundary. The city’s ring road bounds the southern boundary. As such there is a great deal of open, undeveloped land in the north of the district abutting the Fadama. Physically the greater part of the area consists of government layouts or housing schemes with some informal developments around the old settlement and market. On a socio-economic level, Barnawa is representative of a middle class professional society and consistently rates higher than other Districts of Kaduna in these qualities [17].
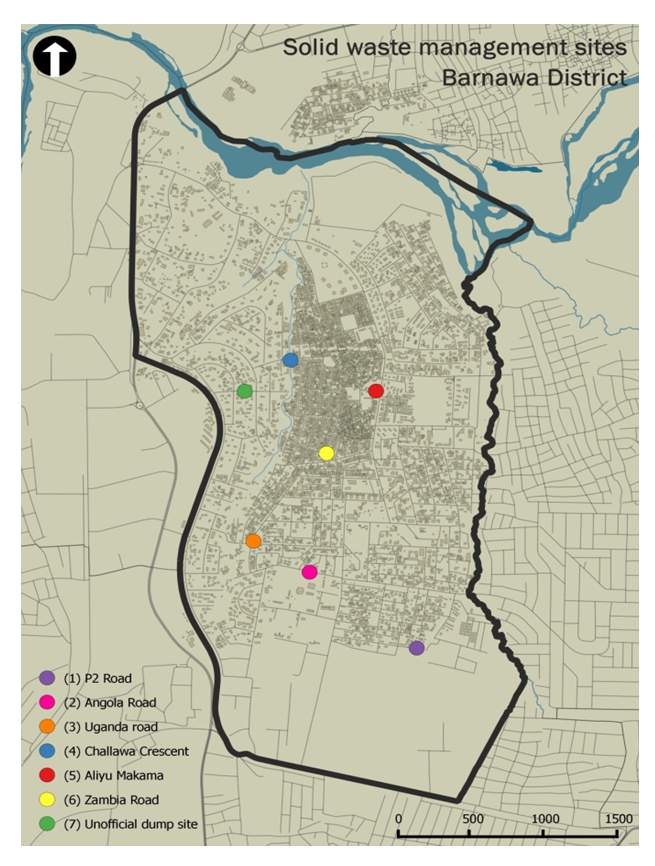 | Figure 1. Settlement Densities in Barnawa District |
2.2. Survey Design
- The survey design involving the collection of primary data across sampled households was used to carry out this study. Given the general scarcity of demographic, socio-economic and land-use data for most cities in sub-Saharan African, the existence of a comprehensive land-use and representative sample household interview dataset for the Greater Kaduna area provides a unique entry point to the survey design into household-level SWM. The household was taken as the unit of measurement for the survey. The Barnawa district settlement pattern is made up of several households in a set of built houses generally regarded as compounds. To identify the number of household per compound, a two-stage, ‘group randomised trial’ method of sampling was adopted. A number of compounds were selected at random and subsequently all households within these compounds were interviewed. This was seen as a reasonable selection method particularly given the potential inaccuracy not to mention ethical challenges of drawing a random sample of households from within a compound.
2.3. Sample Size/Sampling Procedure
- The multi-level sampling procedure involving convenient and random techniques was adopted for the study. First, a total of 105 compounds were conveniently chosen as the sample size. This was chosen because experience in conducting household surveys involving compounds in Nigeria has shown that it should be possible to visit between 100-110 compounds for the purpose of a survey. To identify the specific compounds for the study, a geo-referenced dataset containing the location of all known residential compounds in Barnawa was used to select these compounds at random using Quantum GIS (open source GIS software) to generate the random sample of compounds. Quantum GIS uses the Python programming language algorithm random.py library to return a random list of unique compounds chosen from the total population list of compounds in Barnawa. This follows a random sampling ‘without replacement’ technique akin to drawing numbers for a lottery. The sample was then translated into paper ‘map sections’ covering several ‘street blocks’ for field data collection. A street block represents an area of development surrounded by motor vehicle width public right of way access.
2.4. Data Collection
- A set of semi structured questionnaire was designed especially for the study. This was designed to draw out information from respondents along the general lines of enquiry set out in the research. The survey form itself is broken down into five main topic areas: General household characteristics; Willingness to pay; and, Socio-economic characteristics. The questionnaire was administered using face-to-face interviews with data captured on paper questionnaire forms with the help of research assistants and the households were visited within two weeks of the commencement of the survey.
2.5. Results and Discussion
2.5.1. Payment and Demand for Solid Waste Management Services
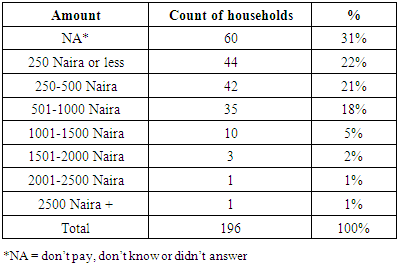
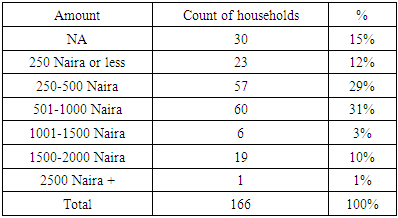
- Households representing 69% of households in Barnawa indicated that they were paying a contractor for SWM services. Among those who were paying, 60% paid an individual, while the other 40% of households paid a ‘private company’. It is assumed that in this case the ‘private company’ would be a State Government licensed operator, whereas an individual would be an unlicensed individual carrying out business informally. This finding is consistent with the findings by [3] in a study in waste management in Lagos, that waste management involving private operators is very popular among urban residents. The amounts different households paid varied from under 250 Naira per month to up to 6,000 Naira a month (Table 1). On average (median), households spent around 400 Naira per month on SWM services (mean average = 585 Naira/month; modal spend of 200 Naira/month).
|
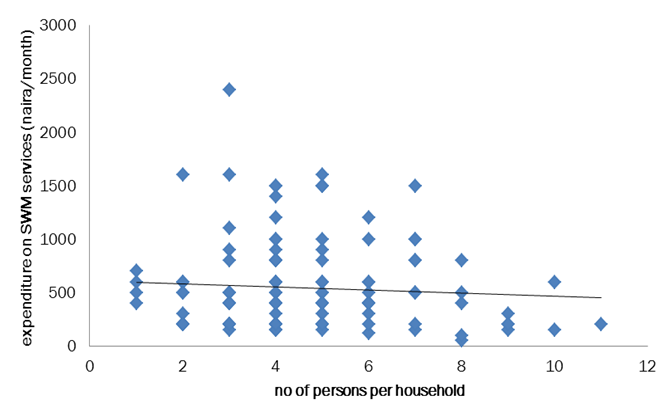 | Figure 2. Household size compared to expenditure on SWM (Naira/per month) |
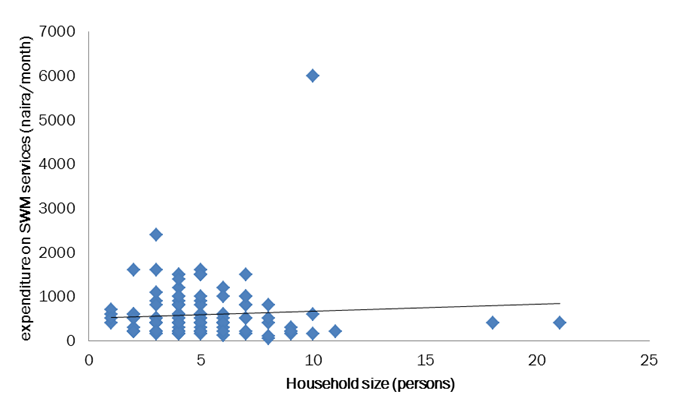 | Figure 3. Household size compared to expenditure on SWM (Naira/per month) – outliers removed |
2.5.2. Clustering Effect of Households Living on the Same Compound
- Some clustering of behaviour in SWM is observed between households occupying the same compound. When considering the degree of clustering of behavioural patterns between households within the same compound, the amounts different households pay a SWM contractor was compared. Of the thirty three compounds where more than one household was found, twenty-eight of them contained households that paid for SWM services. In majority (75%) of these compounds, all households paid the same as the other households living on those compounds for SWM services. The remaining 25% of compounds where the amounts that individual households paid differed, the differences were generally within 100 or 200 Naira (Figure 4).
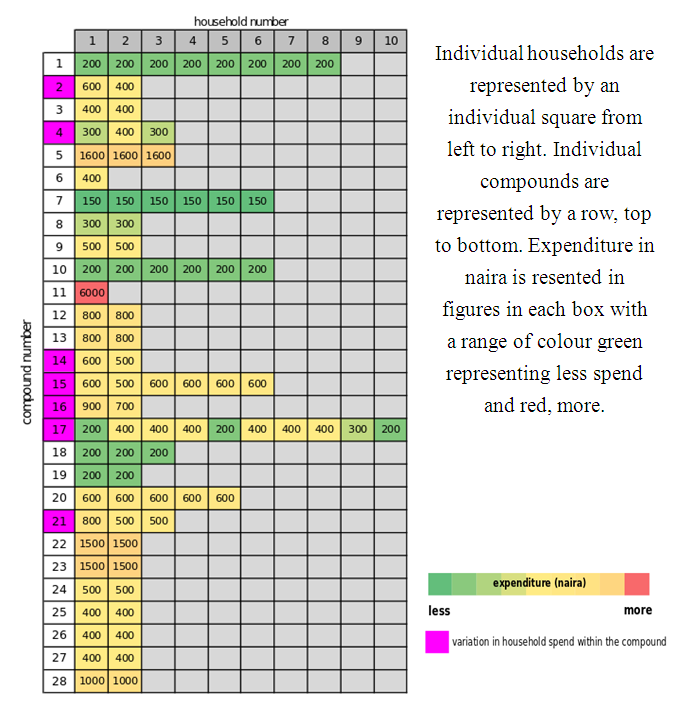 | Figure 4. Monthly expenditure on SWM per household as grouped by compound on which multiple households live |
2.5.3. Spatial Location and Expenditure on SWM Services: Mapping Monthly Expenditure
- When analysing the amounts households spend on SWM services by their location, a heat map is useful in picking out certain ‘hotspots’ which represent locations where greater expenditure on SWM services was recorded (Figure 5). From the map below, the ‘hotspots’ tend to appear in the lower density, high-income areas of Barnawa. This correlation is fairly strong although there are clearly a few exceptions where hotspots of expenditure also appear in the highest density areas.
 | Figure 5. Monthly expenditure on SWM services against distance from an official collection point |
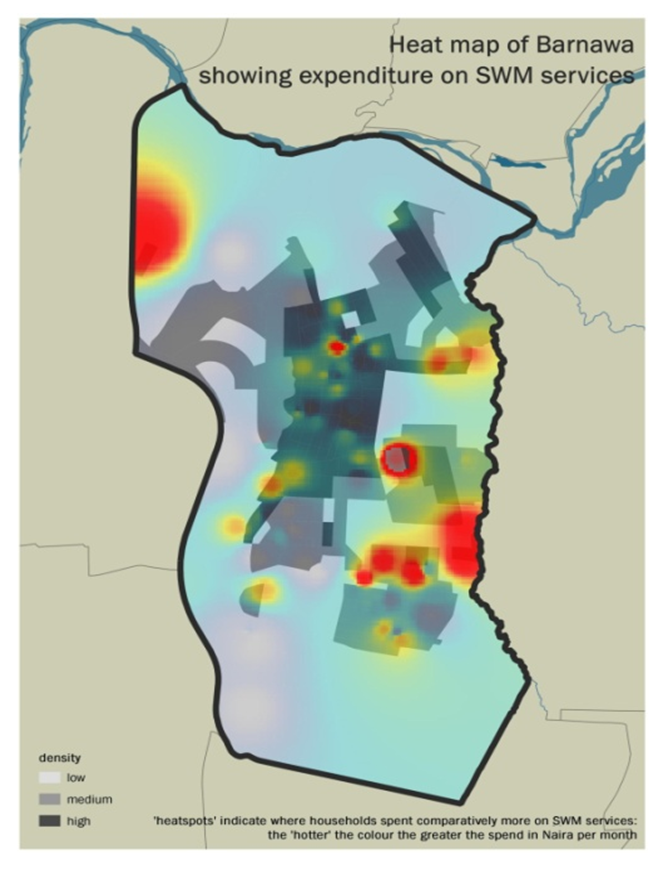 | Figure 6. Heat map showing ‘hotspots’ of greater expenditure on SWM services |
2.5.4. Willingness to Pay for Improved Services
- When asked if they would be prepared to pay for improved SWM services, on average 85% of households said yes. This is consistent with the findings of [18] in Ghana and [19] in Enugu and Kano cities where a higher number of households indicated a willingness to pay for improved services, and disagrees with the findings of [16] which reported that majority of the households were unwilling to pay. On average, households answering ‘yes’ said they would be prepared to pay 600 Naira a month (median); 500 Naira/month (mode) for improved SWM services. Grouped frequencies of a household’s willingness to pay are shown in Table 2.
|
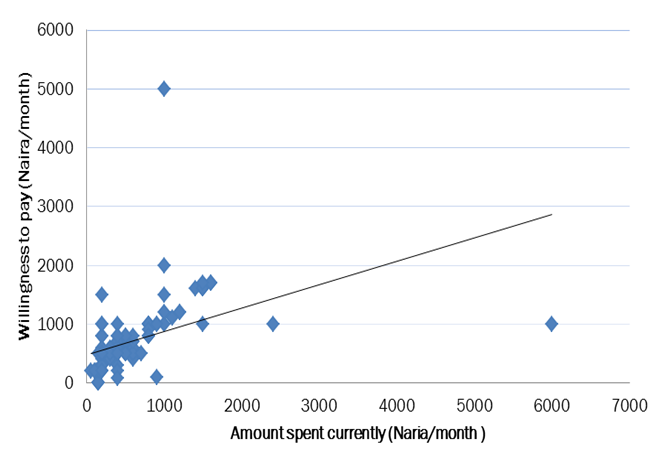 | Figure 7. Current household expenditure on SWM services against willingness to pay for improved solid waste management services |
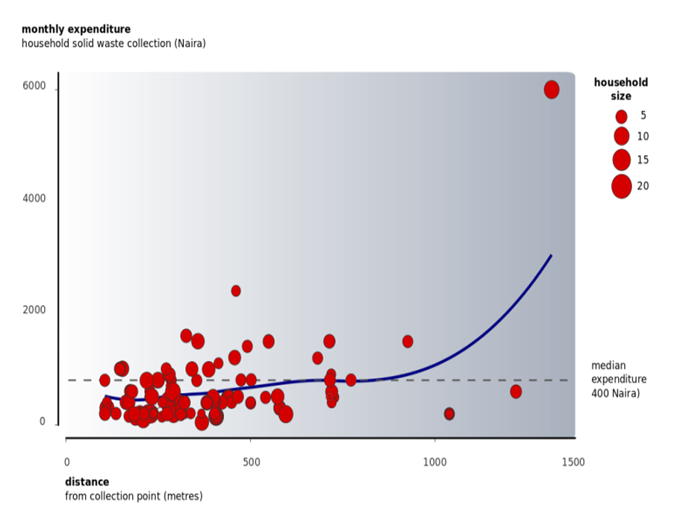
2.5.5. Distance to a Collection Point
- A household’s willingness to pay for improved SWM services appears to be positively correlated with how far they live from an existing official collection point (Figure 8). This could suggest that a household is aware of the cost of transporting waste and therefore, is willing to pay more – or it could be that those that already pay know how much it costs, based on what contractors currently charge and have purely stated what they think to be a reasonable cost for transporting solid waste based on what they currently know.
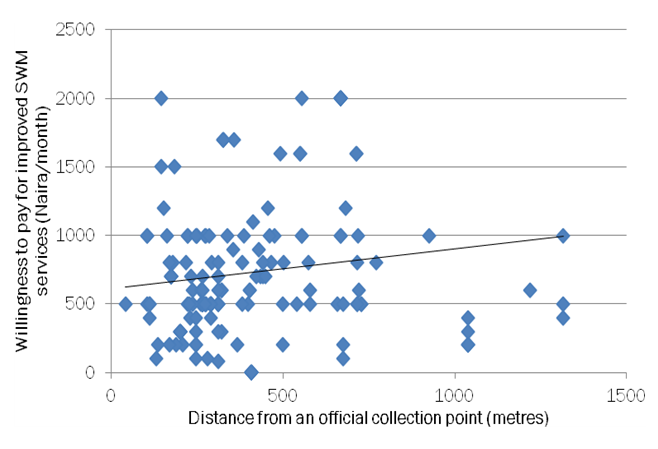 | Figure 8. Household willingness to pay for improved SWM services versus distance from an existing collection point |
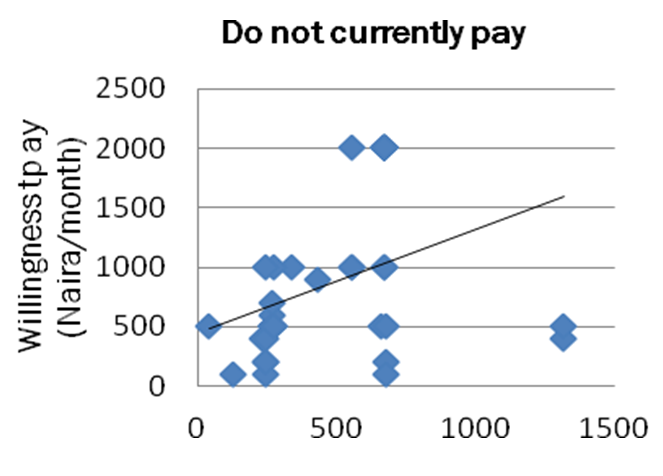 | Figure 9a. Willingness to pay for SWM services against distance to a collection point |
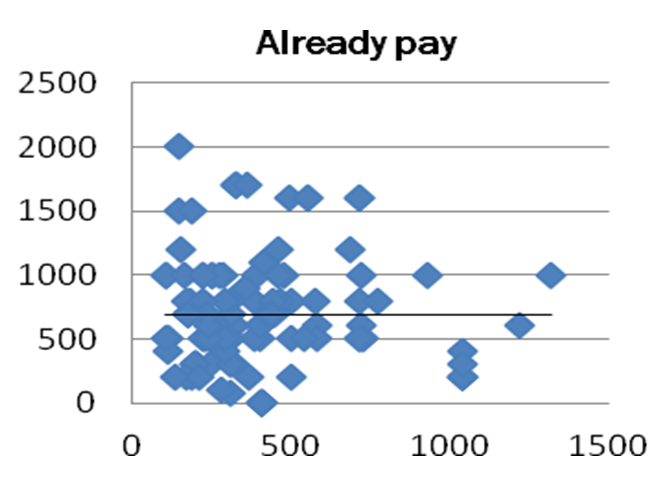 | Figure 9b. Willingness to pay for SWM services against distance to a collection point |
2.5.6. Household Size
- The size of the household and therefore, the amount of waste that is generated may also be a contributing factor to a household’s perceptions and a willingness to pay for improved SWM services. Figure 10 shows a negative correlation between household size and a willingness to pay. This may suggest that where there are more mouths to feed, a household may be less willing to pay for SWM services, perhaps household’s income is required for other purposes. This relationship is not particularly strong however, and equally from the supply side of the equation it would be useful to know whether a SWM contractor would base calculations for costs of delivery of SWM service on the size of the household and therefore the amount of waste being produced.
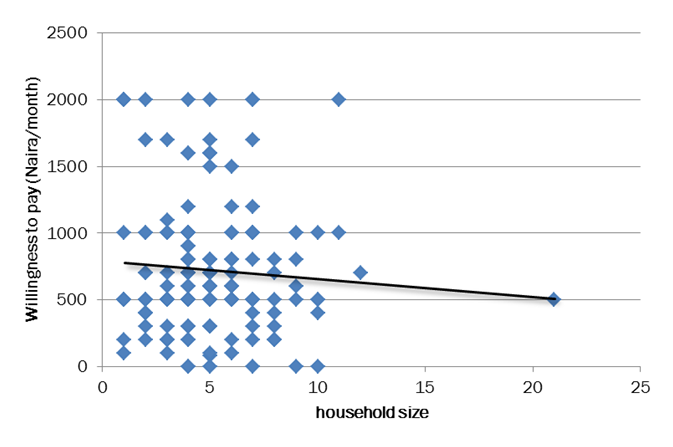 | Figure 10. Willingness to pay for improved SWM services versus household size |
3. Conclusions
- Household size and the location of household in relation to an existing official solid waste collection point may be drivers for what a household is willing to pay for improved SWM services. However, this may be limited to what those who have no current relationship with a waste contractor perceive as influencing the cost of such a service. In general, households in Barnawa would be willing to pay around 500 Naira per month for improved SWM services irrespective of household size or their relative wealth-status as measured by an asset-based index.Encouraging households to pay (or pay more) for improved services may realistically only be brought about where it can be demonstrated that residents are indeed receiving an improved service e.g. where the value is added to the existing service or where it can be demonstrated that there would be positive benefits to either environmental or public health. The importance of devising a payment system for SWM services which reflects the amount of waste actually being produced should be encouraged. It will also help enforce a consideration at the household-level that there is a cost to be borne with producing waste, and equally a value should be attached to some forms of waste which may incentivise waste reduction and separation for recycling.The following recommendations are pertinent arising from the findings of this study, that a further study involving private contractors be conducted to establish how they determine an appropriate cost for a household collection. This would need to be considered prior to any further work on establishing an appropriate charging regime for SWM services. Presumably, market forces dictate an appropriate charge for collection based on either the amount of waste produced (a product of household size and/or household wealth) and/or the distance this waste must be transported before eventual disposal.
Disclosure
- This article is drawn from one of several studies conducted under the DfID-funded Nigeria Infrastructure Advisory Facility Phase 2 (NIAF2) Project No. UH0002. The NIAF2 Project ran from January 2012 to December 2016.