Melaku Zigde Haile, Endale Tsegaye Mohammed
Chemistry Department, College of Natural and Computational Science, Hawassa University, Hawassa, Ethiopia
Correspondence to: Melaku Zigde Haile, Chemistry Department, College of Natural and Computational Science, Hawassa University, Hawassa, Ethiopia.
| Email: |  |
Copyright © 2019 The Author(s). Published by Scientific & Academic Publishing.
This work is licensed under the Creative Commons Attribution International License (CC BY).
http://creativecommons.org/licenses/by/4.0/

Abstract
The research aimed to evaluate the current water quality status of Lake Hawassa in order to identify potential pollution sources, and put in place monitoring programs. Eleven potential sampling sites were included in the study. Water quality parameters, such as total dissolved solid (TDS), pH, temperature, conductivity, turbidity, dissolved oxygen (DO), five day biological oxygen demand (BOD5), total hardness as CaCO3, total alkalinity as CaCO3, nitrate, sulphate, orthophosphate, fluoride, K, Mg, Cu, Cd, Cr, Fe, Mn, Pb, and Zn were determined and compared with WHO standards. The results were compared with the WHO and FAO standards. And the values of TDS (381.7 to 1286.0 mg/L), SC (733.7 to 2151.3 µS/cm), turbidity (8.20 to 87.3 NTUs), BOD5 (4.02 to 76.2 mg/L), phosphate (0.348 to 1.90 mg/L), fluoride (11.6 to 17.5 mg/L), chromium (0.173 to 0.665 mg /L), manganese (0.133 to 1.83 mg/L), and copper (1.40 L to 18.2 mg/L) were found above the prescribed limit of WHO guidelines for drinking purposes, while all the analysed water quality parameters were fall within the FAO standard limit for irrigation purposes. These suggested that both point and non-point pollution sources such as human sewage, industrial waste from ceramics, textile, plastics and food processing industries, urban stormwater, agricultural runoff and land development were impacting the lake. Thus, mitigation measures should be put in place to prevent the Lake from further deterioration.
Keywords:
Water pollution, Water quality parameters, Toxic metals
Cite this paper: Melaku Zigde Haile, Endale Tsegaye Mohammed, Analysis of Physico-chemical Characteristics of Water Collected from Different Sampling Sites of Lake Hawassa, Ethiopia, World Environment, Vol. 9 No. 2, 2019, pp. 38-45. doi: 10.5923/j.env.20190902.02.
1. Introduction
Water is an indispensable and basic element that supports life and the natural environment, a prime component for industry, a consumer item for human beings and animals, and a vector for domestic and industrial pollution. Access to adequate water for domestic purposes, irrigation, sanitation, and solid waste disposal are the four basic needs that impact significantly on socioeconomic development and the standard of life. According to the handbook of integrated water resources management [1], in general urbanization, industrialization, agricultural activities, and tourism, as well as population growth,-and changes in climate and lifestyle, put increasing constraints on water resources and ecosystems. Ethiopia is endowed with a number of lakes and large rivers, which give immense value to the overall economic development. For instance, the country has twelve river basins, eleven fresh lakes, nine saline lakes, four crater lakes and over twelve major swamps/wetlands. The Rift Valley Lakes Basin (RVLB) is a hydrologically closed basin, characterized by terminal lakes; those with no surface water outlet. Four of the seven main lakes of the RVLB are terminal in themselves, and those that are not (Ziway, Langano and Abaya) flow into terminal lakes and are thus part of a terminal lake system. Ethiopian Rift Valley Lakes have significant environmental, economic and cultural importance to the region [2]. Among freshwater resources, Lake Hawassa is one of the major Rift Valley lakes in Ethiopia and is used for various purposes by semi-urban and urban dwellers [3,4]. It is considered to be the livelihood of all business created along the shore and plays a great role in tourism, investment, and biodiversity conservation. However, the lake faces a high risk of pollution as a result of natural activities, such as erosion and heavy rainfall, and anthropogenic activities, such as urbanization, intense agriculture, rapid industrialization, growth of population, urban runoff and municipal waste, overfishing, grass cutting along the shores, car washing on the lakeshore, and horticultural farming on the lakeshore [4-7]. Thus, the aim of the study was to assess the current pollution status of the Lake and identify major types of pollution in order to carry out appropriate measure.
2. Materials and Methods
Description of the study areaThis study was carried out in Lake Hawassa, one of the major Rift Valley lakes with a closed basin feature that receives one perennial river from the eastern escarpment, TikurWuha River. It is located between 06°58′ to 07°14′ North latitudes and 38°22′ to 38°28′ East longitudes with an elevation of 1680 meter above sea level. It has a total surface area of 90 km2 and a drainage area of 1250 km2 [8]. Sampling, Sample preparation and AnalysisA total of eleven sampling sites were selected based on information available about the sampling sites as shown in Figure 1. The selected sampling sites code, name, and geographical locations are shown in Table 1.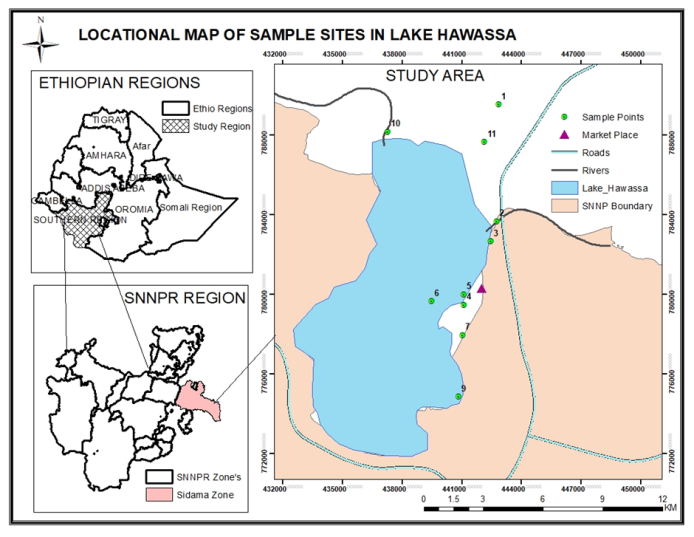 | Figure 1. Location map of sample sites in Lake Hawassa |
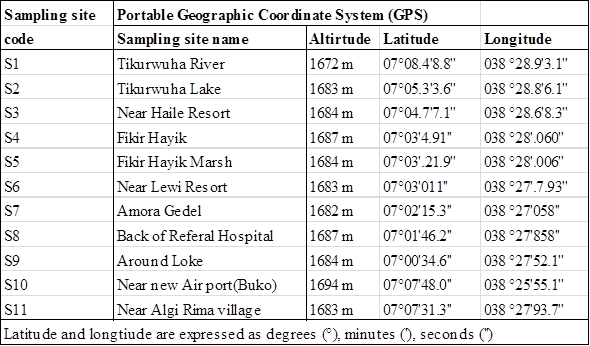 | Table 1. Sampling sites code, names, and geographical locations of Lake water samples |
A total of twenty two water samples were collected from the selected sampling sites during the wet season (July and August) in 2018. The samples were collected in one litre capacity plastic bottles after they had been thoroughly rinsed with the sample and preserved airtight to avoid evaporation. Physical parameters such as total dissolved solids (TDS), SC, and temperature were determined in situ using a Wagtech Conductivity-/-TDS Meter. Dissolved oxygen was also determined in situ using a HANA Model HI 9143 Dissolved Oxygen meter. Turbidity and pH were determined onsite using a Wagtech turbidimeter, and a pH meter, respectively. These samples were kept refrigerated prior to the analysis of nutrients, major ions and trace metals. Major ions’- such as K+ and Mg2+ and trace metals such as iron were determined using Photometer 7100 integrated with the Palintest system of water analysis, which uses a reagent systems in tablet or liquid tubetests that react with metal ions to produce either a color or turbid solution so that direct readings in concentration units is possible. Nutrients such as NO3-, SO42-, PO43- and F- were determined using Photometer 7100 integrated with the Palintest system of water analysis. Total alkalinity and total hardness measurements were carried out by acid titration with 0.02 N H2SO4 and ethylenediamine tetra acetic acid (EDTA) titration, respectively. For the analyses of trace metals such as Mn, Cu, Zn, Cr, and Pb, 100.0 mL of unfiltered water sample was taken in a beaker and heated until the volume of the sample solution reached 20.0 mL. Then, the sample solution was cooled and acidified with 2.0 mL of concentrated nitric acid and made up to the mark with deionized water. Then, the analyses were completed using an atomic absorption spectrophotometer (Buck Scientific, Model 210 VGP Atomic absorption spectrophotometer, USA).Statistical Analysis Descriptive statistics for the selected physic-chemical water quality parameters were carried out. And a one-way ANOVA analysis with a post hoc multiple comparisons (Tukey’s test) were used to compare the mean values of results obtained for each sampling sites. The results were compared with WHO and FAO standards.
3. Results and Discussion
Correlation analysisPearson's correlation coefficients between physico-chemical water quality parameters are summarized in Table 2. 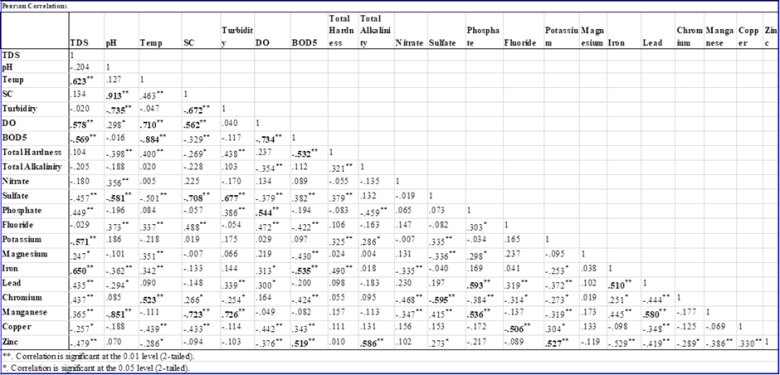 | Table 2. Pearson correlation coeficiente matrix of the physico-chemical water quality parameters |
It can be seen that TDS (r > 0.85) had a significant positive correlation with temperature. This might be due to an increase in the rate of chemical reactions, evaporation, and volatilization of substances in the water that could concentrate dissolved substance in the water resulting in a high level of TDS. TDS and temperature also exhibited negative correlations with BOD5. For instance, in warm waters, respiration rates increase leading to increased oxygen consumption and increased decomposition of organic matter [9]. This might also be explained as a result of anthropogenic activities such as open dumping of waste into the Lake that can increase the biological oxygen demand for depletion of DO [10]. pH had a significant positive correlation with specific conductance and this could be due to the dissolution of carbon dioxide and nutrients that increases the specific conductance, released during bacterial break down of organic wastes [11]. Also high specific conductance results from the dissolution of nutrients trapped in plant parts in acidic water conditions which were probably due to the discharge of untreated effluent containing organic waste [12].Physical parameters of Lake HawassaTwenty two physicochemical parameters were determined during this study and the mean concentrations of the selected physical parameters at the sampling sites were shown in Table 3.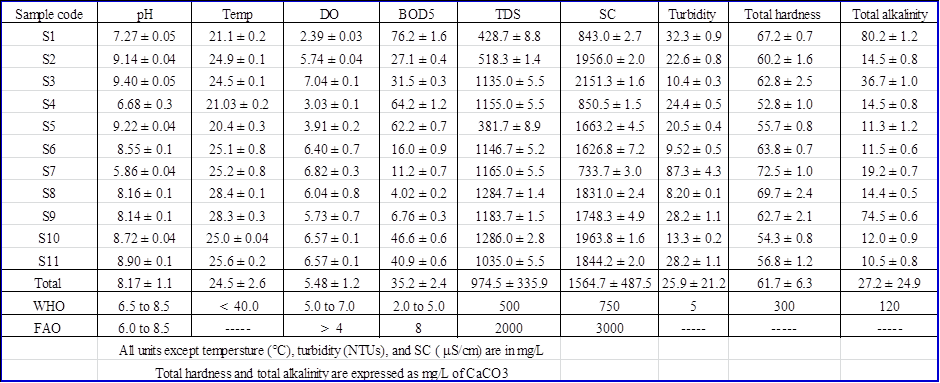 | Table 3. Mean concentration (mean ± SD in mg/L, n=6) of selected physical parameters |
pHpH values vary from a minimum of 5.86 ± 0.04 and a maximum of 9.40 ± 0.05. The average values for pH was within the permissible limit of WHO and FAO standards set for drinking and irrigation purposes. However, highest values of pH were recorded in S2, S3, and S5 and lowest value in S7. These might be due to point source pollution. Statistical analysis showed that the mean values of pH was significantly different 95% confidence level among S 1, S3, S4, S7 and the other sampling sites which might indicate point source pollution caused by chemicals that might come from agricultural runoff, wastewater discharge or industrial runoff in these sampling sites of the Lake.TemperatureWater temperature obtained during the sampling period for all sites did not differ significantly at 95% confidence level and water temperature varies from 20.4 ± 0.31°C to 28.4 ± 0.13°C, with an overall mean value of 24.5 ± 2.59°C and it was considered lower as compared to WHO maximum permissible limit (WHO, 2008). However, relatively high temperature values were recorded at S8 (28.4 ± 0.133°C) and S9 (28.3 ± 0.266°C). These might be due to agricultural runoff and deforestation along the lake and municipal effluents Nonetheless, temperature of Hawassa Lake water is likely suitable for aquatic lives.Dissolved oxygen (DO)DO values in the present study ranges from 2.39 ± 0.03 to 7.04 ± 0.1 mg/L, with an overall mean concentration of 5.48 mg/L. The findings also indicated that at 95% confidence level, there were a significant difference among S1, S5 and the other sampling sites. The lowest DO values were recorded at S1 (2.39 ± 0.031 mg/L), S4 (3.03 ± 0.095 mg/L), and S5 (3.91 ± 0.170 mg/L). These might be due to decomposing organic matter, dissolved gases, industrial waste, mineral waste and agricultural runoff and this might adversely affect aquatic life [13]. However, the overall mean concentration of DO value was within the permissible limits set by WHO and FAO standards.Day-5 Biological oxygen demand (BOD5)Biological oxygen demand (BOD5) value in the present study ranges from 4.02 ± 0.21 mg/L to 76.2 ± 1.6 mg/L. The values of BOD5 except for S8 and S9 were higher than the recommended values of FAO. At 95% confidence level, there is a significant difference within the sampling sites, highest being at S1 (76.2 ± 1.60), S4 (64.2 ± 1.18), and S5 (62.2 ± 0.719) and the mean values of BOD5 was 35.2 mg/L. This indicates high levels of organic pollution due to discharge of domestic waste from the city and other human activities and agricultural fertilizers brought by the runoff. Increased levels of BOD decrease the dissolved oxygen content of lake water [14].Total dissolved solids (TDS)The total dissolved solids of Lake Hawassa at the sampling sites range from 381.7 ± 8.9 mg/L to 1286.0 ± 2.83 mg/L and the overall mean value was 974.5 mg/L and this was higher than the standards given by both WHO and FAO. For all the other sampling sites, except for S1 and S5, the average value of TDS exceed the maximum permissible limits of WHO for the drinking purpose but within the limit given by FAO for irrigation water. Excessive total dissolved solids can be toxic to aquatic life through increases in salinity or changes in the composition of the water. Primary sources for higher TDS in the Lake water might be due to agricultural runoff, discharge of domestic waste from the town and other human activities like washing of clothes or different vehicle at and around the lake.Specific conductivity (SC)The specific conductivity of Hawassa Lake range from 733.7 ± 3.01 µS/cm to 2151.3 ± 1.63 µS/cm and the overall mean value was 1564.7 µS/cm. and this was higher than WHO standards for drinking purposes and lower than FAO standard for irrigation. The sampling sites were significantly different at 95 % confidence level. The lowest SC value was recorded at S7 (733.7 ± 3.01 μS/cm) and the highest were recorded at S3 (2151.3 ± 1.63 μS/cm), S10 (1963.8 ± 1.60 μS/cm) and S2 (1956.0 ± 2.000 μS/cm) respectivelly. The increased conductivity at S2, S3, and S10 sampling sites might be due to agricultural runoff or a sewage discharge, and the decrease in conductivity at S7 might be due to an oil spill or addition of other organic compounds from the fish market near the sampling site. In both cases, the values of conductivity indicated pollution of Lake water.TurbidityThe turbidity value of the sampling sites range from values from 8.20 ± 0.12 NTUs to 87.3 ± 4.26 NTUs and the overall mean value was 25.9 NTUs. These indicated high turbidity of the lake and higher than WHO standard for drinking purposes. These might be due to the development of an algal bloom on a lake, or a steady increase in suspended sediment due to a polluted tributary and surface runoff.Total HardnessTotal Hardness values range from 52.8 ± 0.98 mg/L CaCO3 to 72.5 ± 1.05 mg/L CaCO3 and the overall mean was 61.7 mg/L CaCO3. Thus, the recorded values of total hardness for all sampling sites were within the permissible limit of WHO standard. This is related to the absence of limestone rock in the study area.Total AlkalinityTotal alkalinity values range from 10.5 ± 0.837 mg/L CaCO3 to 80.2 ± 1.17mg/L CaCO3 and the overall mean was 27.2 mg/L CaCO3. Thus, the recorded values of total alkalinity for all sampling sites were within the permissible limit of WHO standards. However, highest value of total alkalinity were recorded at S1 (80.2 ± 1.1717 mg/L CaCO3) and S9 (74.5 ± 0.548 mg/L CaCO3). And these might be due to waste discharge and microbial decomposition of organic matter in the sampling sites.Nutrients and major metal concentrations of Lake HawassaThe mean concentrations of the selected nutrient and major and essential metals concentration were shown in Table 4.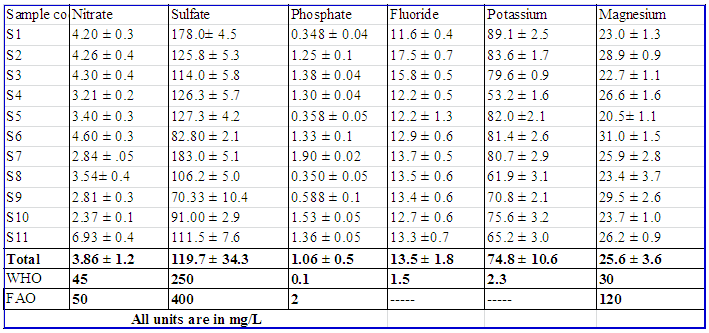 | Table 4. Mean concentration (mean ± SD in mg/L, n=6) of selected nutrients and major metal concentrations |
NitrateThe concentration of nitrate range from 2.37 ± 0.087 mg/L to 6.93 ± 0.419 mg/L and the overall mean was 3.86 mg/L. And these values were within the limit of WHO and FAO standards showing that the lake was less polluted by nitrogenous materials. However, highest concentration of Nitrate-nitrogen was recorded at S11 (6.93 mg/L) and this could be due to agricultural runoff and certain industrial wastes.SulphateThe concentration of sulphate range from 70.33 ± 10.4 mg/L to 183.0 ± 5.06 mg/L and the overall mean was119.7 mg/L. And these values were within the limit of WHO (2008) and FAO standards. However, highest concentration of sulfate was recorded at S7 (183.0 ± 5.06 mg/L) and S1 (178.0± 4.47 mg/L). And these could be related to the discharge of sulphate containing municipal sewages and surface runoff that contain organic fertilizers from agricultural activities.OrthophosphateThe concentration of orthophosphate range from 0.348 ± 0.04 mg/L to 1.90 ± 0.02 mg/L and the overall mean was 1.06 mg/L. Highest concentration of orthophosphate was recorded at S7. And these values were higher than the limit of WHO standards [15] and lower than FAO standards [16]. These could be due to pollution from domestic sewages, surface runoff from phosphate containing fertilizers and certain industrial wastes that led to eutrophication.FluorideThe concentration of fluoride range from 11.6 ± 0.42 mg/L to 17.5 ± 0.71 mg/L and the overall mean was 13.5 mg/L. And these values were exceeded WHO limit for drinking purpose. The high levels of fluoride content recorded in the Lake waters could indicate pollution by sewage, industrial waste or seepage of ground water into the Lake. Potassium and MagnesiumIn the present study, concentration of potassium range from 53.2 ± 1.56 mg/L to 89.1 ± 2.54 mg/L with an overall mean concentration of 74.8 mg/L. This value is higher than WHO (2008) standard. According to [17], the highest level of potassium might be due to the effect of hospital effluents, septic system, and other anthropogenic activities apart from the natural sources. Magnesium contents range from 20.5 ± 1.09 mg/L to 31.0 ± 1.52 mg/L. And the recorded value for magnesium concentrations lies within the prescribed limit of WHO and FAO. However, higher concentration was recorded in S6 (31.0 mg/L) which might be due to discharge of effluent into the Lake.Selected essential and toxic trace metal concentrations of Lake HawassaThe mean concentrations of the selected essential and toxic trace metals concentration at the sampling sites were shown in Table 5. 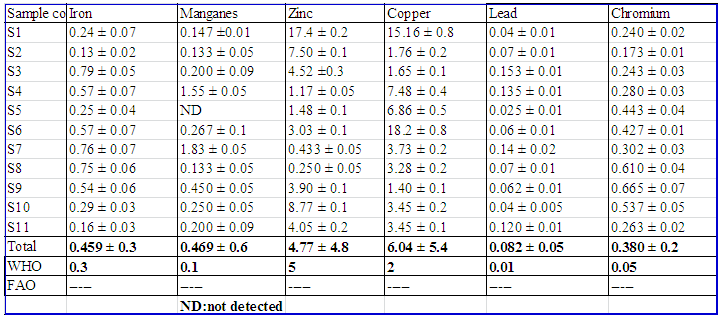 | Table 5. Mean concentration (mean ± SD in mg/L, n=6) of trace metals |
Iron and ManganeseIron concentration range from 0.13 ± 0.023 to 0.79 ± 0.049 mg/L with an overall mean concentration of 0.46 mg/L. And this value exceeded WHO limit for drinking purpose. Manganese concentration range from 0.133 ± 0.052 to 1.83 ± 0.052 mg/L with an overall mean concentration of 0.47 mg/L. Manganese was not detected in S5. However, the concentration of Mn recorded for the rest of the sampling sites exceeded WHO standard.ZincZinc concentration range from 0.250 ± 0.055 mg/L to 17.4 ± 0.175 mg/L with an overall mean concentration of 4.77 mg/L. And this value lies within the prescribed limit of WHO limit for drinking purpose. However, a higher levels of Zn were recorded in S1 (17.4 mg/L), S10 (8.77 mg/L) and S2 (7.50 mg/L), which might be due to stormwater draining from vehicle oil, grease and lubricants spill on roads, vehicle repairing and washing areas and from other consumer products into the Lake during rainfall. CopperCopper concentration ranges from 1.40 ± 0.11 mg/L to 18.2 ± 0.82 mg/L with an overall mean concentration of 6.04 mg/L. And this value exceeded WHO limit for drinking purpose. Moreover, high levels of copper were recorded at S6 (18.2 ± 0.82 mg/L) and S1 (15.16 ± 0.78 mg/L). And these might be due to incineration of waste, industrial discharge, sewage disposal and antifouling paints [14].LeadLead concentration ranges from 0.025 ± 0.006 mg/L to 0.153 ± 0.012 mg/L with an overall mean concentration of 0.082 mg/L. And this value exceeded WHO limit for drinking purpose. And these might be due to stormwater draining from vehicle oil, grease and lubricants spill on roads, vehicle repairing and washing areas and from other consumer products into the Lake during rainfall. ChromiumChromium concentration ranges from 0.173 ± 0.01 mg/L to 0.665 ± 0.07 mg/L with an overall mean concentration of 0.380 mg/L. And this value exceeded WHO limit for drinking purpose. These might be due to industrial discharge from pigments, paints, ceramic, glass and leather tanning industries. Cadmium was not detected or below the detection limit in all the sampling sites.Comparison of results with previous workIn the present study, eleven sampling sites were selected to determine the physico-chemical water quality parameters of the lake but in the previous studies ten sampling sites [18] and four sampling sites [19] were selected. The physico-chemical and biological water quality characteristic of the lake Hawassa analyzed by different researchers in different periods of time is shown in Table 6.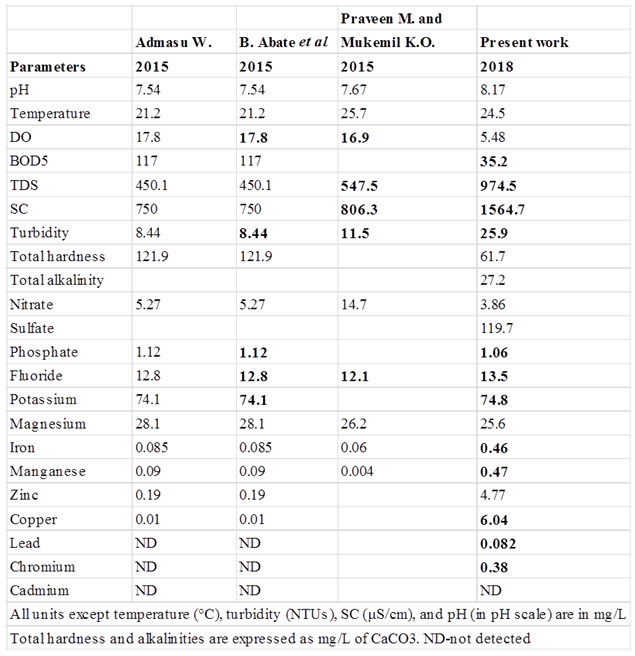 | Table 6. Mean values of physico-chemical water quality parameters of Hawassa Lake reported by researchers |
The concentration of iron, manganese, copper, lead, and chromium in the previous studies were within the permissible limit set by WHO standard or else not detected at all. However, in the present study the concentration of these metals was exceeded WHO limit for drinking purpose. These might be due to the accumulation of these metals in to the Lake through effluent discharge from ceramic, textile and leather tanning industries located along the streams that fed into TikurWuha River [20].Both in the present and previous study the concentration of potassium, phosphate, and fluoride were found to be higher than the limit of WHO standards. These could be due to effluent discharge from Hawassa Referral Hospital [18], Resorts and Hotels, domestic sewages or surface runoff from phosphate containing fertilizers. In one hand, the turbidity of the Lake exceeded WHO standard and it has shown an increase in its value. These might be due to a steady increase in suspended sediment due to a polluted tributary and surface runoff or the development of an algal bloom on a lake. On the other hand, a decreased concentration of DO was observed as time goes by. And these might be due to the decomposition of accumulated organic waste by microbial that deplete the concentration of oxygens. In all of these studies, the value of pH, temperature, total hardness, nitrate, sulphate and magnesium were found to be within the permissible limit set by WHO.
4. Conclusions
The study have shown that the Lake encounters many threats from point pollution sources such as industrial waste from ceramics, textile, plastics, leather tanning and food processing industries as it was shown with elevated levels of heavy metals and potassium and fluoride. In addition, the high levels of TDS, phosphorous, and BOD 5 might be due to effluent from Hawassa Referral Hospital, BGI Hawassa Brewery Plant or MOHA Hawassa millennium Pepsi Cola soft drink Plant. Thus, Hawassa City administration should make sure that those industries wastewater is properly treated and meets discharge limits and prohibitions. Furthermore, the lake also faces non-point source pollution caused by urban stormwater, agricultural runoff, increase of irrigation practice, over grazing, deforestation and soil erosion and land development. Hence, Hawassa City administration along with other NGOs, physical soil and water conservation measures with ultimate intention of reducing sever soil erosion and its associated impact in communal and private lands of the upper catchments of Lake Hawassa watershed should be put in place in order to rehabilitate the condition of the Lake. If these mitigation measures are not put in place, the Lake will continue to deteriorate up to the point where it can no longer support aquatic life and become dried up.
ACKNOWLEGEMENTS
We would like to express our thanks to the Rift Valley Lakes Basin Authority of Ethiopia, for their cooperation. We also thank chemistry department of Hawassa University, for supporting the research.
References
| [1] | International Network of Basin Organizations (INBO) and the Global Water Partnership (GWP) The handbook for integrated water resources management in transboundary. |
| [2] | Hart R C., “Ethiopian Rift Valley Lakes,” African Journal of Aquatic Science, 28(1):85-85, 2003. |
| [3] | Gebremedhin K., and Berhanu T., “Determination of some selected heavy metals in fish and water samples from Lake Hawassa and Ziway Lakes,” Science Journal of Analytical Chemistry, 3:10-16, 2015. |
| [4] | Zinabu G.M. and Zerihun D., “The Chemical Composition of the Effluent from Awassa Textile Factory and its Effects on Aquatic Biota,” Ethiopian Journal of Science, 25(2), 2002. |
| [5] | Abebe Y. D. and Geheb K., “Wetlands of Ethiopia: Proceedings of a seminar on the resources and status of Ethiopia's wetlands,” vi + 116pp. 2003. |
| [6] | Katie G., “Environmental Policy Review: Lake Water Management in three Ethiopian Rift Valley Watersheds,” 2011. |
| [7] | Larissa D., Mesfin M., and Elias D., “Assessment of heavy metals in water samples and tissues of edible fish species from Awassa and Koka Rift Valley Lakes, Ethiopia,” Environ. Monit. Assess, 185(4), 2012. |
| [8] | United Nations Educational, Scientific and Cultural Organization (UNESCO) World Health organization (WHO) United Nations Environment Programme (UNEP) (1996) Water Quality Assessments - A Guide to Use of Biota, Sediments and Water in Environmental Monitoring - Second Edition. pp.651. |
| [9] | Melaku G., Argaw A., Seid T., Worku L., Aynalem A., Kloos H., “Ecological assessment of Cheffa Wetland in the Borkena Valley, northeast Ethiopia: Macroinvertebrate and bird communities,” Ecol. Indic., 15:63–71, 2012. |
| [10] | Matovu Abdallah, “Impact of wastewater discharge and pollution on wáter quality and biota in Kiyanja Stream, Kawempe Division, Kampala,” MSc thesis, Makerere University, 2010. |
| [11] | Mugisha, P., Kansiime, F., Mucunguzi, P., Kateyo, E., “Wetland vegetation and nutrient retention in Nakivubo and Kirinya wetlands in the Lake Victoria basin of Uganda,” Phys. Chem. Earth. 32:1359–1365, 2007. |
| [12] | Sinha, S. N and Biswas, M., “Analysis of physico-chemical characteristics to study the water quality of a lake in Kalyani, West Bengal,” Asian Journal of Experimental Biological Sciences, 2(1):18-22, 2011. |
| [13] | Ubwa S.T., Abah J., Ada C.A., and Alechenu E., “Levels of some heavy metals contamination of street dust in the industrial and high traffic density areas of Jos Metropolis,” Journal of Biodiversity and Environmental Sciences (JBES), 3(7):13-21, 2013. |
| [14] | Moore R.B., Milstead W.B., Hollister J.W., and Walker H.A., “Estimating Summer Nutrient Concentrations in Northeastern Lakes from SPARROW Load Predictions and Modeled Lake Depth and Volume,” PLoS ONE 8(11): e81457, 2013. |
| [15] | World Health Organization, “Guidelines to drinking water quality,” 3rd ed., 1:1–666, 2008, Geneva. |
| [16] | FAO, “Water Quality for Agriculture. Food and Agriculture Organization,” 1985, Rome, Italy. |
| [17] | Admasu W., “Physicochemical and Biological Water Quality Assessment of Lake Hawassa for Multiple Designated Water Uses” Journal of Urban and Environmental Engineering, 9(2):146-157, 2015. |
| [18] | Abate B., Woldesenbet A. and Fitamo D., “Water quality assessment of Lake Hawassa for multiple designated water uses” Water Utility Journal 9: 47-60, 2015. |
| [19] | Praveen M. and Mukemil K.O., “CME WATER QUALITY INDEX AND ASSESSMENT OF PHYSICO- CHEMICAL PARAMETERS OF LAKE HAWASSA, ETHIOPIA” International Journal of Recent Scientific Research, Vol. 6, Issue, 6, pp. 7891-7894, December, 2015. |
| [20] | Berehanu B., Lemma B. and Tekle-Giorgis Y., “Chemical Composition of Industrial Effluents and Their Effect on the Survival of Fish and Eutrophication of Lake Hawassa, Southern Ethiopia” Journal of Environmental Protection, 6, 792-803, 2015. |

 Abstract
 Reference
 Full-Text PDF
 Full-text HTML