Mecheo O. Naftal1, P. Omondi2, Abdirizak Nunow2
1A Masters Graduate Moi University, Kesses, Kenya
2A Senior Lecturer in Department of Geography Moi University, Kesses, Kenya
Correspondence to: Mecheo O. Naftal, A Masters Graduate Moi University, Kesses, Kenya.
| Email: |  |
Copyright © 2019 The Author(s). Published by Scientific & Academic Publishing.
This work is licensed under the Creative Commons Attribution International License (CC BY).
http://creativecommons.org/licenses/by/4.0/

Abstract
Urban domestic solid waste is increasingly being generated in many urban centres including middle sized towns. This paper examines and analyses nature and the collection systems of domestic solid waste in Kisii town- a middle sized town in Kenya. The specific objectives of the study include: analyzing the types of domestic solid waste generated in Kisii town and assessing the storage, collection and transportation systems of the domestic solid wastes (DSW) in Kisii town. A data sample of 110 households was obtained using a multi- stage stratified sampling method. Data collection methods involved the use of questionnaires to households and direct interviews to County officers in charge of DSW. In addition, observation integrated with photography was used. Data analysis was carried out using multiple methods and presented using various forms including use of tables, use of graphs generated through SPSS, and other descriptive statistics such as the use of measures of central tendency. It was found that various types of domestic solid wastes are generated in Kisii town ranging from: food remains, papers, polythene papers, plastics, bottles, glass, cans, tins, used old clothes, used old shoes, used old beddings such as blankets, used PVCs, used old furniture and remains of construction materials such as wood, cement bags, pieces of iron sheets and pieces of card boards. Also, varied systems of collection, storage and transportation are deployed including: use of self- purchased bins, County provided bins and self- purchased polythene bags; both the County employees and private groups take part in the collection of domestic solid wastes. In transportation of the waste, only three methods are employed including: use of compacters of the County, use of tractors and use of hand- pulled carts (mkokoteni). In conclusion, Kisii town generates a wide range of wastes from households and the management of the DSW is inadequate for the town residents. It is therefore recommended that, for effective domestic solid waste management public awareness should be emphasised to identify the critical role of separation of waste at source, adequate bins should be provided in the town and collection should be regular and indiscriminate in all estates. At the same time, the transportation of the waste to designated dumping sites should be streamlined and made more effective.
Keywords:
Nature, Collection systems, Domestic solid waste (DSW), Kisii town, Kenya
Cite this paper: Mecheo O. Naftal, P. Omondi, Abdirizak Nunow, Nature and Collection Systems of Domestic Solid Wastes in Kisii Town, Kenya, World Environment, Vol. 9 No. 1, 2019, pp. 1-12. doi: 10.5923/j.env.20190901.01.
1. Introduction
Solid waste is produced in all residential areas of human habitation. The management of the waste thus has become a critical problem to different Counties and towns especially in developing countries. Domestic solid waste management in middle-sized towns such as Kisii has become a vital problem to local authorities and municipal authorities especially in developing countries. Consequently, UNEP (2003) observed that the impact of solid wastes in urban environments has become more and more intractable. For example, it’s estimated that more than five (5) million people die annually in urban areas worldwide from diseases related to inadequate waste management systems (UNDP, 1991).Kisii town has experienced rapid population growth and physical expansion in the recent years. The area has increased rapidly in the recent past resulting in the expansion of its boundaries due to high rural urban migration as well as natural increase. The population has increased threefold from 64,000 in 1989 census to 183,000 people according to 2009 census, (KMC 2010). The population increase in the town has consequently increased the generation of domestic solid waste (DSW) in the town, such that it poses overwhelming challenges to the existing management systems for the DSW.The status of Kisii town has been elevated to County headquarters with the adoption of devolved system of government following the promulgation of the Constitution of Kenya, 2010. The generation of domestic solid waste in Kisii has consequently increased to an alarming level that requires urgent attention. Similarly, the collection, transportation, treatment and disposal methods employed in the recent past need to be re-examined and improved to conform to the new population requirements in Kisii town (James, Paul et. al 2013).There has emerged great disparity in the types of domestic solid waste generated and its collection especially in relation to the income levels of the residents in the different residential areas. The high class residential areas experience regular collection whereas in the low income residential areas, the domestic solid waste is either not collected or it’s collected irregularly thus making these areas experience the adverse effects of the uncollected domestic solid waste (Duranton, 2002). Also, the types of household wastes generated in the high income residential areas greatly differ from those generated in the low income residential areas. For instance in the high income residential areas e-wastes such as broken down radios, microwaves, CDs, televisions, beer bottles, cans, water bottles among others are common, while in the low income residential areas, solid wastes such as food wastes (bones, potato peels, vegetable wastes, egg shells among others), clothe rags and polythene papers are the common wastes.
2. Methodology
2.1. The Study Area
Kisii town is geographically located on Latitude: 0° 41' 0 S and Longitude: 34° 46' 0 E. The town is a driving distance of 309 km (192 mi) from Kenya's capital city of Nairobi, located east-southeast, on Class B3 all-weather road. Other major urban centres in the immediate neighborhood of Kisii town include: Kisumu City which is 114 km (71 mi) to the northwest, Nyamira at 23 km (14 mi) to the immediate north; Keroka at 25 km (16 mi) to the east; Kericho at 101 km (63 mi) to the northeast, Kilgoris at 46 km (29 mi) to the southeast; Narok at 165 km (103 mi) to the east, and Migori to the south-west at 67 km (42 mi) which otherwise connects the town to the Kenya /Tanzania border at Isebania town located a further 31 km (19 mi) south.Kisii lies at an altitude of 1,700 m (5,577 ft) above sea level on the slopes of Kisii highlands. Kisii town is the County headquarters of Kisii County in the Nyanza region in western Kenya. The town covers 8 km2 (3 sq mi) and it has recently expanded rapidly to cover a peripheral extent of 29 km2 (11 sq mi), making its total expanse of 37 km² (14 sq mi). Kisii receives frequent convectional rainfall and enjoys a highland climate. The location of Kisii town on the highlands facilitates the growth of a vast vegetation cover making the region produce a lot of food crops and vegetation which form a large part of the domestic solid waste generated in the varied residential areas of the town. The rapid expansion of the town has resulted in the creation of more residential estates such as Ufanisi, Getare, Milimani and Nyanchwa which have enhanced the stratification of the residential areas and also contributed tremendously to the generation of domestic solid waste which in turn exerts pressure to the existing solid waste management systems.Figure 2.1: A map showing location of Kisii town in Kenya and its various estates.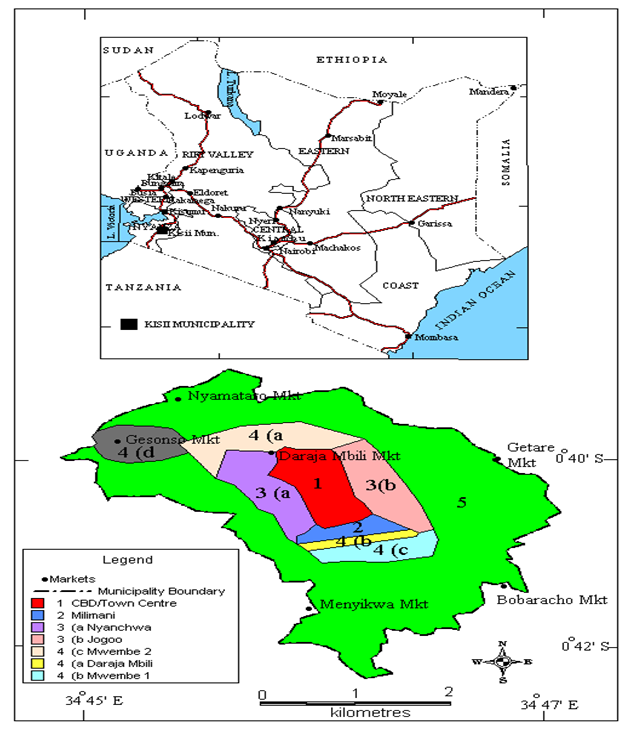 | Figure 2.1. Map of Kisii Municipality (Source: Kisii Topographical Sheet 130/2 G.O.K (1991)) |
2.2. Research Design
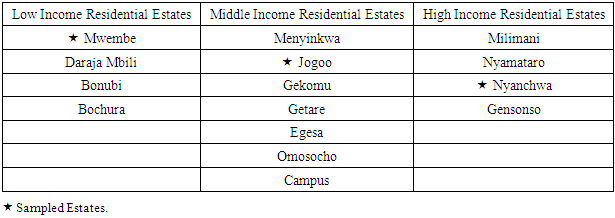
For the study to meet the set objectives, the researcher took into consideration a household descriptive survey design, which covered selected residential estates within Kisii town. Kisii town has been chosen as one of the rapidly growing County headquarters in Kenya. In order to carry out the design effectively, the researchers recognise the need to classify the town’s residential areas into distinct environmental neighborhoods based on the income levels of the residents. This catered for differential respondents’ perceptions and activities on the research subject. Therefore, this entailed the categorization of the area into different major zones of residential/environmental areas using the multi- stage sampling method. The researchers administered questionnaires to the residents in the sampled estates in Kisii town and in depth interviews were conducted to County officers in charge of public health, town planning, refuse collection and environmental management with a view to making the survey design in depth in its findings. This facilitated investigations into the role played by the County in household solid waste management in Kisii town. The officers were interviewed were randomly picked from different County and municipal departments especially those in the public health office in charge of solid waste management in the town to minimise cases of biases on the responses and improve on the level of accuracy of the information.Kisii town has currently more than 20,000 households in all estates. Using the multi-stage sampling three estates were chosen by dividing the entire study area into different major residential areas based on the environmental indicators such as the structures of the existing households; the assumed levels of income and the prevailing environmental conditions. Consequently, the residential zones were stratified as those of high income residential (HIR), middle income residential zones (MIR), and low income residential zones (LIR). This was done in collaboration with the County and municipal authorities that helped in this classification since their determination was more precise. This facilitated the selection of the households that were interviewed. The household population in the three estates is not uniform such that Nyanchwa, Jogoo and Mwembe have more than 300, 600 and 800 households respectively. From the three residential classifications, estates were selected through stratified sampling criteria from the existing estates namely: Menyinkwa, Gekomu, Nyanchwa, Jogoo, Mwembe, Campus, Gesonso, Daraja Mbili, Nyamataro, Bonubi, Egesa, Bochura, Omosocho, Milimani and Getare among others. The table below shows the selection of the estates according to their income levels.Table 2.1. A Table showing the sampled estates in Kisii town
 |
| |
|
Different number of households were systematically selected after a Kth household has been randomly selected based on each estate’s total number of households according to the County statistics which were provided by the County and town administration statistics department.Figure 2.2: A map showing the sampled estates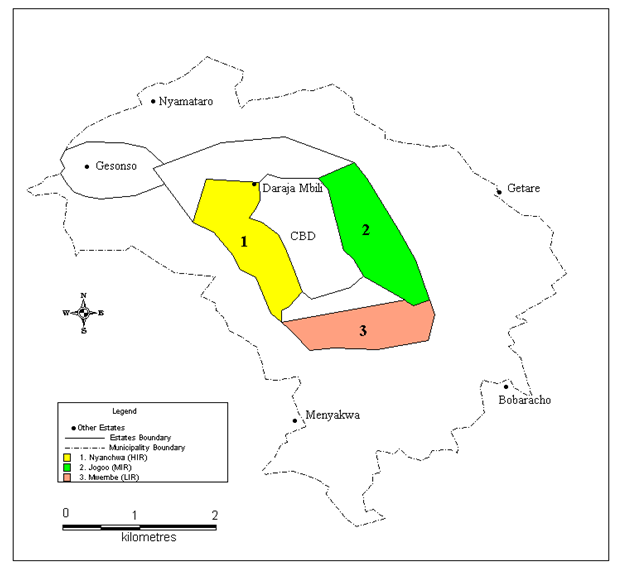 | Figure 2.2. Map of Kisii Municipality showing the three sampled Estates |
2.3. Sampling Procedure
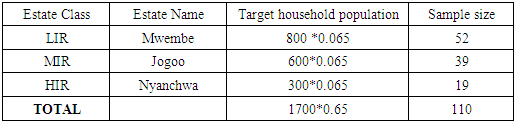
The sampling procedure used by the authors largely depended on the research design. Consequently, questionnaires were issued to the residents in the identified areas and estates; while interviews targeted Kisii County staff as in depth informants.The sample size was 110, and was calculated according to Yamane’s formula: n = N/1+N (e)²,Where n- is the required sample sizeN- is the population sizee- is the error marginIn this case N was 1700 and e was 0.09Hence n= 1700/ 1+1700(0.09)² n= 110The sample size of 110 made up 6.5% of the households of the sampled estates. The sample size was differentiated in the sampled Mwembe, Jogoo and Nyanchwa estates based on the 6.5% according to the stratified method.Table 2.2. A Table showing the sampling procedure of the questionnaires used
 |
| |
|
Both primary and secondary data collection methods were employed for the research study. Primary methods of data collection used involved the collection of raw data from the field. Questionnaires, interviews, measurements, use of photographs and direct observation were used. The use of multiple techniques was aimed at ensuring that accurate and reliable data was collected. Since the major consideration in the research was to obtain data; that would allow accurate descriptions of situations or relationships between certain variables, information adequacy and efficiency (Busha and Harter 1990). The reliance on multiple data techniques usually provides better results. Questionnaires were the preferred data collection tools since they gave a close analysis of research objectives, research questions and the research hypotheses. A questionnaire covering a wide range of issues on household solid waste management was administered to respondents at household level as shown in appendix I, and another to the County/ municipal authorities as shown in appendix II. Babbie (2004).After data had been collected, the raw data was systematically organised through coding to facilitate analysis. This was done by converting data to numerical codes representing attributed or measurements of variables. Statistical Package for Social Sciences (SPSS) program was used as an analytical tool to produce the result required for the interpretation and discussion of the subject matter. However, some data obtained from interview schedules, observation and photographs were presented directly as obtained. Various inferences were made from the analysis for the purposes of verifying and testing the results to confirm the research question. In analysing the data, descriptive and inferential statistics were employed, where the measures of central tendency such as mean were used to summarise the scores of variables of solid waste generated in the varied residential estates, percentages were also used to gauge the proportions of waste generated and the corresponding responses given.The data was presented using tables, figures, photographs and calculated percentages and frequencies/means. The data was also presented by means of discussions and explanations of the study findings so as to make valid conclusions.
3. Results and Discussion
3.1. Nature of Generated DSW and Their Characteristics
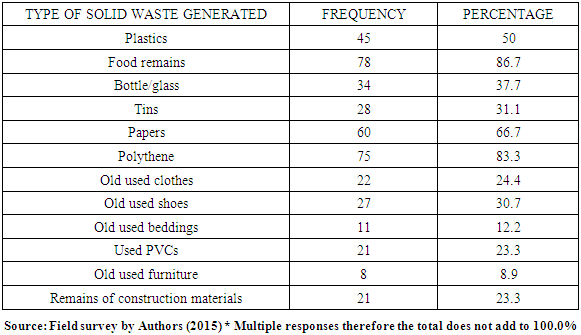
The generation of domestic solid waste is evident in Kisii town. From the responses obtained from questionnaires, interviews and direct observation, various types of domestic solid wastes are generated in the households. The wastes generated include: plastics, food remains, bottles, glass, cans, tins, papers, polythene papers, used old clothes, used old shoes, used old beddings such as blankets, used PVCs, used old furniture and remains of construction materials such as wood, cement bags, pieces of iron sheets and pieces of card boards. The most predominantly generated DSW in Kisii town according to the respondents are: food remains, plastics, bottles and polythenes. It was noted that the HIR area residents generated less food wastes compared to the MIR area residents and the LIR area residents due to the use of advanced technology such as use of refrigerators and micro- waves to store food remains for use later period.Also, it was observed that the HIR area residents produced more bottles/glass and tins ranging from water bottles, soda, beer and canned foods as opposed to the MIR area and LIR area residents due to the high purchasing power and difference in their lifestyles. The LIR area residents majorly re-used the bottles scarcely available in their households as containers for buying kerosene and also for buying portions liquid cooking oil popularly known as “salad” which is measured in low quantities proportionate to the ability to purchase from as low as kshs 10. This acted as a way of reducing the bottle wastes in the LIR area residents. Polythene papers were more rampant in Mwembe and Jogoo, the LIR and MIR areas respectively, as compared to Nyanchwa, the HIR area. This was mostly attributable to the frequency of buying items which are wrapped in polythene bags. The HIR area residents mostly did their shopping once a month in bulk especially from the supermarkets, thus minimising the frequency of purchasing items that require wrapping while the LIR and MIR area residents bought items in small quantities such as a piece of bar soap, a glass of sugar, chips (fries) of Kshs 20, a glass of rice per day, all of which contribute to a high frequency of buying and thus generating high amounts of polythene bags in their residential areas. Bread wrappers are also common in the MIR and HIR environs implying that the middle class and the high class residents are heavy consumers of bread, thus resulting to high frequency of the bread wrappers produced in those areas.Paper waste is not common with the HIR areas though it’s very common in the MIR and LIR areas owing to the fact that learning institutions in the town are in Mwembe where there is Kisii University and a number of primary and secondary schools, and in Jogoo where there are primary schools such as Jogoo S.A primary school and SET Green Hill Academy among other schools, which contribute to the learners producing wastes from the varied papers such as foolscaps, graph papers, realms for photocopying, old exercise books, old textbooks, old story books and other old reference materials or those papers that are worn out from books in use. These became the composition of the paper waste in the LIR and MIR areas. The results further indicated that in the food remains, vegetable cutting especially Sukumawiki, egg shells and bone remains were common in the MIR and LIR areas implying that these residents frequently buy meat, chicken and chicken products and most of their meals are accompanied with sukuma wiki resulting in the high rate of generation of these wastes although their income are low as compared to those in HIR whose food remains are less in quantity.In the HIR area, it was observed that they produced other wastes that are minimally produced in the MIR and LIR areas such as used old clothes, used old shoes, used old beddings, used PVCs, used old furniture and remnants of construction materials such as wood, cement bags, pieces of iron sheets and pieces of card boards among others. This is due to the fact that the HIR areas do minimal repairs to their clothes, shoes and other household items once they are torn or old but disposes them off instead. This is unlike the case in the LIR and MIR areas where repairs of such items are common phenomena. As a result, these wastes are minimised in the LIR and MIR areas as opposed to the residents of HIR areas. The presence of remains of construction materials is an indicator that the Nyanchwa residential estate is under development and is a newly developed estate that is still undergoing various constructions within the households and even in the estate unlike the LIR and MIR areas. The table 3.1 below summarises the types of solid waste generated in households in Kisii and their frequency of occurrence.Table 3.1. A Table Showing Types of Household Solid Wastes Generated In Kisii Town
 |
| |
|
Most of the generated DSW in Kisii town per household range between 1kg to 5kgs although some households produce as much as 5kgs to 10kgs. These indicates that quite a good amount of DSW is generated which require to be checked since it will require a large space for disposal and which also increase the effects of the DSW.
3.2. Storage of Domestic Solid Waste
The results indicate that there are two forms of storage of DSW which include: storage of the generated waste in the house and storage of the wastes at the collection points in varied residential plots in the estates. From the results, the storage of generated wastes in the house takes a maximum duration of a day after which the wastes are taken to the common waste storage site for the plot/estate; where they await collection. This was commonly cutting across all the estates, LIR, MIR and HIR. Storage of wastes in estate/plot storage points before collection is done either in self-purchased bins, self-purchased polythene bags and County provided bins/skips. The storage duration was also considered in the study. The results indicate that in Mwembe (LIR), 53.3% of the residents store their DSW in self-purchased polythene bags, 33.3% store in self-purchased bins, 10.1% store in plot provided bins by landlords and only 3.3% access the County provided bins. In Jogoo estate (MIR), 46.7% of the residents store their DSW in self-purchased bins, 40% in self- purchased polythene bags and only 13.3% access County provided bins. In Nyanchwa (HIR), 52.4% store their DSW in self-purchased bins, 37.6% in self-purchased polythene bags, a paltry 6.7% access the County provided bins and 3.3% use landlord provided bins. This indicates that the County’s distribution of bins is inadequate in all the estates.The photographs below show the bins for storage of DSW in various estates.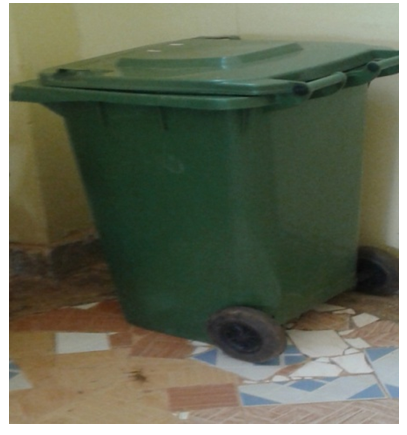 | Plate 3.1. A DSW storage bin in Nyanchwa estate |
This photograph indicates the type of storage material used in HIR, an indication that these residents purchase their bins to store their DSW before it is collected.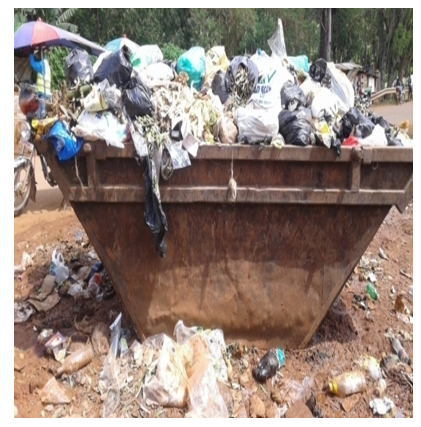 | Plate 3.2. An overfilled storage skip in Mwembe estate on the way to Kisii University |
This photograph shows that some bins are provided by the County but they are inadequate resulting to overfilling. | Plate 3.3. DSW collected in a residential estate at Jogoo showing lack of bins |
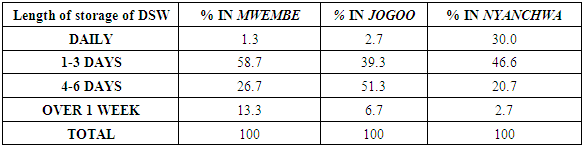
This photograph is an indication of residents using self-purchased bags in storing their wastes before they are collected.The results from questionnaires and observation show that majority of the residents of Kisii town do not access the County provided bins for the storage of household solid waste before it’s collected for disposal at the designated sites. A large percentage of the residents in all the estates store their DSW in self-purchased bins and self-purchased polythene bags. This implies that the County has not provided adequate bins/skips to the various estate/plot collection points so as to store the DSW waste temporarily before they are collected, transported and disposed at designated sites. In the separation of the waste before storage, the results indicate that in Mwembe (LIR) 86.7% of the residents do not separate their DSW while only 13.3% of the residents do separate their wastes before storing. In Jogoo (MIR), 83.3% do not separate their wastes while only 16.7% separate the wastes. In Nyanchwa (HIR), 70.0% do not separate the wastes while 30.0% of the residents separate the wastes. Separation of DSW before storing in the households is also a rare phenomenon in Kisii town estates and the few in HIR who separate their waste do it purposely to ease the collection and disposal of the wastes from their houses. With regard to the problems associated with storage, the results indicate that 98.6% of the Mwembe residents encounter problems with storing of the DSW in their households while 1.4% did not mention any problem with storing their wastes; 93.3% of Jogoo residents also do encounter various problems with storing of their wastes before they are collected and only 6.7% do not encounter any problems. In the case of Nyanchwa (HIR), 67.7% of residents experience problems in storing their DSW before it’s collected whereas, 33.3% in this estate do not encounter any problems. This indicates the increased methods of storage in the LIR, MIR and HIR respectively in these estates.The challenges associated with the storage of DSW range from bad smell, sight sores, health hazards and attracting rodents, flies and scavengers in the estates. In Mwembe 56.7% of the residents experience bad smell, 13.3% sight sore, 23.3% health hazards and 6.7% rodents and flies invasion from the DSW. In Jogoo these effects are as follows: 56.7%, 23.3% and 20.0% on bad smell, sight sore and health hazard respectively. In Nyanchwa 53.3% of the residents suffer from bad smell, 33.3% from health hazards, 6.7% from sight sores and 6.7% do not have adequate space for storing the waste. The table 3.2 below shows the length of storage of the DSW in the estate before collection.Table 3.2. A Table showing the length of storage of DSW in the estate before collection
 |
| |
|
The DSW is stored in the estates in varying intervals such that in the Nyanchwa estate collection is regular hence the storage time is shorter than in the other estates except for some few cases, as opposed to collection in Jogoo and Mwembe where the storage times in a week is poor and fair respectively before the wastes are collected. This implies that the DSW is collected more regularly in the affluent estates followed by the least affluent due to its high rate of generation as observed above, and the middle class residents suffer the uncollected effects of the DSW. The results from interviews show that the DSW is stored by the individuals in self- purchased bins and polythene bags in the households before the residents dispose their wastes into the County provided bins/skips. The skips are tractor sliders ranging from 4 tonnes to 8 tonnes. However, there are fewer 4 tonne skips compared to 8 tonne skips since the 8 tonnes skips are more efficient, convenient for the trailer and carry large quantity of waste.The population density and the rate and quantity of generation of the DSW determine the distribution of the skips in the various estates. Estates with high population density have more skips and also areas that generate a higher quantity have many skips as opposed to those with less population and/or less generation of DSW. In generation of DSW the County’s future plans are to purchase more skips for all zones, purchase more compacters/lorries and tractors and also do recycling through sorting at generation point.
3.3. Collection of Domestic Solid Waste
The results indicated that the residents of Kisii town are mainly helped by the county council 80% to collect their DSWs though it is their right since they pay taxes to the county. However in some parts of Nyanchwa estate there are some few private groups 20% who engage in waste collection which are landlord arranged. But in Mwembe and Jogoo they entirely rely on the county to collect their wastes a scenario that in case the county is incapacitated to collect the waste the residents of Mwembe and Jogoo suffer the effects of uncollected refuse. The DSW is collected in the estates in varying intervals such that in the Nyanchwa estate collection is regular than in the other estates except for some few cases, as opposed to collection in Jogoo and Mwembe where the collection times in a week is poor and fair respectively before the wastes are collected. For instance in Mwembe the DSW is collected as follows: daily 1.3%, 1-3 days 58.7%, 4-6 days 26.7% and over one week 13.3%. In Jogoo daily collection of DSW is 2.7%, 1-3 days 39.3%, 4-6 days 51.3% and over a week 6.7% while in Nyanchwa daily collection is at 30.0%, 1-3 days 46.6% 4-6 days 20.7% and over a week 2.7%. This implies that the DSW is collected more regularly in the affluent estates followed by the least affluent due to its high rate of generation as observed above and the middle class residents suffer the effects of the uncollected DSW.The results show that in the HIR areas such as Nyanchwa the landlords have organised the residents to pay a garbage collection fee ranging from Kshs 100 to Kshs 500 per month which is either included in the rent or paid separately. This enables the daily collection of the DSW in the residential estate. It is also observed, that the landlords in Nyanchwa (HIR) area have partnered with other individual groups other than the Kisii County to collect the DSW in their residential areas. This has contributed greatly to the effectiveness in the collection of DSW in the high affluent residential areas unlike in the middle and low income residential areas. The results further indicate that in Mwembe, the daily collection and collection of between 1-3 days is 1.3% and 58.7% respectively while in Jogoo it was noted that the daily collection and collection between 1-3 days is 2.7% and 39.3% respectively. This implies that collection is more regular in Mwembe (LIR) than in Jogoo (MIR) due to the fact that there is more DSW produced in the LIR than in the MIR. These high rates of DSW production in Mwembe estates force the County to exercise regular collection in Mwembe than in Jogoo. The results further indicate that; Kisii County Government has established official sites in all the estates and there are planned collection vehicle/tractor routes in the various estates. However,the major challenge associated with the collection of DSW is inadequate bins provided by the county government, especially in Jogoo and Mwembe, thus making the few available bins overfill. However, in Nyanchwa this problem is rare since the landlords provide large and adequate bins that are regularly emptied.The results from interviews depict that collection of DSW in the estates is daily in the HIR, daily or after two days in the MIR and the LIR. The disparity in the collection is mainly caused by the generation. However it was noted that the residents of HIR (Nyanchwa), generate less domestic solid waste since they are informed and use the structures in place in the right manner in disposing the waste as opposed to those on MIR (Jogoo) and LIR (Mwembe). The residents of Jogoo are the high generators of DSW according to the County environmental office in charge.There are collection routes used by the county in collection of DSW such as the compacters who operate outside the CBD, the tractors operate within the CBD and also the lorries operate outside the town in other small towns and urban centres of the County. In every group of collectors the personnel per vehicle are as follows: one driver, one supervisor and six loaders. Tractor transport is the major collection method of collecting DSW in Kisii town and its environments with the inclusion of compacters and lorries.The photograph below shows collection of DSW in open places not necessarily designated for collection.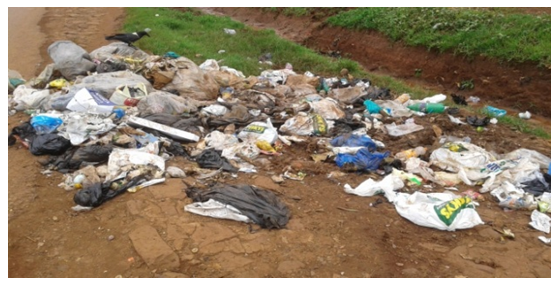 | Plate 3.4. DSW collected by the roadside at Jogoo estate next to S.A Jogoo Primary school |
The photograph above is an indication that the collection sites are not clearly designated by the County government. Consequently, a collection site need not necessarily have a collection bin but rather even open spaces have attracted dumping by residents who lack bins and designation by the County. This variance in allocation of bins is caused by the differential treatment of varied residential estates and also inadequacy of the County to manage the DSW generated. The photographs are a clear indication that residents of Jogoo estate suffer most from the inadequacy of bins while those in Mwembe also experience a similar problem although they are provided with a few bins as opposed to Jogoo but seemingly the case in Nyanchwa is different since there are adequate bins provided by the landlords in most cases. From the results, unlike in other towns Kisii town, MIR estates are less catered for in provision of bins and collection of the wastes in the estates. Where the HIR situation is good, LIR is fair and MIR is below average.
3.4. Transportation of DSW
The results from questionnaires indicate that there are three main methods of transporting DSW in Kisii town: using Kisii County vehicles (compacters), using County tractors and self- transport such as using hand- pulled carts (mkokoteni). The County administration has devised the use of tractors within majority of the estates in the vicinity of the town in estates such as Jogoo, Mwembe, Nyanchwa, Bonubi, Daraja Mbili, Gensonso, Bochura and the CBD; since they are near the town. The wastes are collected by the skips (tractor portable bins) and the tractor slides them to be attached to it as they are transported to the common Nyambera dumping site. This practice of DSW transportation is carried out in all the three estates that were sampled due to their proximity to the town and to the dumping site. Therefore the 80% of HIR, 100% of MIR and 100% LIR in Kisii town experience the same method of DSW collection except 20% of the residents of Nyanchwa who, through their landlords, have organised self- transport by hiring people with hand- pulled carts (mkokoteni) to transport the DSW to either the common tractor collection points or even to the common dumping site at Nyambera.The use of tractor transport of the wastes leaves the wastes uncovered during transportation; which most residents in Mwembe, Jogoo and Nyanchwa encounter as a problem since the tractors are open and this leads to the wastes falling while being transported. Also another challenge the residents encounter is irregular transportation of the wastes since there are only three tractors in the County serving an enormous resident population. The criss-crossing of the tractor in the estates leaves a bad odour in the estates, a common problem associated with the use of tractors in transporting the wastes in the town. The County vehicles (compacters) are used in estates that are at a great distance from the dumping site such as: Menyinkwa, Suneka, Bobaracho and Mosocho. These County vehicles are fully covered and the waste is compressed /compacted to reduce the quantity before it is transported to the dumping site. There are two compacters in the County, thus resulting to the waste in the estates taking long before they are collected and transported.Self- transport is not common, but in Nyanchwa, it is practiced where the landlord organises through the residents paying some fee such that the DSW are collected in time and transported using hired people who pack the wastes in polythene bags and transport them using mkokoteni to either the nearby tractor collection point or direct to the dumping site. This helps in maintaining the hygiene of the estate. The results from the interviews reveal that the refuse is not properly covered while being transported especially when using tractors and lorries, but when using the compacter it is covered. The transportation vehicles are cleaned/ washed once a week. Each vehicle/tractor goes one shift a day in collecting the DSW from the households and two vehicles/tractors are in the field to collect the refuse daily. This gives the insight of inadequate vehicles/ equipment in collection of refuse in the town. Below are photographs showing the transportation methods in Kisii town.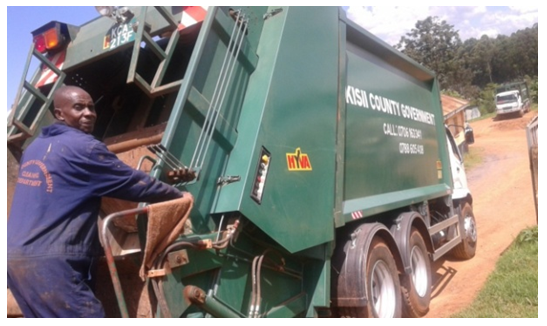 | Plate 3.5. A Compacter and worker transporting wastes |
According to the information obtained from the interviews of key informants, the compacter mode of transporting DSW are used in estates that are far from the dumpsite such as Menyinkwa, Getare, Nyamataro, Suneka, Gensonso and Nyakoe. This is meant to carry as much waste in one trip since the waste is compressed. This method is safe and there is need to increase their numbers.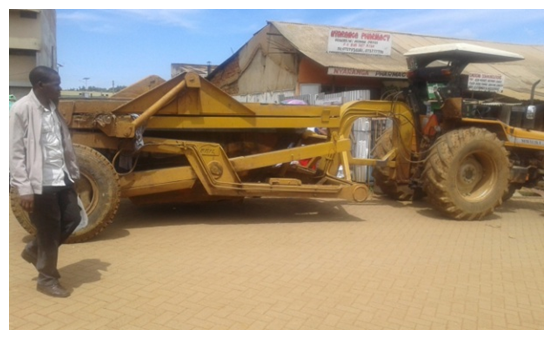 | Plate 3.6. A Slider tractor criss-crossing the estates |
The tractor transport is used mainly in estates around/near the dumpsite such as: Milimani, Nyanchwa, Mwembe, Jogoo, Ufanisi, Bonubi, Darajambili and Egesa. This is due to their structure which is open prone to littering their trails. This method need improvement by using covered tractors so as to reduce their effects such as dropping the litter along their trail, bad odours whenever they criss-cross the town and its estates and eyesore. From the results, the forms of transportation of DSW provided for the residents are inadequate such that one tractor transports wastes from more than five estates that are near the town. There is need to have purchased more transportation equipment to match the ever increasing DSW generation demands.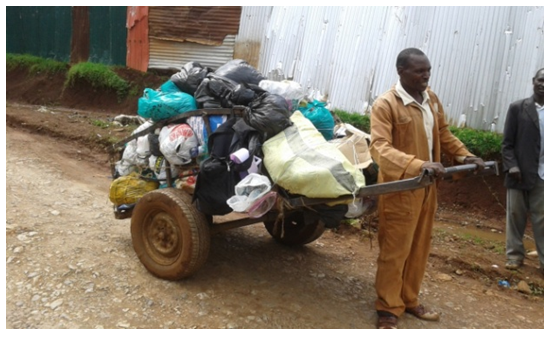 | Plate 3.7. A worker transporting DSW from homesteads using hand- pulled cart (mkokoteni) |
From the photograph, use of hand- pulled cart is not common only 20% of the residents of Nyanchwa use it. This is attributed to the arrangements made between landlords and the one private group which is not named. This organization has led to regular collection of DSW in the estate hence frequent transportation to the common dumping site at Nyambera. The private group has provided necessary equipment such as uniform and gloves to its workers. These method need improvement to cover the carts and reduce dropping of wastes transported.
3.5. Findings of the Study
Various types of wastes are generated in the stratified estates in Kisii town and these include: plastics, food remains, bottles, glass, cans, tins, papers, polythene papers, used old clothes, used old shoes, used old beddings such as blankets, used PVCs, used old furniture and remains of construction materials such as wood, cement bags, pieces of iron sheets and pieces of card boards. According to the respondents, the most predominantly generated DSW in Kisii town are: food remains, plastics, bottles and polythenes. It was noted that the HIR area residents generated less food wastes compared to the MIR area residents and the LIR area residents due to the use of advanced technology such as use of refrigerators and micro waves to store and use later the food remains.Also, it was observed that the HIR area residents produced more bottles/glass and tins ranging from water bottles, soda, beer and canned foods as opposed to the MIR and LIR area residents due to the high purchasing power and difference in their lifestyles. The LIR area residents mostly re-used the bottles scarcely available in their households as containers for buying kerosene and also for buying liquid cooking oil popularly called “salad” which is measured in low quantities proportionate to the purchasing ability of the buyers from as low as kshs 10. This acted as a way of reducing the bottle wastes in the LIR area residents. Polythene papers were more rampant in Mwembe and Jogoo, the LIR and MIR area respectively, as compared to Nyanchwa the HIR. This is largely attributable to the frequency of buying items which were wrapped in polythene bags. The HIR area residents mostly did their shopping in bulk once a month, especially from the supermarkets, thus minimising the frequency of purchasing items that are wrapped in polythene; while the LIR and MIR area residents bought items in small quantities such as a piece of bar soap, a glass of sugar, chips (fries) of Kshs 20, a glass of rice per day which contributes to a high frequency of buying, hence generating high polythene bags in their residential areas. Bread wrappers are also common in the MIR and HIR environs implying that the middle class and the high class residents are heavy consumers of bread thus resulting to high frequency of the bread wrappers produced.Paper waste is not common with the HIR area residents although it was very common in the MIR and LIR area residents due to the fact that learning institutions in the town are in Mwembe where there is Kisii University and a number of primary and secondary schools. Similarly in Jogoo, there are primary schools such as Jogoo S.A primary school and SET Green Hill Academy among other schools which contribute to the learners producing wastes from the varied papers such as foolscaps, graph papers, realms for photocopying, old exercise books, old textbooks, old story books and other old reference materials or those papers that are worn out from books in use. These constitute the paper waste in the LIR and MIR residential areas. The results further indicate that among the food remains, vegetable cutting especially Sukuma wiki, egg shells and bone remains were common in the MIR and LIR area residents implying that these residents frequently bought meat, chicken and chicken products and most of their meals were accompanied with sukuma wiki resulting to the high rate of generation of these wastes although their income are low as compared to those in HIR area residents whose food remains were less in quantity.In the HIR it was observed that they produced other wastes that are minimally produced in the MIR and LIR such as used old clothes, used old shoes, used old beddings, used PVCs, used old furniture and remnants of construction materials such as wood, cement bags, pieces of iron sheets and pieces of card boards among others. This is due to the fact that the HIR area residents do minimal repairs to their clothes, shoes and other household items once they are torn or get old. This was unlike in the LIR and MIR where repairs are common phenomena. As a result, these wastes are minimised in the LIR and MIR area residents as opposed to the residents of HIR area. The presence of remains of construction materials is an indicator that Nyanchwa residential estate is under development and is a newly developed estate that is still undergoing various constructions in the households and even in the estate unlike the LIR and MIR areas. It was noted that the residents of Kisii town are mainly helped by the County government to collect their DSWs. However in some parts of Nyanchwa estate, there are some few private groups who engage in waste collection which are landlord arranged. But in the case of Mwembe and Jogoo they entirely rely on the County to collect their wastes. In case the County is incapable of collecting the waste, the residents of Mwembe and Jogoo tend to suffer the effects of uncollected refuse. The DSW is collected in the estates at varying intervals such that in the Nyanchwa estate collection is more regular than in the other estates except for some few cases, as opposed to collection in Jogoo and Mwembe where the collection times in a week is poor and fair respectively. For instance, in Mwembe the DSW is collected as follows: daily 1.3%, 1-3 days 58.7%, 4-6 days 26.7% and over one week 13.3%. In Jogoo daily collection of DSW is 2.7%, 1-3 days 39.3%, 4-6 days 51.3% and over a week 6.7%, while in Nyanchwa, daily collection is at 30.0%, 1-3 days 46.6%, 4-6 days 20.7% and over a week 2.7%. This implies that the DSW is collected more regularly in the affluent estates followed by the less affluent estates due to its high rate of generation as observed above, and the middle class residents suffer the uncollected effects of the DSW.It was also observed that in the HIR area such as Nyanchwa the landlords have organised the residents to pay a garbage collection fee ranging from Kshs 100 to Kshs 500 that is either included in the rent or paid separately. This enables the daily collection of the DSW in the residential estate. It was also observed that the landlords in Nyanchwa (HIR) have partnered with other individual groups other than the Kisii County to collect the DSW in their residential areas. This has greatly contributed to the effectiveness in the collection of DSW in the high affluent residential areas unlike in the middle and low affluent residential areas.Contrary to the expected outcome that in MIR Jogoo estate, collection would be better than in the LIR (Mwembe), it was observed that the daily collection and collection of between 1-3 days was 1.3% and 58.7% in Mwembe respectively, while in Jogoo it was noted that the daily collection and collection between 1-3 days was 2.7% and 39.3% respectively. This implies that daily collection is more regular in Mwembe (LIR) than in Jogoo (MIR) due to the reason that there is more DSW produced in the LIR area than in the MIR area. These high rates of DSW production in Mwembe estates force the county to exercise regular collection in Mwembe than in Jogoo. It was noted that the Kisii County has established official sites in all the estates and there are planned collection vehicle/tractor routes in the various estates. Though the major challenge associated with the collection of DSW is that of inadequate bins especially in Jogoo and Mwembe by the County, thus making the few available bins overfill. However, in Nyanchwa this problem is rare since the landlords provide large and adequate bins which are regularly emptied. It was observed that there are three main methods of transporting DSW in Kisii town, including: using Kisii County vehicles (compacters), using County tractors and self-transport such as using hand-pulled carts (mkokoteni).The County has devised the use of tractors within most of the estates in the vicinity of the town such as Jogoo, Mwembe, Nyanchwa, Bonubi, Daraja Mbili, Gensonso, Bochura and the CBD; since they are near the town. The wastes are collected by the skips (tractor portable bins) and the tractor slides them to be attached to it as they are transported to the common Nyambera dumping site. This practice of DSW transportation is carried out in all the three sampled estates due to their proximity to the town and dumping site. Consequently, 80% of HIR, 100% of MIR and 100% LIR in Kisii town experience the same method of DSW collection except 20% of the residents of Nyanchwa who have organised self-transport through their landlords by hiring people with hand-pulled carts (mkokoteni) to transport the DSW to dispose the wastes either at the common tractor collection points or even to the common dumping site at Nyambera.The use of tractor transport for the wastes leaves the wastes uncovered during transportation, and most residents in Mwembe, Jogoo and Nyanchwa consider this as a problem since the tractors drop some of the wastes during transportation. Another major problem the residents encounter is irregular transportation of the wastes since there are only three tractors in the County serving a large resident population. The criss-crossing of the tractor in the estates leaves a bad odour (smell) in the estates, a common problem associated with the use of tractors in transporting the wastes in the town. The County vehicles (compacters) are used in estates that are at a great distance from the dumping site such as: Menyinkwa, Suneka, Bobaracho and Mosocho. There are only two compacters in the County, resulting to the waste in the estates taking long before they are collected and transported to the dumping sites.Self-transport is not common except in Nyanchwa where the landlord organises through the residents paying some fee such that the DSW are collected in time and transported using hired people who pack the wastes in polythene bags and transport them using mkokoteni to either the nearby tractor collection point or directly to the dumping site. This helps in maintaining the hygiene of the estate.
4. Summary
Kisii town generates a wide range of wastes ranging from: plastics, food remains, bottle/glass, tins, papers, polythenes, old used clothes, shoes, metal remains, chip board remains, building remains, used PVCs, and remains of construction materials. The amount of wastes generated per household daily ranges between 1kg–10kgs amounting to approximately 200 tonnes per day according to the records obtained from the County management and this is an enormous volume of DSW. The storage of DSW before collection is mainly done through self-purchased bins in Nyanchwa and use of self-purchased polythene bags in Jogoo and Mwembe. This is mainly attributed to the purchasing power/level of income of the residents in the stratified estates in the MIR and LIR respectively. Collection of DSW is mainly carried out by the County authorities who use tractors to collect waste within the town and compacters in the outskirts of the town. The tractors and compactors have a group of six workers who include: the driver, a supervisor and four loaders. The loaders work on alternate days while the driver and supervisor are on duty daily, sometimes including even weekends. Collection is done ranging from daily to once a week in some areas of various estates especially the MIR and LIR areas; but in the case of HIR area collection is regular and enhanced by private groups organised by the landlords in various residential estates. These private groups are minimal or entirely absent in the MIR and LIR areas.
5. Recommendations
The study established that the major types of DSW generated are food remains, plastics and papers. It is therefore recommended that one: county government of Kisii should create public awareness to the residents on the importance of keeping the town and its environs clean through proper waste management practices. This should be done through the media such as radio/ TV, road shows, use of posters, banners, bill boards and sign posts.Also, strategies should be laid down to enhance separation of wastes at generation by having a group of five differently coloured and labelled bins. For example; for re-usables such as bottles, for recyclables, for organic waste such as food remains, for combustibles and one for non – combustibles for land filling purposes are recommended. These bins should be many in all the collection sites of residential areas to ensure no waste is uncollected.The study also, found out that the family size and the level of income are the major factors that influence the DSW generated. It is therefore recommended that residents should be sensitised to purchase and cook what they can consume to reduce the excesses which surmount to DSW especially food remains.The study further established that the collection of DSW by the county government is not regular in all residential estates. Therefore it is recommended that the collection of the DSW should be regular and indiscriminate in all estates to eradicate the observed discrepancies. Daily collection should be encouraged for a clean town.The study noted that the available management systems of handling DSW that is storage, collection, transportation and deposition are inadequate. Therefore it is recommended that one: the county government should provide adequate bins and skips for the storage of DSW before it is collected and transported.The county government should purchase more compacters and covered tractors/trailers to ensure effective collection and transportation of the DSW in the town without affecting other not involved persons through bad odour. Also, in transportation, more trips per day should be enhanced to enable wider reach of all areas of the town and for effective collection of the waste from the residential areas.The county government should embrace proper disposal methods which are environmentally friendly and avoid burning and dumping of the DSW. They should use and incorporate re- use by establishing sterilization/ cleaning plants and re-packaging centres for water bottles.The county government through the environmental department should increase the personnel especially the collectors of garbage and provide them with protective equipment for handling various types of wastes. The personnel should further undergo necessary training to equip them with the skills for the job.In addition, the environmental department should encourage and work with private groups/ CBOs and individuals involved in DSWM practices in the town. This will help in reaching all parts of the town especially where the roads are impassable to tractors and compacters.Further, it is recommended that recycling centres/plants should be established to put into use used bottles, polythene papers, tins, glass and other wastes so as to reduce their bulk in the town. Digesters and compost pits should be developed to utilise organic wastes such as food remains to make organic manure to be sold and used in farms. Digesters should also be used to generate biomass energy which can be used to provide energy for small scale use. Incineration plants should also be established to burn combustibles and energy generated to be used in recycling plants to enhance sustenance of the plant and provide cheap energy source.
6. Conclusions
In conclusion, Kisii town generates various types of domestic solid wastes which vary from estate to estate where food remains, plastics and papers are the major ones. Family size and level of income are the major factors influencing generation of DSW. The generated DSW is stored in bins and skips mainly self-purchased before it is collected 80% by the County government and 20% by private groups. Transportation of DSW is done by three methods including use of tractors, use of compacters and hand- pulled carts (mkokoteni). Domestic solid waste is a challenge in many towns especially in developing towns as evidenced in Kisii town. The limited space in the town affects Kisii town with its exponential population growth and developmental needs. Kisii town experiences a myriad of challenges in managing DSW ranging from a very high generation rate, inadequate skilled personnel to manage DSW, few disposal sites at generation, inadequate transport facilities, skewed collection in varied estates, inadequate financing from the County budget, limited and overfilled disposal site at Nyambera dumpsite, lack of separation of waste at generation and at disposal, not involving the community in management of DSW, irregular collection of DSW from the estates, lack of public awareness, inadequate protective equipment to the DSW workers, lack of recycle, re-use, and reduce (3R) strategies, organisational and management problems and lack of an integrated DSW management plan in the town.
References
| [1] | Adam R. (1995), Taking Action on Environmental Goods for you and your Community. UNEP, Nairobi Kenya. |
| [2] | Agevi T. (1992), Collection and Transportation of Solid Waste. Page 44-68. |
| [3] | Albert J.G (1985), Municipal Waste Processing in Europe: A Status Report. (The World Bank Washington D.C). |
| [4] | Ali A. A. (2009), Characterisation, management and improvement strategies for household. |
| [5] | Arcot. R. (1992), Refuse Collection Vehicles for Developing countries. UNCHS Habitat, Nairobi Kenya. |
| [6] | Baud I. and Hans S. (1994), Solid Waste Management in Urban Context Raising issues, modes, assessments, appraisals and linkages in Bangalore Manohar publishers and distributors New Delhi page 15. |
| [7] | Bourdeau M.L. and Stanner sG.R. (1995), Classification of Urban Waste and their environmental impacts; World Bank Washington D.C. |
| [8] | Central Bureau of Statistics (CBS) Kenya. Population Census 2009. Nairobi: Government Printers; 2010. |
| [9] | Cordoba J.C. (2003), On the Distribution of City Sizes. Rice University, 31 p. |
| [10] | Foster J.B. (2011), The Ecological Rift: Capitalisms War on the Earth. Monthly Review Press. p 544. |
| [11] | G.O.K (1991), Atlas of the Government of Kenya. |
| [12] | G.O.K (1997-2002), Kisii Development Plan. Kenya Government Printers Nairobi. |
| [13] | GOK (2007). Vision 2030: The Environment. Kenya Government Printers Nairobi. Government press Nairobi, Kenya. |
| [14] | Habitat (2015), Environmental Management of Cities in Africa: Models for Environmental Management. Habitat, Nairobi, Kenya. |
| [15] | http://www.innovation.havard.eduawards |
| [16] | KC. (2014), Kisii county: Environmental management policy guidelines: Government printers Nairobi. |
| [17] | KMC (2010), Kisii Municipal council: A guideline to town management, Longhorn publishers Nairobi. |
| [18] | Kothari, C.R. (2004), Research methodology. Methods and techniques. (2nded). New Delhi: New Age International Publishers. |
| [19] | Ministry of Local Government (2003), The Local Government Act (cap 265) section 201 and 210- Disposal of refuse by- law. |
| [20] | Mugenda A. and Mugenda O. (2003), Research Methods, Quantitative and Qualitative. Act press. Nairobi. |
| [21] | Mukolwe H. W. (2013), Factors Contributing To Indiscriminate Dumping Of Solid Waste In Eldoret Central Business District. Egerton university press. |
| [22] | NEMA (2003), State of Kitale Environmental Report. 2003 Nairobi page 1-25. |
| [23] | NEMA (2010), State of Environmental Report. 2010 Nairobi 67-78. |
| [24] | Oluchiri S.O. (2002), Energy Potential of Solid Waste in Eldoret municipality and Kisumu city. Mphil thesis Moi University Eldoret. |
| [25] | Omondi. O. (1998), Assessment of the Generation and Management of Household Solid waste in Eldoret municipality. Mphil thesis, Moi University Eldoret. |
| [26] | Ongore et al (1996), Waste management in Developing countries – Towards Improving Solid Waste Management Capacity ofin Nakuru Municipality, 1996. |
| [27] | Otieno. S. O. (2010), Urban planning and management in small and medium-size towns In Supplementary Issue, 23-48. |
| [28] | Turner R.K (1994), Municipal Solid Waste Management: An economic perspective in Bradshaw D.A Southwood. Chapman and Hall London. |
| [29] | UNCHS (1998), Refuse Collection Vehicles for Developing Countries. UNCHS Nairobi. |
| [30] | UNEP (2006), "Environmentally Sound Management of Solid Wastes and Sewage-Related Issues". United Nations Environment Programme. Retrieved 2011-02-23. 26, Issue 1, 2006, pp. 92-100. |
| [31] | UNEP. (2015), Managing Urban Waste. International Environmental Technology Centre. |
| [32] | UNEP. International Environmental Technology Centre (IETC), (2003), Urban Waste Unpublished MSc. Thesis, University of Nairobi, Kenya, 2011. |
| [33] | USEPA (2002), United States Environmental Programme Agency: environmental report 2002. |
| [34] | Yamane T. (1967), Statistics; An introductory analysis, 2nd edition Harper and Row NewYork. |

 Abstract
 Reference
 Full-Text PDF
 Full-text HTML