-
Paper Information
- Paper Submission
-
Journal Information
- About This Journal
- Editorial Board
- Current Issue
- Archive
- Author Guidelines
- Contact Us
World Environment
p-ISSN: 2163-1573 e-ISSN: 2163-1581
2018; 8(2): 47-62
doi:10.5923/j.env.20180802.03

Global and Regional Trends of Urbanization: A Critical Review of the Environmental and Economic Imprints
 Abstract
 Reference
 Full-Text PDF
 Full-text HTML
Amos Ouma Onyango
Department of Geography, Moi University, Kenya
Correspondence to: Amos Ouma Onyango, Department of Geography, Moi University, Kenya.
| Email: |  |
Copyright © 2018 The Author(s). Published by Scientific & Academic Publishing.
This work is licensed under the Creative Commons Attribution International License (CC BY).
http://creativecommons.org/licenses/by/4.0/

This paper highlights the global and regional urbanization trends, and its environmental and economic imprints. It primarily relies on relevant peer-reviewed articles, and research and development reports from international institutions. Books authored by experts from diverse fields were also helpful during this review. The study has revealed that the global urban population has grown from an estimated 3% in 1800 to an estimated 54.5% in 2016. Empirical evidence indicates that urban expansion and associated land cover change impacts biodiversity; local, regional and global climate; and, management of wastes. Economically, evidence has been provided to support the poverty reducing effect of cities, role in generation of Gross Domestic Product (GDP), and the advantages of agglomeration economies. Strong case has emerged that managing urbanization is an important part of nurturing growth. The real challenge, therefore, is for governments to adopt policies that maximize the benefits of urbanization.
Keywords: Urbanization trends, Environment, Biodiversity, Poverty, GDP, Agglomeration
Cite this paper: Amos Ouma Onyango, Global and Regional Trends of Urbanization: A Critical Review of the Environmental and Economic Imprints, World Environment, Vol. 8 No. 2, 2018, pp. 47-62. doi: 10.5923/j.env.20180802.03.
Article Outline
1. Introduction
- Urbanization is the demographic process whereby an increasing share of the national population lives within urban settlements [2]. The United Nations’ Department of Economic and Social Affairs, Population Division (UNDESAPD) [37] asserts that urbanization is a condition at a point in time and a process occurring over time. The condition of urbanization (level of urbanization) is indicated by the percentage of a population that is living in urban areas (there are country-specific definitions of urban populations). As a process, it refers to an increase in the level of urbanization, that is, the percentage urban. Rate of urbanization denotes the annual growth rate in the level of urbanization [22]. Therefore, to say a country or region is urbanizing implies that it is becoming more urban. Urbanization is the result of a movement of people from rural areas to urban areas, both within their own countries and trans-nationally; and, that the underlying cause is attraction to economic, cultural, social and educational opportunities, along with the quality of life that a city provides [16].There is no general agreement on a definition of what is urban, and considerable differences in classification of urban and rural areas exist among countries and continents. In Europe and North America, the urban landscape is often defined as an area with human agglomerations and with more than 50% of the surface built, surrounded by other areas with 30-50% built, and overall, a population density of more than ten individuals per hectare(ha) [31]. In many countries, settlements designated as urban are expected to serve certain administrative functions. Alternatively, some countries have multiple criteria, perhaps including size, density and administrative level/form of governance structure, but also extending to indicators of what could be considered urban employment (e.g. non-agricultural workers), facilities (e.g. higher level schools), infrastructure (e.g. street lighting) [22]. There is a significant variation in the criteria used to delineate what is a town, city or city region [31] This is evidenced by the way [2] defines urban settlement. They hold that in an urban settlement, most of the residents derive majority of their livelihoods from non-farm occupations.In The World’s Cities in 2016: Data Booklet, [38] defines cities as places where large numbers of people live and work; they are hubs of government, commerce and transportation. The Data Booklet holds that no standardized international criteria exist for determining the boundaries of a city, and, that multiple different boundary definitions are available for any given city. One type of definition, sometimes referred to as the “city proper” describes a city according to an administrative boundary. A second approach, termed “the urban agglomeration” considers the extent of the contiguous urban area, or built up area to delineate the city’s boundaries. A third concept of the city, the “metropolitan area” defines its boundaries according to the degree of economic and social interconnectedness of nearby areas, identified by interlinked commerce, or commuting patterns, for example. Attempts to provide some differences between urban and rural settlements have been made by [47]. This is based on contexts such population size, economic, services, land use, and social aspects. In terms of population size, there is a wide discrepancy of views over the minimum size of population required to enable a settlement to be termed a town. For instance, in Denmark it is considered to be 250 people, in Ireland 500, in France 2,000, in the United States of America (USA) 2500, in Spain 10,000, and in Japan 30,000 people. There are certain extremes as mentioned by [22]. In Sweden, a built up area with at least 200 households with gaps of no more than 200 metres between them is defined as urban; and in Mali, the census up to 1987 used a cut-off of 50,000 people, the 1998 census used a cut-off of 30,000, and the 2009 census used a cut-off of 40,000. It is noteworthy that, as the resolution and availability of remote sensing improves, it will become increasingly easy to apply standard demographic definitions independent of administrative functions. Economically, rural settlements have traditionally been defined as places where most of the workforce are farmers or are engaged in other primary activities (mining and forestry). In contrast, most of the workforce in urban areas is employed in secondary and service industries. In India, where many villages are larger than British towns, a figure of less than 25% of population engaged in agriculture is taken to be the dividing point. However, many rural areas have now become commuter/dormitory settlements for people working in adjacent urban areas or, even more recently, a location for smaller, footloose industries such as high-tech industries. The provision of services, such as schools, hospitals, shops, public transport, and banks, is usually limited, at times absent, in rural areas. In terms of land use, settlements are widely spaced with open land between adjacent villages in rural areas. Within each village there may be individual farms as well as residential areas and possibly small-scale industry. In urban areas, settlements are often packed closely together and within towns there is a greater mixture of land use with residential, industrial, services, and open-space provision. Finally, rural settlements, especially those in more remote areas, tend to have more inhabitants in the over-65 age group, whereas the highest proportion in urban areas lies within the economically active age group or those under secondary school age.It has become increasingly more difficult to differentiate between villages and towns, especially where urban areas have spread outwards into the rural fringe. The term rural-to-urban continuum is used to express the fact that in many highly urbanized countries, there is no longer either physically or socially a simple, clear-cut division between town and country. Instead, there is a gradation between the two, with no obvious point where it can be said that the urban way of life ends and the rural way of life begins. It is therefore more realistic to talk about a transition zone from ‘strongly rural’ to ‘strongly urban’ [46]. In reality, rural-to-urban continuum range from sparsely populated isolated settlements to small towns to secondary cities to megacities. Thus, in any given country, there is heterogeneity within areas that are classified as rural or urban [8]. Urbanization involves both changes in people and the places they live. Urbanization is a multidimensional process that manifests itself through rapidly changing human population and changing land cover [31]. The urban transformation for people and places involves three types of changes: movement from one place to another, expansion of the population through population growth, and changes in the character of places as they add population due to migration and population growth [1]. Urbanization stems in part from rural-urban migration, in part from natural increase, and in part from the reclassification of urban boundaries as cities expand outward and small population centres grow and are designated as urban areas [8, 31]. The United Nations, Population Division has published three papers (that is, in 1980, 2001 and 2008) examining the components of urban growth. All the three studies singled out natural increase as the driving force behind urban growth in developing countries: about 60% of the growth of cities in developing countries was due to natural increase, while the remainder was due to net migration and reclassification [37]. Pejaranonda, Santipaporn & Guest (1995, as cited in [36, 37]) used indirect methods to decompose the components of urban growth in Thailand during the period 1980-1990 using data from the National Statistical office of Thailand. They estimated that 46.4% of the urban growth in Thailand resulted from natural increase, 14.2% from reclassification, 14.3% from expansion of existing urban boundaries, and 25.1% from net migration. Urbanization occurs as much through decisions not to go back to rural areas as it is through decisions to move to towns. Moreover, reclassification is linked to population growth in previously rural localities [22]. Migration is likely to be a bigger factor in the growth of many low income settlements in some peri-urban areas, and even in a large share of large villages becoming urban, than in the growth of existing urban areas. For the developed regions, international migration accounts for about a third of urban growth [43].
2. Urbanization Trends
- The increase in the global urban population began slowly. In 1800, around 3% of humanity lived in cities, with an estimated 1.7% of the global population in cities of 100,000 or more and 2.4% of the global population in cities of 20,000 or more [21]. The global proportion of urban population was a mere 13% in 1900 [34, 31]. By 1950, however, estimates suggest that approximately 729 million people worldwide lived in all cities [21]; this number corresponded to about 29% of the global population [42, 31, 21]. Urban population first reached 1 billion only in 1959, and 2 billion in 1985 [37]. Since 1990, the world has seen an increased gathering of its population in urban areas. In 1990, 43% (2.3 billion) of the world’s population lived in urban areas. This trend has been marked by a remarkable increase in the absolute numbers of urban dwellers- from a yearly average of 57 million in 1990-2000 to 77 million in the period 2010-2015 [46]. The urban share of the global population reached 3 billion in 2002 [37]; by 2015, this had grown to 4 billion (54% of the world’s population). In 2016, an estimated 54.5% of the world’s population lived in urban settlements [38]. The World Urbanization Prospects: The 2014 Revision shows that during 2014-2030 period, the urban population of the world is projected to increase at an annual rate of 1.7%, much lower than in 1950-1970 (3.0%), 1970-1990 (2.6%), or in 1990-2014 (2.2%). By 2030, urban areas are projected to house 60% of people globally [15, 38], and one in every three people will live in cities with at least half a million inhabitants [38]. For the period 2030-2050, the annual urban growth rate is expected to be 1.1%. The proportion urban is also expected to rise at a slower pace: 0.7% during 2014-2030 and 0.5% during 2030-2050 [37]. If the current trends continue, by 2050, the population of the world is estimated to be 66% urban [22, 37], with urban dwellers numbering 6.3 billion [31, 37]; nearly doubling the 3.5 billion of 2010 [31]. Accommodating this many more urban dwellers efficiently and equitably in a planet where global limits need to be addressed will be difficult, particularly if it is not planned for.The increase in urban population has not been evenly spread throughout the world. Different regions have seen their urban populations grow more quickly, or less quickly, although, virtually no region of the world can report a decrease in urbanization [46]. The 2014 Revision of the World Urbanization Prospects reveals the following trends among the developed and less developed regions [37]: In 1950, the urban population of the more developed regions was substantially larger than that of the less developed regions (444 million versus 302 million), so that the more developed regions accounted for 60% of the world’s urban population. By 1970, the urban population of the less developed regions had surpassed that of the more developed regions (677 million versus 673 million). In 2014, almost three times as many urban dwellers were estimated to live in the less developed regions as in more developed regions (2.9 billion versus 1.0 billion), and the less developed regions accounted for 75% of the world urban population and 83% of the total world population. By 2050, with 5.2 billion urban dwellers, the less developed regions are projected to have 82% of the world urban population and 86% of the total world population. Correspondingly, with 1.1 billion urban inhabitants, the urban areas of the more developed regions will account for only 18% of the urban population of the world and 14% of the world population.The more developed regions were already highly urbanized by 1950, when over half (55%) of their population lived in urban areas [37]. At that time, the less developed regions had just 18% of their inhabitants living in cities and towns [40] However, the urban population of less developed regions has been growing quite rapidly between 1950 and 2014 and the proportion in those regions more than doubled, reaching 48% by 2014. In the more developed regions, the proportion urban rose less rapidly, but reached 78% by 2014. The projected proportion urban in 2050 is expected to reach 85% in the more developed regions and 63% in the less developed regions. Thus there is still ample room for a continuing expansion of the proportion urban in the less developed regions. The more developed regions, on the other hand, may be nearing an upper limit [37]. Davis (1968, as cited in [36]) argued that urbanization process is characterised by an attenuated S-shaped curve, with increases in levels of urbanization most rapid during the middle stages of economic development. The experience of now developed countries tends to support this hypothesis, with a slowing in levels of urbanization occurring for these countries in the last quarter of this century. In contrast, growth in urbanization has increased in developing countries over the same period [36].The trends of urbanization by world major areas is broken down as follows [37]: in 1950, Africa had the lowest proportion urban of any major area (14%), but experienced the fastest rate of urbanization by far during 1950-1970 (2.4% per annum), and the second fastest after Asia during 1990-2014 (1.0% per year). By 2014, its urban share had risen to 40%. The rate of urbanization over the coming years is expected to fall- this will result in a level of urbanization of 56% by 2050. Africa will still be the least urbanized major region in the world; Asia was the second least urbanized in 1950, with 18% of its population living in urban settlements. By 2014, after Asia experienced average annual rates of urbanization of 1.5% per annum (p.a) in the period 1950-1990 and 1.6% p.a in 1990-2014, the level of urbanization had more than doubled to 48%. 64% of its population is projected to be urban in 2050, when Asia will still remain the second least urbanized major area. Together, they (Africa and Asia) will account for nearly three-quarters of the global urban population by 2050; in Latin America and the Caribbean, the percentage urban was already relatively high by 1950, when 41% of its population lived in urban settlements. The region experienced a rapid increase in the proportion urban, averaging 1.6% p.a in 1950-1970, and 1.0% in 1970-1990. Consequently, its percentage urban share rose to 71% in 1990, and in 2014, it surpassed that of Europe and Oceania (80% versus 73% and 71%); Europe’s urban population share by 1950 was 52%. This later rose to 73% in 2014 (the annual rates of urbanization were 1.0% p.a 1950-1970, 0.52% p.a in 1970-1990, and 0.20% in 1990-2014). It should be noted that Latin America and Europe are both expected to experience declines in their annual rates of urbanization, with the result that their proportions urban will increase slowly, reaching 82% in Europe and 86% in Latin America and the Caribbean by 2050; and, Oceania was the second most urbanized major area in the world in 1950 (62%) following Northern America (64%). Since then, the two major areas have experienced the lowest rates of urbanization in the world: in 1950-1970, both experienced rates of urbanization around 0.7% p.a, but in the subsequent 44 years, the rate more than halved in Northern America and became marginally negative for most of the period in Oceania. Percentages urban are expected to rise to 87% in Northern America and 74% in Oceania by 2050. Northern America will remain the most urbanised major area in the world by 2050 (See Table 1). At this juncture, it is imperative to note that despite its low level of urbanization, and because of its large population, Asia has the largest number of persons living in urban areas [46], 2.1 billion in 2014). It was followed by Europe with 545 million, Latin America and the Caribbean with 496 million, Africa with 455 million, Northern America with 292 million, and Oceania with 27 million urban dwellers in 2014 [37].
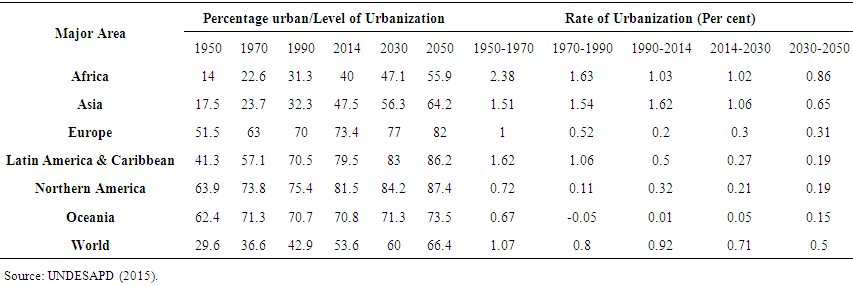 | Table 1. Percentage urban and Rate of urbanization of the World by Major Area, Selected Periods, 1950-2050 |
3. Environmental Imprints of Urbanization
3.1. Urbanization and Biodiversity
- Urban biodiversity is defined as the variety or richness and abundance of living organisms (including genetic variation) and habitats found in and on the edge of human settlements. Species range from rural fringe to the urban core [26]. Examples of habitats found in human settlements include: remnant vegetation (e.g. remnant habitats of native plant communities); agricultural landscapes (e.g. meadows, arable land); urban-industrial landscapes (e.g. wastelands and vacant lots, residential areas, industrial parks, railway areas, brown fields); ornamental gardens and landscapes (e.g. formal parks and gardens, small gardens and green spaces). The relationship between urbanization and biodiversity is multifaceted and complex. Urbanization impacts biodiversity both directly through physical expansion over land, and indirectly due to land use and human behaviours within urban areas [21]. Physical expansion changes the composition of landscape, and can eliminate organisms outright, or may alter or eliminate the conditions within a habitat that a species requires to survive. Urban expansion has the effect of decreasing, fragmenting, and isolating natural patches by altering the size, shape, and interconnectivity of the natural landscape [14, 15]. It modifies the climate by creating urban heat islands. These changes often result in the loss of native plant and animal species [26]. In addition to physical expansion, human activity within cities can have myriad of cascading effects that have impacts on biodiversity, including changes in biogeochemistry, local temperature, climate change and hydrologic systems [14]. Thus, it is not only the size of the urban areas but also their spatial configuration and heterogeneity in urban land use that matter for biodiversity. The most direct impact of cities on biodiversity is the change in land cover associated with urban growth. Land cover change could lead to the loss of up to 40% of the species in some of the most biologically diverse areas around the world, and as of the year 2000, 88% of the global primary vegetation land cover had been destroyed in “biodiversity hotspots” [30].In studying The Implications of Current and Future Urbanization for Global Protected Areas and Biodiversity Conservation [20] found that 29 of the world’s 825 ecoregions have over a third of their area urbanized. These 29 ecoregions are the only home of 213 of endemic terrestrial vertebrate species. The analysis revealed that 8% of the terrestrial vertebrate species on the International Union for Conservation of Nature (IUCN) Red List are imperilled largely because of urban development. By 2030, 15 additional ecoregions are expected to lose more than 5% of their remaining undisturbed area, and they contain 118 vertebrate species found nowhere else. Ecoregions are relatively large units of land containing a distinct assemblage of natural communities and species, with boundaries that approximate the original extent of natural communities prior to major land-use change [14]. Of the 779 rare species with only one known population globally, 24 are expected to be impacted by urban growth. Most of these threats are in middle and low-income countries, which raise questions about the institutional capacity to act against potential adverse effects of urban expansion on biodiversity [21]. In Global Forecasts of Urban Expansion to 2030 and Directs Impacts on Biodiversity and Carbon Pools [30] discovered that habitats are expected to be encroached upon or destroyed by urban expansion for 139 amphibian species, 41 mammalian species, and 25 bird species that are on either the Critically Endangered or Endangered Lists of the IUCN. Africa and Europe are expected to have the highest percentages of Alliance for Zero Extinction (AZE) species to be affected by urban expansion: 30% and 33% respectively. However, the Americas will have the largest number of species affected by urban expansion, 134, representing a quarter of all AZE species in the region [30, 14]. Cities are concentrated along coastlines and some islands as well as major river systems, which also happen to be areas of high species richness and endemism [21].Less than 1% of biodiversity hotspots were urbanized circa 2000 [30, 21]. Biodiversity hotspots are defined as regions with many endemic species facing exceptional habitat loss and degradation [14]. By 2030, new urban expansion will take up an additional 1.8% of all hotspot areas [30, 31]. Across the world, between 2000 and 2030, total urban land in biodiversity hotspots is expected to increase 4 plus/minus 0.8 times to 787 000 plus/minus 160 000 km2. Correspondingly, percentage of urban land located in biodiversity hotspots is expected to increase to 34% (plus/minus 2%) in 2030 from 31% in 2000 [14]. Using Monte Carlo techniques to generate 1000 spatially explicit simulations of urban growth out to 2030 for 16 geographical regions, broadly based on the United Nations defined world regions, [15] noted; that, seven regions had more than half of their respective urban land area circa 2000 in biodiversity hotspots: South-eastern Asia, Eastern Asia, Central America, Mid Asia, Southern America, Western Asia, and North Africa. Nearly all the urban land in South-eastern Asia (27,000 km2) was located in biodiversity hotspots. South America had the most urban land (about 46,000 km2) in biodiversity hotspots and this corresponded to almost 60% of the total urban land in the region. India had the least amount and smallest percentage of urban land in biodiversity hotspots, about 14,000km2 and 4.5% respectively. By 2030, the largest increase in the amount of urban land in biodiversity hotspots is expected to be in South America (an increase by more than 100,000 plus/minus 25,000 km2). The study forecasted the largest proportional increase (14 plus/minus 3 fold) to be in mid latitudinal Africa. The percentage of urban lands in the biodiversity hotspots of Southern Africa showed the largest increase and will nearly double by 2030. Other regions that showed significant increases in the percentage of total urban land within their respective biodiversity hotspots were in Mid-Latitudinal Africa, Central America, Mid Asia and South America. The highest rates of increase- over ten times- in urban land cover are forecasted to take place in four biodiversity hotspots that were relatively undisturbed by urban land at the turn of this century: Eastern Afromontane, Guinean Forests of West Africa, Western Ghats and Sri Lanka, and Madagascar and Indian Ocean Islands [14].Globally, 32,000 km2 of protected areas (PAs) were already urbanized in approximately the year 2000, corresponding to 5% of global urban land. In particular, in Europe, almost 20,000 km2 of PAs were already under urban land cover (about 10,000 km2 and 9,500 km2 in Eastern and Western Europe, respectively). This corresponds to 13% of the total urban extent in the content in the year 2000. China and South America also had substantial amounts of urban land within their PAs with 4,500 km2 and 2,800 km2, respectively (i.e. 6% and 3.5% of their respective urban) [31, 15, 21]. In [15] study, Futures of Global Urban Expansion: Uncertainties and Implications for Biodiversity Conservation, it was revealed that, in circa 2000, regions that had high percentage of urban population such as Northern America, Western Europe, and Eastern Europe had the most urban land within close proximity of their respective PAs. Western Europe had the most urban land within 10-kilometres (km) of PAs whereas Northern America had the most urban land within 25- and 50-km of PAs. Rapidly urbanizing China also had large amount of urban land within close proximity to PAs. In 2030, in about a third of the 16 regions considered in the study, urban areas are expected to cover 4% or more of the lands within 25- and 50-km wide zones around PA boundaries. Western Europe is forecasted to have the largest urban percentage within 10-km wide whereas Eastern Asia, Central America, and China also have large percentages within these zones expected to be urban. 25% of the world’s PAs will be within 15-km of a city of at least 50,000 people by 2030; and, for most PAs likely to be impacted by new urban growth, 88% are in countries of low to moderate income, potentially limiting institutional capacity to adapt to new anthropogenic stresses on protected areas. [20].Urban expansion will also impact freshwater availability and consequently, biodiversity [14]. Land cover change in watersheds (including natural habitats) affects rates of evapotranspiration and hence the quantity of surface or groundwater available. It also affects many factors that impact water quality, including erosion, nutrient loading, and biogeochemical cycling [21]. How population growth and climate change will affect water availability for all cities in developing countries with more than 100,000 people was modelled by [19]. These cities had 1.2 billion residents in the year 2000, 60% of the urban population of developing countries. The researchers used detailed hydrologic model, demographic projections and climate change scenarios to estimate per capita water availability for major cities in the developing world where urban growth is the fastest. The modelled results showed that in 2000, 150 million people lived in cities with perennial water shortage (i.e. annual water availability <100L/person/day of sustainable surface and groundwater) within their urban extent. Many more people-886 million- lived in cities with seasonal water shortage (i.e. monthly water availability <100L/person/day), with insufficient flows occurring in at least 1 month of the year. The results further revealed that, by 2050, 993 million (about a billion) people will live in cities with perennial water shortage within their urban extent. Averaged across all climate change scenarios, the forecast revealed that approximately 100 million more urban residents will live under perennial water shortage due to climate change. Fresh water ecoregions with high number of urbanites with insufficient water will potentially have flows inadequate to maintain biodiversity, because there will be at least 1 month per year in which some rivers in an ecoregion have essentially all water withdrawn for urban use. Of particular conservation concern is the Western Ghats of India which will have 81 million people with insufficient water by 2050 but also houses 293 fish species, 29% of which are endemic to this ecoregions [19, 14]. A significant indirect impact of urbanization on biodiversity is through agricultural production to supply cities with food, fibre and fuels. As people move from rural, agrarian lifestyles to urban areas, their incomes and consumption tend to rise [7]. An essential characteristic of that trend is a shift in diet towards more protein [7, 14], which in turn leads to an increasing demand beyond the simple population growth rate, for meat and fish. The increasing demand for meat in particular, drives an increase in grain production for livestock feed, and in general, an increased use of resources associated with agricultural production [7]. The study by [7] identifies four impacts of agriculture on biodiversity. First, the biggest negative impact on biodiversity is coupled to habitat loss primarily due to the conversion of naturally, biodiverse forests, wetlands, and grasslands to less diverse agroecosystems of croplands and pastures. Second, agriculture modifies the water cycle in two ways- directly through the diversion of liquid water (“blue water”) from rivers and underground aquifers; and, indirectly via the conversion of forests to croplands and pastures and thus a change in evapotranspiration from the landscape (“green water flows”). The diversion of blue water flows can have direct impacts on the biodiversity of freshwater ecosystems. The conversion of forests, particularly, very biodiversity-rich tropical forests, to agricultural systems, arguably has a greater impact on biodiversity. Third, the application of nutrients mainly nitrogen (N) and phosphorus (P) on agricultural landscapes and consequent transport into natural ecosystems (e.g. wetlands habitats, and inland and coastal waters) has also had major negative impacts on biodiversity in these systems. For example, excess P can lead to the eutrophication of freshwater lakes and rivers, while transport of P and N can lead to anoxic zones in the coastal seas adjacent the mouths of large rivers whose catchments contain extensive croplands, such as the Gulf of Mexico adjacent to the mouth of Mississippi River. Excess N applied to landscapes can also affect terrestrial biodiversity by favouring fast-growing generalists that then out-compete rarer species that thrive in nutrient-poor-niches in the landscape. Finally, agriculture can lead to modification of disturbance regimes: changes in quantity, timing, and frequency of natural flooding events on major rivers due to large-scale irrigation projects, which have consequences for the biodiversity of freshwater ecosystems (changes to the flooding regimes of the Indus, Nile, and Rio Grande rivers are all instances of vastly modified flooding regimes mainly driven by agriculture); and, changes in fire regimes due to land use change such as forest conversion to agriculture. Pervasive changes in fire regimes in dryland ecosystems-for example, the intensity, frequency, and seasonality of savannah and woodland fires across much of Australia-can also lead to large impacts on biodiversity.
3.2. Urbanization and Climate
- Urbanization impacts the atmosphere’s regulatory ecosystem services that augment climate variability at the local, regional, and global scales [33]. At the local and regional level, the impacts of urbanization on climate include the urban heat island effect, impacts on precipitation, and the impacts on air quality. On the global scale, cities contribute to climate change through greenhouse gas (GHG) emissions.
3.2.1. The Urban Heat Island
- Compared to rural areas, cities tend to have higher air and surface temperatures due to the urban heat island (UHI) effect: the tendency of cities to retain heat more than their surrounding rural areas [44]. UHI is the higher air or surface temperature of an urban area as compared to its surrounding rural area [25]. Urban temperatures are typically 3-4°C higher than surrounding areas due to UHI, but can be as high as 11°C warmer in urban “hotspots” [33]. A study by [25] to determine the effects of urban heat island on the cooling and heating demands in urban and suburban areas of Hong Kong revealed higher temperatures in the colder months and during solar off-peak hours in the urban area. The analysis of the mean maximum and mean minimum temperature for Hong Kong showed that UHI increases the mean minimum temperature. According to the ground observation records from the past 40 years, in Shanghai (China), there is an apparent mean annual temperature difference of 0.7°C between downtown and suburban areas (16.1°C and 15.4°C respectively). The corresponding mean annual extreme maximum temperatures are 38.8°C and 37.3°C respectively. This urban warmth tends to appear from afternoon to midnight in mid autumn, and in early winter, summer and spring under clear conditions with low winds [3].The elevation in temperatures is most generally explained in terms of the basic surface energy balance processes of shortwave and longwave radiation exchange, latent, sensible, and conductive heat flows. With respect to shortwave or solar radiation, surface albedo refers to the reflectivity of a surface to visible light and is measured from 0-100% reflectivity. The regional albedo of urban agglomerations is lower than the surrounding countryside hence absorbs more energy (i.e. shortwave radiation) per unit area than do rural areas. This is due to the preponderance of dark asphalt roadways, rooftops, and urban canyon light trapping. These urban features have typical albedo values below 15% [3]. Dark surfaces such as asphalt roads or rooftops can reach temperatures 30-40°C higher than the surrounding air [33]. Urban areas generally have very low thermal roughness length, with relatively high values of thermal inertia. Small values of thermal roughness length combined with low wind speed resulting from high aerodynamic resistance strongly inhibit the turbulent heat exchange [29]. Furthermore, little available energy is used for evaporation in urban areas (unless vegetation is present), which characteristically exhibit great precipitation runoff from streets and buildings. This results in a larger storage of energy in the urban fabric during the day and release of this storage heat throughout the night, when the mixing height is shallow. The replacement of natural soil and vegetation with impervious surfaces leads to greatly reduced evapotranspiration and latent heat cooling. The dense impervious surfaces with high heat capacity create significant changes in heat storage and release times as compared to natural soil and vegetation [3]. The heat energy possessed by urban and rural area structures and ambient air comes from the sun and anthropogenic heat sources. The high density of population and economic activities in urban areas lead to intense anthropogenic heat releases within small spatial scales [3]. These include building heating and cooling systems, mass transportation systems and vehicular traffic, and commercial, industrial and residential energy use. The higher uptakes of net radiation (i.e. the difference between incoming shortwave- and outgoing longwave-radiation) by urban structures result in higher surface-temperatures in an urban area. However, the net radiation captured and stored by an area structure is released to the environment as sensible and latent heat fluxes. Consequently, urban structures would release higher quantities of heat to the ambient air as compared to their counterpart in rural areas. The heat produced by anthropogenic heat sources would also be converted into sensible, latent, and the net radiation captured and stored by an area structure. Thus, heat released by urban structures and anthropogenic heat sources should result in higher air-temperatures in an urban area. Conclusively, both urban area structures and ambient air should experience higher temperatures [24].By increasing temperatures, urban heat island effects can aggravate the heat-related negative impacts of climate change. The higher temperatures in urban areas can increase cooling energy demand, in particular in summer, when air conditioning is used in order to improve the thermal comfort of inhabitants inside the buildings. For instance, 60% of energy consumption of Hong Kong is used for air conditioning in summer. However, UHI can reduce heating energy demand, in particular in winter, when heating is needed to overcome lower temperatures [25]. Increases in the incidence, or duration of summertime heat waves may result in higher rates of power systems breakdown or failure, particularly, if sustained high demand-driven by high rates of air conditioning use-stresses transmission and distribution assets beyond their rated design capacity [3]. The UHI effect does not contribute to global warming. Studies indicate that effects of urbanization and land use change on land-based temperature records are negligible (0.006°C per decade) as far as hemispheric- and continental-scale averages are concerned [33]. However, [29] points out that, although the UHI in itself does not influence global heat temperatures significantly, it does affect local temperature records that are used to assess climate change. As cities increase in size and number, the UHI may play a role in regional climate. One study which examined the trends of UHI effect in East China found clear connection between urbanization and surface warming over the region. UHI effects contribute 24.2% to regional average warming trends in this region [33].
3.2.2. Urbanization and Precipitation
- There is mounting evidence that urbanization affects precipitation variability, a phenomenon described as “urban rainfall effect” [31]. There are a number of hypothetical scenarios that may produce an urban rainfall effect: high surface roughness that enhances convergence; UHI effects on atmospheric boundary layers and the resulting downstream generation of convective clouds; generation of high levels of aerosols that act as cloud condensation/ hygroscopic nuclei/nucleation sites [31, 33]; and, urban canopy creation and maintenance processes that affect precipitation systems. No matter what the mechanisms, intensely urban areas and those that are directly downwind of urban areas are cloudier and wetter, with heavier precipitation and more frequent heavy rain events than those that are not, but within the same region. Average increases of 28% in monthly rainfall rates have been identified within 30-60km downwind of cities [33].In their Numerical Evaluation of the Impact of Urbanization on Summertime Precipitation in Osaka, Japan (2006-2010 period), [32] found that urbanization decreased mean humidity in the target region and period by 0.8gkg-1 because of the decreased latent heat flux. The study further revealed that urbanization caused an increase of precipitation in the target region (Urban area) and a decrease in the surrounding (suburban area). The mean precipitation in the target region and period was increased by 20 millimetres (mm) per month which was equivalent to 27% of the total amount without the synoptic-scale precipitation. The precipitation frequency in the urban area was higher than that in the surrounding region. Precipitation in the urban area increased both in intensity and duration. In another study to determine the Effect of Urbanization on Regional Precipitation in the Qinhuai River Area (one of the largest urban agglomerations in the world), East China, [51] took six precipitation stations for daily rainfall data from 1961-2006. The period of development of urbanization was divided into two: slow period (1961-1978); and rapid period (1979-2006). The data was then analysed. Compared with the slow period of urbanization, the annual precipitation in Qinhuai River Area, in the rapid period of urbanization increased. As urbanization rapidly developed from 1979-2006, the annual precipitation in Qinhuai River Area increased by about 7.9% in the urban area while by about 5.6% in the suburban area. In the slow period of urbanization, the rainfall enhancement coefficient of the annual precipitation in Qinhuai River basin was 1.003; in the rapid period of urbanization, the rainfall-enhancement coefficient reached 1.033, increasing by 2.9%. The researchers concluded that, as urbanization rapidly develops, the precipitation difference between urban and suburban areas enlarges and the urban “rain island effect” becomes more and more obvious. A related study of Benin City (Nigeria) in 2014 yielded similar results. The high density area had the highest annual precipitation value while the surrounding rural areas recorded the least [11]. The findings from the three studies are consistent with that of [3] who considered data for the period 1960-2002 for Shanghai (China); the central city of Shanghai experiences greater precipitation than the outlying regions with an average precipitation that is 5-9% higher than the surrounding regions.
3.2.3. Urbanization and Air Quality
- Urban air contains high concentrations of pollutants. Ambient urban air pollution refers to gases, aerosols, and particles that harm human well-being and the environment [33]. Cities are the sources of significant air pollution, since they are the location of intense fossil fuel consumption and land use changes. According to [52], common anthropogenic sources of air pollution in urban atmospheres in both developed and developing countries include fuel combustion for energy production (e.g. power plants, steam generation, household and commercial boilers/heaters), industrial processes (e.g. oil refinery), solvent utilization, gasoline or diesel powered vehicles, and fugitive dust (for particulate matter only). In addition, the pollutants generated outside a city can be transported, along with secondary pollutants that are formed via photochemical reactions contributing to the complex mixture of urban air pollution. In developing countries, open burning of garbage releases particulate matter, carbon monoxide, toxic organics from plastics, toxic metal, polycyclic aromatic hydrocarbons (PAH), and to a lesser extent sulphur oxides (SOx) and nitrogen oxides (NOx). Some air pollutants emitted via waste incineration, such as dioxins, and furans, mix globally and thus affect the Earth’s ecosystems and air quality [16].Increasing motor vehicle traffic is a major source of air pollution. Road transportation vehicles emit harmful substances such as carbon dioxide, carbon monoxide, non-methanous volatile organic compounds, methane, nitrogen oxides, particulate matter, and sulphur dioxide. While gasoline-fuelled vehicles account for 80-90% of total volatile organic compounds and carbon monoxide, diesel vehicles are the main source of nitrogen oxides, sulphur dioxide, and particulates. They account for 66% of nitrogen oxides, 70% of sulphur dioxide, and 90% of particulate emissions. In many megacities in Asia, particulate matter already exceeds 300 micrograms per cubic metres, which is above the World Health Organization (WHO) standard [16]. Road transport is a major cause of urban smog- a mixture of smoke, fog, and chemical fumes. In cities such as Beijing and many northern Chinese cities, severe winter smog episodes have frequently occurred in recent years [52]. A typical example of a polluted urban atmosphere (“air Pollution Island”) is found in Shanghai. The urban air quality of Shanghai is poorer than that of suburban and rural areas. The inversion layer over the UHI holds back the diffusion of atmospheric pollutants, increasing pollution levels locally. This in turn leads to acid rain. In 2003, the average PH value of precipitation in Shanghai was 5.21, with a percentage of acid of 16.7%. In the downtown area, where industry, commerce, traffic, and residents interact closely, pollution is severe [3]. Urban residents in low- and middle-income countries have greater exposure to some localized air pollutants such as suspended particles, than their counterparts in high income countries even though the later consume more energy per capita [35]. Once emitted, the dispersion and dilution of air pollutants are strongly influenced by meteorological conditions, especially by wind direction, wind speed, turbulence, and atmospheric stability [33]. For instance, on the global scale, the mid-latitude westerlies and their associated weather systems are responsible for the transportation of aerosols over long distances in the troposphere. The Jet Streams in the upper atmosphere are also involved in the distribution of aerosols, carrying particles around the world several times before releasing them [17]. Topographical conditions and urban structures like street canyons for example, have an effect on the pollutants. Cities that develop in valleys often undergo atmospheric inversions, which help trap pollutants and enhance effects [33].Aerosols are solid or liquid particles dispersed in the air [17]. Aerosol concentrations tend to be higher in urban areas than rural areas [3]. Aerosols affect regional climate by scattering, reflecting, or absorbing solar radiation [17, 31]. The proportions reflected, scattered or absorbed depend upon the size, colour and concentration of particles in the atmosphere, and upon the nature of the radiation itself. Aerosols which scatter or reflect radiation increase the albedo of the atmosphere and reduce the amount of insolation arriving at the Earth’s surface. Since aerosols have the ability to change the path of the radiation, through the atmosphere, they have the potential to alter the Earth’s energy budget. Most aerosols, particularly sulphates and fine rock particles, scatter solar radiation effectively [17]. Whether aerosols produce a cooling or warming effect depends on the aerosols in question: sulphates produce a cooling effect while carbon-based aerosols produce a warming effect [31]. The amount of change in energy that a given factor causes is called radiative forcing; positive forcing warms the surface while negative forcing cools it [48]. The visible manifestation of regional air pollution is a brownish layer or haze pervading many areas of Asia. Hotspots for these atmospheric brown clouds include South Asia, East Asia, and the much of Southeast Asia [33]. In a Cape Town Brown Haze Study conducted in 1997, 65% of the brown haze was attributed to vehicular emission, of which 49% is caused by diesel vehicles and 16% by petrol vehicles [44]. Through the examination of temperature records in urbanized regions of China and India affected by the haze, researchers have demonstrated a significant cooling effect since 1950s [33]. The persistence of the haze has significant implications to regional and global water budget, agriculture and health.
3.2.4. Contribution of Cities to Climate Change through GHG Emissions
- GHGs absorb infrared radiation very effectively. After absorbing radiation emitted from the surface, GHGs subsequently re-emit infrared energy of slightly different wavelengths. Some of this re-emitted energy is lost to space, but some travels back downward warming, specifically, the troposphere and the Earth’s surface in a phenomenon known as the greenhouse effect [48]. GHGs are relatively transparent to incoming visible light from the sun, yet opaque to the energy radiated from the Earth’s surface. They capture 70-85% of energy in up-going thermal radiation emitted from the Earth’s surface [5]. Many GHGs occur naturally, such as carbon dioxide (CO2), methane (CH4), water vapour (H2O), ozone (O3) and nitrous oxide (N2O) [48], while others are synthetic The man-made GHGs include chlorofluorocarbons (CFCs), hydrofluorocarbons (HFCs), perfluorocarbons (PFCs), and sulphur hexafluoride (SF6) [50]. It is the GHGs added by human activities that are trapping too much heat today and causing the atmosphere to overheat [5]. GHGs differ in their ability to warm the troposphere and the surface. CO2, for instance, is weaker on a per-molecule basis than methane or nitrous oxide. However, CO2 is far more abundant in the atmosphere, so it contributes more to the greenhouse effect. Moreover, emissions of GHGs from human activity consist mostly of CO2. Even after accounting for the greater global warming potentials of other gases, carbon dioxide’s abundance in our emissions makes it the major contributor to global warming [48]. Urban areas concentrate economic activities, households, industries, and infrastructures which are hotspots for consumption as well as key sources of GHGs. With more than 50% of the world’s population, cities account for between 60% and 80% of energy consumption, and generate as much as 70% of the human-induced GHG emissions primarily through the consumption of fossil fuels for energy supply and transportation [46]. The energy related carbon emissions is expected to increase to 76% by 2030, with most of the increase coming from rapidly urbanizing countries such as China and India [16]. Using existing spatial data and a baseline year 2000, [18] in An Exploratory Analysis, estimated the urban share of emissions for the four most important GHGs (CO2, CH4, N2O and SF6). The analysis found that, for the year 2000, total anthropogenic GHG emissions, excluding emissions from large-scale biomass burning and aviation and navigation emissions released over oceans, were approximately 34.8 billion metric tons of CO2 equivalent (CO2-eq.). The study further revealed that urban areas (those with over 50,000 inhabitants) accounted for 36.8-48.6% of total emissions or between 12.8 and 16.9 billion tons of CO2-eq. Within regions, African urban GHG emission shares were the lowest, ranging from 21-30% of all African GHG emissions, and North American urban GHG emission shares were the highest ranging from 49-73% of all North American GHG emissions. The findings also showed variation in emission between development groups: Urban GHG emissions ranged from approximately 26-33% of total emissions amongst developing countries, while the developed countries’ urban GHG emissions ranged from approximately 47-63%.The energy conversion sector comprises the largest source of urban GHG emissions, ranging from 54-65% of total urban GHG emissions. In developing countries, energy conversion accounts for between 61% and 70% of all urban GHG emissions, while in the developed world, the energy industry produces between 50% and 63% of urban emissions [33, 18]. A recent report by Intergovernmental Panel on Climate Change (IPCC) states that the transport sector accounted for 23% of the world’s GHG emissions related to energy in 2004, although in some cities, the percentage is much higher, a reflection of local land use and mobility patterns [3]. In their study [18] found that the transport sector accounts for 15-20% of total urban GHG emissions; with road transportation being responsible for over 90% of urban transport emissions. CO2 emissions from the transport sector increased by 28% between 1990 and 2006; they are expected to rise by another 57% in the period 2005-2030, and by 2050, they will be up 120% from 2000 levels [16]. Increased use of diesel fuel in the transport sector will lead to further increases in particulate emissions, including black carbon, as vehicles tend to be poorly maintained in developing countries. Urban agricultural activities, residential areas, and urban waste are other emitters of GHG in urban areas [16, 18]. Industry, transport and residential have been identified as major sectors contributing GHG emissions in Cape Town (South Africa) and Mexico City (Mexico) [44]. Deforestation and forest degradation for urban expansion are currently estimated to contribute 6-17% of total anthropogenic CO2 emissions, with vast majority originating in the tropics [30].
3.3. Urban Areas and Waste Management
- Global waste production is increasing; currently, the world’s cities produce 1.3 billion tonnes of waste annually, and they will produce 2.2 billion tons by 2025. This waste directly affects environmental and public health at local and global scales. On a local scale, improper waste management, especially open dumping and open burning, pollutes water bodies, contaminates air and land, and attracts disease vectors. People who live near or work with solid waste have increased disease burdens [16]. In urban areas with inadequate services, solid waste can clog or block storm-water drains, impeding the flow of water from the impacted area and increasing pollution. On a global scale, solid waste currently contributes climate change through the release of CH4 from the decomposing matter. Nearly 5% of GHG emissions in 2010 came from post consumer wastes [3]. Wealthier cities tend to produce more complex wastes, with a higher proportion of electronics and plastics, which are harder to manage. Electronic waste poses a particular threat to developing cities, since it contains toxic materials and it is often exported from wealthier to poorer nations where it is informally managed. Lower income cities tend to have a higher relative organic fraction in their wastes; this less complex waste is relatively easy to manage. However, the global proliferation of disposable consumer products is increasing the complexity of wastes everywhere [16]. In many poor urban areas, up to two-thirds of solid waste generated is not collected, and most often, municipal authorities focus their limited budget on solid waste collection in neighbourhoods with wealth and political power [3].
4. Economic Impacts of Urbanization
- There is a strong positive relationship between urbanization and economic growth. The two processes reinforce each other through several potential channels: “agricultural push”, “industrial pull” and “consumption cities” [49]. Rising agriculture productivity, which in the early stages drives economic growth, releases excess labour that migrates to cities seeking better opportunities in the modern sector- often referred to as “the push from agriculture”. The “pull from industrial productivity” arises where economic transformation from agriculture to industry attracts labour from the rural economy to cities’ industrial sector. This process is marked by a high correlation between urbanization and the share of industry in GDP. A third channel is seen in countries whose growth emanates from natural resource wealth. The rising incomes from natural resource exports spur urbanization by increasing demand for goods and services produced in urban areas, and by helping create urban jobs that lead to the growth of consumption cities. Urbanization will strongly drive economic growth if urban firms have business environment, are able to create more jobs, and can benefit from a sufficiently large pool of better educated people who can migrate from rural areas to take these jobs. But growth will be weaker if uneducated migrants are forced to live rural areas for the city by a combination of a rapidly growing population density and scarcity of agricultural land. In this section, the relationship between urbanization and poverty, agglomeration economies, and the role of cites in GDP creation, are examined.
4.1. Urbanization and Poverty
- When properly planned and managed, urbanization can play a key role in eradicating poverty. Since the industrial revolution, country after country has witnessed urbanization lift entire generation out of poverty and into the middle class. For instance, in the early 1980s, East Asia was the region with highest incidence of poverty in the world, with 77% of its population living below the poverty line; by 2008, this had fallen to 14% [46]. For countries, cities are the engines of productivity and the workhorses of development. For individuals, cities mean opportunities [12]. Urbanization has helped millions escape poverty through higher levels of productivity, employment opportunities, improved quality of life via better education and health, large scale public investment, and access to improved infrastructure and services. Generally, urban populations have better access to education, health services, and municipal services such as electricity, piped water, sanitation and waste collection relative to rural areas [1, 2]. As a result, urban populations attain higher educational levels, have lower levels of infant mortality and lower birth rates than rural populations [1]. Moreover, urban workers have better access to transport and other facilities such as the internet.Poverty reduction can be associated with the ability to become entrepreneurs and to make one’s own business. This shift in behaviour makes urban areas more attractive for entrepreneurs and entrepreneurship [2]; the large urban population offers ready and accessible markets for the traded products and services. The relationship between urbanization and poverty is a positive one, as the incidence of poverty tends to be less pronounced in urban than in rural areas. To determine the urban-rural poverty gap, cities and the countryside of fifty developing countries were included in a study conducted in the period 1998-2007. The results revealed that 48.9% of the rural population in the selected countries were below the rural poverty line, while less than a third (30.3%) of the urban population was below the urban poverty line; and that, the urban-rural poverty gap was positive in 45 out 50 countries [42]. Given the lower incidence of relative poverty in urban areas, the overall poverty rate (urban and rural) can be expected to decline as the share of the urban population rises- assuming that the distribution of income within urban or rural areas remains unchanged. Urban growth is therefore, both positive and necessary for rural poverty reduction.In a Policy Research Working Paper Number 6338, [4] investigated the effect of urbanization on rural poverty. The study used a large sample of Indian Districts from 1983-1999. The results revealed that an increase in the urban population of 200,000 determines a decrease in rural poverty in the same district of between 1.3-2.6 percentage points. These figures represent between 13% and 25% of the overall reduction in rural poverty in India over the same period. The investigation revealed that the effect is casual and is largely attributable to the positive spillovers of urbanization on the rural economy rather than movement of the rural poor to urban areas. This rural poverty-reducing effect of urbanization is primarily explained by increased demand for local agricultural products, and to a lesser extent, by urban-rural remittances, the rural land/labour ratio and the rural nonfarm employment. This finding is supported by [13] who observes that urban economic growth is expected to contribute to reducing rural poverty through two main channels: labour absorption- an expanding urban economy will benefit the rural poor by either absorbing the surplus rural labour or by tightening rural labour markets (leading to higher wage rates); and backward linkages, where, growth in the urban economy increases public or private resources that benefit the rural poor; for example, greater urban demand for rural products may increase rural incomes or labour-augmenting technical progress in urban areas may increase the remittances sent back to rural families. The findings can help to reassess the role of public investment in urban areas for poverty reduction. It is popular tenet that investments in developing countries should be concentrated in rural areas to reduce poverty because the poor in developing countries are primarily concentrated there. However, investments in rural areas are often burdensome because substantial resources are needed to reach a population that is scattered among vast territories. To the extent that urbanization can have substantial poverty-reducing effects on rural areas, urban investments may become an important complement to rural investments in poverty reduction strategies [4]. In another inquiry [13] focused on the question of whether cities or towns are better generators of rural-poverty reducing growth in India. The study used data on 59 regions which were observed four times from 1993/4 to 2011/12. The results showed that the rural headcount poverty rate fell by half in this period and the poverty gap index fell by two-thirds; the pace of poverty reduction was spatially uneven. The study notes further, that when the effects of big-city growth on rural poverty were compared to those of secondary towns, some consistent associations emerged, indicating that the growth of towns matters far more than cities to reducing rural poverty in India. The researchers, however, cautions that they only studied the question for India at its stage of economic development. The pattern uncovered may not hold at all stages of development. Nonetheless, this finding reinforces the fact that urban centres have a potential to reduce poverty of their rural hinterlands. This calls for a paradigm shift, especially in the developing countries. Urban planning efforts in developing countries have focused disproportionately on the problems of large metropolitan areas. If small and medium urban centres are to fulfil their potential, then they should form part of the urban planning agenda for developing countries in the 21st century.Urban centres generate both formal and informal employments. Over the period 2006-2012, 750 of the world’s largest cities created 87.7 million private sector jobs accounting for 58% of all new private sector jobs in their 140 countries taken together. Within the same period, industrial sector jobs growth rates held up slightly better in cities where manufacturing is the dominant sector averaging 3.9% from 2001-2003; and 2.9% from 2010-2012 [12]. According to [27], from 1996-2001, 92% of total employment in Greece was in Athens; three-quarters of employment generated in Poland was in Warsaw; 70% of Korean employment growth was located in the Seoul metropolitan area; and, at least 40% of employment expansion in Finland and Sweden stemmed from Helsinki and Stockholm respectively. Among African countries, urban employment grew by an average of 6.8% over the last decade, more than twice the national rate of 3.3%; in India, between 2000 and 2005, urban employment grew at a rate of 3.22% compared to rural employment, which grew by 1.97% [46]. In Urban areas of developing countries, a large share of employment is in medium-sized small and micro enterprises that operate informally. For instance, the informal employment accounts for more than half of non-agricultural employment in Honduras, Nicaragua, Peru, Bolivia, and Paraguay; in India, 41% of both men and women in urban areas were self-employed in 2009/10, and 17% of men and 20% of women were casual labourers; and, in East Asian countries, informal employment represented about 70% of non-agricultural employment during the 2000s [10]. In Africa, two in every three urban residents obtain their livelihood from the informal economic sector, which is thought to be growing at an annual rate of 7% [34]. While employment and employment growth are typically higher in cities, they also contain disproportionate numbers of people who are either unemployed or inactive (or who work in the informal economy). About 47% of unemployment in Organization for Economic Cooperation and Development (OECD) is concentrated in urban regions. This figure reached 60% in the United Kingdom (UK), Japan, the Netherlands, and the USA [27]. Global unemployment is particularly severe in finance, construction, automotive, manufacturing, tourism, services, real estate-all of which are strongly associated with urban areas [46]. Formal unemployment figures are often worst in urban areas, particularly for the urban youth. There are few jobs and many youth lack the qualifications that formal sector work often requires. Urban youth are concentrated in the informal sector [34]. In Nairobi, Kenya, about 50% of men and 80% of women aged 15-24 years have no income generating activities; most of the employed (about 60% of men and 40% of women) are in petty trading or casual employment for survival [10]. Youth are almost three times as likely as adults to be unemployed in South Asia and East Asia. In Southeast Asia and the Pacific they are five times as likely to be unemployed as older workers. Over 25% economically active Middle East and North Africa youth (15-24 years) were unemployed in 2001; however, there is variation across regions, 1% in Qatar to 32% in West Bank Gaza [39]. Cities, especially in developing countries, therefore, have to ensure that urbanization generates sufficient economic growth to provide decent, productive, and remunerative jobs for the rapidly growing labour force.
4.2. Agglomeration Economies
- Evidence suggests that cities can spur economic growth as long as the largest city in a country does not become too large relative to others. Urban policies in the developing countries should, therefore, favour the mobility of resources across cities and regions while avoiding their concentration in a primate city [9]. Cities are centres of economic activities that tend to be associated with enhanced productivity. The higher productivity of urban areas stems from agglomeration economies, which are the benefits firms and businesses derive from locating near to their customers and suppliers in order to reduce transport and communication costs. They also include proximity to a large pool of labour, competitors within the same industry and firms in other industries [46]. Economic gains from agglomeration can be summarized as three essential functions: matching, sharing, and learning [9, 22, 46]. Larger urban scale can facilitate better matches between worker skills and job requirements or between intermediate goods and production requirements for final output. In the labour market, for example, better opportunities for skill matches reduce the search costs of workers with differentiated skills and of employers with differentiated demands for labour [28]. Better matching means greater flexibility, higher productivity and stronger growth [46]. A larger city allows for a more efficient sharing of indivisible facilities (such as infrastructure), risks and the gains from a variety and specialization [9]. Infrastructure sharing makes it cheaper and easier to provide public services in cities. The cost of delivering services such as water, housing, and education is 30-50% cheaper in concentrated population centres than in sparsely populated areas [46]. The benefits of specialization within an urban area have been described by [28]: the gains from specialization arise because denser aggregations of urban communities with a large number of firms producing in proximity can support firms that are more specialized in producing intermediate products; specialization can lead to enhanced opportunities for cost reduction in goods production when the production of components of intermediate goods can be routinized or components of final products mechanized or automated, for example; the gains from specialization extend to the production of services as well. Specialized legal services, for example, may be provided more efficiently by firms that concentrate in specific areas (taxation, copyright law, secured transactions, and so on); in both intermediate goods and services, specialization increases the opportunities for cost reduction; and, the potential gains from specialization are further enhanced by opportunities for sharing inputs among firms- specialized services, such as repair, printing, advertising, communications, and so on can be provided to a wide spectrum of producers, if the density of establishments is high enough. These external gains from specialization may arise because firms producing for final demand are themselves more spatially concentrated by industry or product, giving rise to localization economies. They may also arise because firms producing diverse goods for final demand are more densely packed in space, giving rise to urbanization economies.A larger city can facilitate learning about new technologies, market evolutions, or new forms of organization. More frequent direct interactions between economic agents in a city can thus favour the creation, diffusion, and accumulation of knowledge [9]. The superior flows of information and ideas in cities benefit the firms. This promotes more learning, and innovation. Proximity facilitates the communication of complex ideas between firms, research centres and investors. Close proximity also enables formal and informal networks of experts to emerge which promote comparison, competition, and collaboration [46]. The concentration of talent and skilled people in major cities causes interactions and engenders spillovers of knowledge and skills. Skilled people upgrade their skills and knowledge more efficiently when they are exposed to similar profiles and skilled people in urban areas than in places where they do not interact with peers (rural areas) [2]. This raises productivity in urban areas.The benefits of agglomeration can be offset by rising congestion, pollution, pressure on natural resources, higher labour and property costs, greater policing costs occasioned by higher levels of crimes and insecurity often in the form of negative externalities or agglomeration diseconomies. These inefficiencies grow with city size, especially if urbanization is not properly managed, and if cities are deprived of essential public infrastructure. The immediate effect of dysfunctional systems, gridlock, and physical deterioration may be to deter private investment, reduce urban productivity and hold back growth. Cities can become victims of their own success and the transformative force of urbanization can be attenuated [46].
4.3. The Role of Cities in GDP Creation
- GDP is an estimate of market throughput, adding together the value of all final goods and services that are produced and traded for money within a given period of time. It is typically measured by adding together a nation’s personal consumption expenditures (payments by households for goods and services), government expenditures (public spending on the provision of goods and services, infrastructure, debt payments, and so on), net exports (the value of a country’s exports minus the value of imports), and net capital formation (the increase in value of a nation’s total stock of monetized capital goods) [6]. Home to over 50% of humanity, cities concentrate 80% of global GDP [12]. While the share of urban populations worldwide increased from 33-51% between 1960 and 2010, per capita income increased by 152%- from US$2,382 to US$6006 over the same period [45]. This is a remarkable testament to the wealth generating power of cities. The contribution of urban areas to national income is greater than their share of national population. For instance, Paris accounts for 16% of the population of France, but generates 27% of France’s GDP. Similarly, Kinshasa and Metro Manila account for 13% and 12% of the population of their respective countries but generates 85% and 47% of the income of the Democratic Republic of Congo and Philippines [46]. The urban GDP is greater for cities in developing countries vis-à-vis developed countries indicating that the transformative force of urbanization is likely to be greater in developing countries, with possible implications for harnessing the positive nature of urbanization. In some countries such as South Korea, Hungary, and Belgium, it takes only a single city to contribute the more substantial share of the national wealth. For instance, Seoul contributes almost half of South Korea’s GDP; Budapest and Brussels contributes roughly 45% of Hungary’s and Belgium’s GDP. In other countries, it is a group of cities that accounts for a significant share of national GDP. For example, in South Africa, six major cities concentrating 31% of the total population together contribute as much as 55% of national GDP [42]. Large cities and megacities are influential in the global economy [46]. McKinsey Global Institute (MGI) [23] mapped the economic power of cities by developing a database of more than 2,000 cities around the world (referred to as the MGI Cityscope) and made the following observations: the top 600 cities by GDP accounted for US$ 30 trillion or more than half the world’s GDP in 2007; by 2025 the combined GDP is expected to increase by US$ 34 trillion, contributing more than 60% to world GDP growth. It is projected that the average per capita income in these cities will rise from US$23,000 in 2007 to US$38,000 in 2025, nearly twofold increase. The cities in the top 600 consisted mainly of those from developed regions in 2007. By 2025, it is projected that 136 new cities will enter the top 600, all of them from the developing world; 100 new cities will be from China, 13 from India, 8 from Latin America, and the rest from other regions of the developing world. Nine of the world’s top 25 cities ranked by GDP will be located in Asia by 2025, up from two in 2007. From the MGI Cityscope: 254 cities in the United States and Canada accounted for more than 20% of the global GDP in 2007- by 2025 the North American cities will contribute just over 10% of the global GDP growth; 168 Western Europe’s leading cities contributed 18% of the global GDP in 2007- it is projected to contribute 5% of the global GDP by 2025; the China region (Hong Kong, Macao, and Taiwan) had 611 cities in 2007 contributing 5% of the global GDP- by 2025, it is projected that they will generate around 20% of worldwide GDP; South Asia’s 229 cities had a share of 1% of the global income, which is expected to rise to 4% by 2025; over 70% of Latin America’s GDP was accounted for by 194 cities in 2007-this will rise to 75% of the region’s GDP; in 2007, 143 cities in Sub-Saharan Africa (SSA) contributed 50% of the region’s GDP- by 2025 this is expected to rise to more than 60% of the region’s GDP (the region’s contribution to the world’s wealth will still remain at 2%); and, Middle East’s and North Africa’s 140 cities generated nearly two-thirds of the region’s GDP- this is expected to double by 2025; the region contributed 2% of the global GDP in 2007, which is expected to rise to 3% by 2025. The trend depicted here is that of shifting economic power eastward.The positive link between urbanization and national productivity holds mainly for high- and middle-income countries, signalling healthy urbanization dynamics fuelled by prosperous cities acting as magnets for rural migration. Low-income countries display a mixed trend. While these (i.e. low-income) countries as a whole experienced a fast pace of urbanization from 1960, GDP per capita remained largely unchanged, and even decreased, particularly between 1970 and the year 2000. This would suggest that, rather than being attracted by better economic opportunities in urban areas (‘demand pull’), rural migrants were only seeking refuge from famine, war or other calamities in what is often referred to as ‘supply push’ urbanization [45]. The World Bank, in its recent World Development Report observed that, while countries in the Eastern and South-eastern Asia, such as China, Indonesia, Malaysia, Thailand, and Viet Nam experienced a steady increase in GDP per capita as people moved to cities, a similar increase in GDP per capita with urbanization was not observed in SSA. Cameroon, Liberia, Madagascar, and Zimbabwe experienced no growth or decline in GDP per capita with urbanization, while data from Guinea Bissau, Ghana, and Nigeria indicated a weak positive link between urbanization and income [37]. Despite African cities generating about 55-60% of the continent’s GDP, 43% of its urban populations live below the poverty line [2]. Urban poverty in Africa frequently manifests itself in unequal access to decent housing.
5. Conclusions
- Even though various countries are on different paths of economic development, and are making the urban transition at different times, and different growth patterns, it remains quite clear that urbanization is an inevitable outcome of the development process. No city has ever reached middle income status without significant population shift into cities. Shaping strategies that make cities work for the national economy will demand pragmatism and sensitivity to what is viable in a given context. Such strategies will reap large rewards.There is need for urbanization strategies that consider conservation of biodiversity. This is especially so in the case of developing countries where most urban expansion near PAs and biodiversity hotspots are expected. In these places, urbanization strategies have the potential to affect the form of urban expansion with significant consequences for biodiversity. There are two crucial aspects of these efforts: first is to ground the research on the relationship between urbanization and biodiversity on a firm theoretical foundation; the second is making findings from this research accessible and useful to those who can most benefit from them. These include citizens, community organizations, planners, and governmental representatives alike. This dissemination of information and connection of science to practitioners will be an important tool for formulating more robust urbanization strategies that specifically consider biodiversity.There is a wide consensus that the policy package to reduce GHG emissions from transport should contain three types of policies: reductions in private motorized transportation and increases in public and non-motorized modes of transport; increases in the fuel efficiency of vehicles and the use of alternative fuels; and, the promotion of density and efficient public transportation. These actions have concrete and measurable co-benefits. For instance, more compact (dense) cities have benefits such as: lower per capita emissions, provided that they are served by good public transport systems; enables more energy-efficient heating and cooling in buildings, and lower embedded energy demand for urban infrastructure; enhances savings in operating costs from shorter transport networks and less diffuse utility infrastructure; more productive and innovative; and, compact, well-managed cities with intelligent infrastructure can be more attractive to walkers than suburban or rural communities. Additionally, complementary measures including fiscal policy (fuel tax, vehicle tax, congestion, and parking charges), regulatory policy (fuel standards, emission standards, and vehicle inspection), and temporary subsidies and tax breaks can also be used to contain rising emissions from urban transport in developing countries.In an era where formal employment opportunities across the world are dwindling due to global economic recession, urban planning can play a key role in facilitating livelihoods through local economic development. Local economic development is a community empowering, participatory process in which local governments, local communities society, as well as the private and public sectors work together to stimulate and improve the local economy of a given area. Urban planning could also create the enabling conditions for employment to thrive by adopting more flexible land use management or zoning systems that allow mixed land uses, as opposed to mono-functional zoning that seeks to segregate different activities. Urban planning can also play an integral role in developing building codes that ensure safety standards in components of the built environment. However, a major challenge that planning is likely to face is enforcing adherence to building codes, particularly in developing countries.
ACKNOWLEDGEMENTS
- The author wishes to acknowledge all researchers, institutions, and authorities whose works were invaluably useful during this undertaking.