-
Paper Information
- Paper Submission
-
Journal Information
- About This Journal
- Editorial Board
- Current Issue
- Archive
- Author Guidelines
- Contact Us
World Environment
p-ISSN: 2163-1573 e-ISSN: 2163-1581
2018; 8(1): 15-19
doi:10.5923/j.env.20180801.02

Water Quality Analysis of Bobobo Stream, in Tarkwa, Ghana
 Abstract
 Reference
 Full-Text PDF
 Full-text HTML
Victus Bobonkey Samlafo 1, Emmanuel Ofosu Ofoe 2
1Department of Chemistry Education, University of Education, Winneba, Ghana
2Blessed Tutorial College, Kasoa, Ghana
Correspondence to: Victus Bobonkey Samlafo , Department of Chemistry Education, University of Education, Winneba, Ghana.
| Email: |  |
Copyright © 2018 Scientific & Academic Publishing. All Rights Reserved.
This work is licensed under the Creative Commons Attribution International License (CC BY).
http://creativecommons.org/licenses/by/4.0/

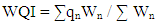
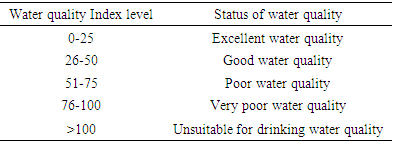
The fitness of Bobobo stream for domestic use was evaluated with an established and vigorous water quality index (WQI), adapted for the stream under study. Nine physicochemical parameters which are life-threatening in water, were used to compute the WQI. These parameters were pH, dissolved oxygen, sulphates, nitrates, chlorides, total dissolved solids, total suspended solids, total alkalinity and total hardness. The evaluated WQI was 57.13, which was within poor drinking water category. Consequently, the water needs to be treated to make it potable. Government and mining companies in the area need to improve their social interventions by always providing potable water to the people in the catchment area especially during water crisis.
Keywords: Bobobo stream, Mining, Water quality index, Tarkwa, Fitness, Human health
Cite this paper: Victus Bobonkey Samlafo , Emmanuel Ofosu Ofoe , Water Quality Analysis of Bobobo Stream, in Tarkwa, Ghana, World Environment, Vol. 8 No. 1, 2018, pp. 15-19. doi: 10.5923/j.env.20180801.02.
Article Outline
1. Introduction
- Freshwater is of vital concern for mankind since it is directly associated with human health. The surface water bodies which are the essential sources of water for human activities are constantly under severe environmental stress and are being threatened as a result of mining (both legal and illegal) and developmental activities [1]. In view of the spatial and temporal variations in the hydrochemistry of surface waters, regular monitoring programmes are required for reliable estimates of the water quality [2]. Water quality monitoring is a helpful tool not only to evaluate the impacts of pollution sources but also to ensure an efficient management of water resources and the protection of aquatic life [2]. Bobobo stream is a spring water that gushes from underground and runs within the Municipality and falls from a height at a locality called Bobobo in Tarkwa, an urban settlement, where both legal and illegal mining activities are on the ascendancy. The people in the locality drink this water directly without any form of treatment. However, the Municipality is under severe mining activities and there is the likelihood that, the activities of these miners especially the illegal ones have a very high potential of contaminating the Bobobo stream.There are several ways to determine the quality of water considered fit for drinking, irrigation and industrial use. Water quality index (WQI), indicating the water quality in terms of an index number, offers a useful representation of the overall quality of water for public or any intended use such as pollution abatement programmes and in water quality management [1]. In general, water quality indices incorporate data from multiple water quality parameters into a mathematical equation that rates the health of a waterbody with a number [1].The objective of this study was to assess the water quality of Bobobo stream and its fitness for drinking and its effect on human health, as residents in the catchment area of the stream continue to use the water from this stream for domestic purposes without any form of chemical treatment.
2. Materials and Methods
2.1. Study Location
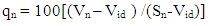
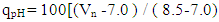
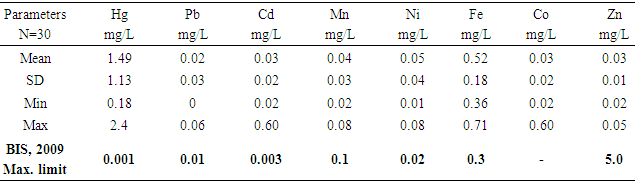
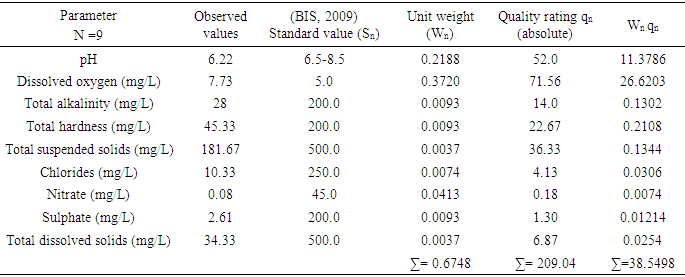
- Bobobo stream flows within Tarkwa, the capital of Tarkwa- Nsuaem Municipal Assembly in the Western Region of Ghana. The Municipality is located between latitude 4° 5′ and longitude 5° 5′. The Municipality is part of the Birimian and Tarkwain geological formations. Economically, the Birimian rocks are regarded as the most important formations due to its mineral potentials. These geological formations justify the existence of high mineral deposits in the Municipality, hence, many gold and manganese mining companies are located in the Municipality.Tarkwa- Nsuaem Municipality lies within the South-western equatorial climatic zone. The forest is full of climbers and lianas, which are able to reach into the upper tree layer. Economic trees include mahogany, wawa, odum, sapele among others. Tarkwa Nsuaem can boast of large forest reserves like the Bonsa reserve, Ekumfi reserve, Neung south reserve and Neung north reserve. Temperatures range between 26°C and 30°C with a high relative humidity of about 70 -80% throughout the year. The Municipality experiences the highest rainfall in Ghana, with a mean annual rainfall of 1,500 mm which is double maximum [3]. Samples were taken in triplicate at each sampling point from both downstream and upstream during the dry and the wet seasons, three times during the period of the study. A total of thirty samples were taken during the study period into previously acid – washed one-litre polyethene containers [4]. Samples for metal analysis were acidified with 1.0 mL concentrated nitric acid per litre of sample and labelled. Separate samples collected for physicochemical analysis were stored in a fully filled 250.0 mL screw-neck glass bottles without any pre-treatment except for dissolved oxygen [4]. At each sampling point, the water to be sampled was used to rinse the sample containers twice to avoid sample contamination.All samples were stored at 4°C in a refrigerator in the laboratory prior to analysis. Samples for physicochemical analysis were analysed within a week [5]. All chemicals used were of analytical grade. The pH of the water samples was determined in situ with HANNA metre model HI 9032. Other physicochemical parameters such as total alkalinity, dissolved oxygen (DO), chloride (Cl-), ammonia (NH3-N), sulphate (SO42-), nitrite (NO2-N) nitrate (NO3-N), total solids (TS), total suspended solids (TSS), total dissolved solids (TDS) and major metals were analysed based on water quality methods drawn from APHA [6]. The major metals such as Fe, Zn, Co, Mn, Ni, Pb, Hg, and Cd were determined at the respective wavelengths by Varian Fast Sequential Atomic Absorption Spectrophotometer (AAS). Mercury was, however, measured by cold vapour, using 1.1% (w/v) SnCl2 in 3% (v/v) HCl as the reductant at 253.7 nm wavelength. The suitability of Bobobo stream for domestic use was determined using water quality index as indicated below:The water quality index (WQI) was estimated using the weighted arithmetic water quality index, developed by Brown [7]. In estimating the water quality index, nine water parameters which were considered to be life-threatening were used based on the Bureau of Indian Standards (BIS, 2009) [9], which was adapted from International Organization for Standards (ISO), as the standard to be met for drinking water (Table 3). The weighted arithmetic water quality index is given by the relation
 | (1) |
 | (2) |
 | (3) |
 | (4) |
 | (5) |
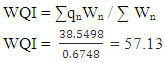
3. Results and Discussion
- Water quality index of Bobobo stream is established from various important physicochemical parameters. The values for these physicochemical parameters in estimating the WQI are indexed in Table 3 using the Bureau of Indian Standards [9] as the standard to be met for drinking water. The estimated WQI of 57.13 (Table 4) obtained for Bobobo stream fell within poor drinking water category. The water quality rating demonstrates that the status of Bobobo stream is not suitable for drinking and other domestic purposes. The above index for the water quality is supported by the seasonal variations in the various physicochemical parameters used to compute the WQI. One of the physicochemical parameters used in computing the WQI is pH (Table 1). The pH is a critical parameter which controls the suitability of water for various uses. The pH varied from 5.83 to 6.69 with a mean of 6.22 and a standard deviation of 0.44 (Table 1). The mean pH of 6.22 was found to be slightly acidic and fell below the acceptable level of between 6.5-8.5 [9]. The pH was rather high during the dry season (December) and low during the wet season (July). This might be due to discharges from the mine waste into the stream during the wet season. A similar study conducted reported low pH levels in Bonsa river in the same Municipality [4]. Low pH enhances heavy metal dissolution in water with its health-threatening problems. Dissolved oxygen (DO) which was also factored in the WQI estimation, ranged from 6.40 mg/L to 9.75 mg/L with a mean of 7.73 mg/L and a standard deviation of 1.78 (Table 1). The mean level of 7.73 mg/L was higher than the recommended level of 5.0 mg/L [9]. Dissolved oxygen was generally higher during the wet season (July) because of much turbulence of running waters into the stream. A high dissolved oxygen level in a community water supply is good because it makes drinking water taste better. However, high dissolved oxygen levels speed up corrosion in metal water pipes and metals that might find their way into the stream.Total suspended solids (TSS) also featured in the WQI equation. It ranged from 9 mg/L to 494 mg/L with a mean of 181.67mg/L and a standard deviation of 270.99 (Table 1). The mean level of 181.67 mg/L was below the acceptable level of 500.0 mg/L [9]. The dry season recorded higher total suspended solids contrary to the expected higher levels during the wet season. This might due to the reduction in the volume of water in the stream during the dry season and the settling of heavy dust particles that come with the dry winds. Total dissolved solids (TDS) used in the WQI equation ranged from 8.0 mg/L during the wet season to 68 mg/L during the dry season with a mean of 34.33 mg/L and a standard deviation of 30.67. The mean level of 34.33 mg/L was below the recommended level of 500.0 mg/L [9]. The seasonal variation might be due to the small volume of water in the stream during the dry season as compared to the period of the wet season. Total dissolved solids in water supplies originate from natural sources, such as sewage, urban and agricultural run-off, and industrial wastewater. These sources contribute to the total dissolved solids loading of water supplies [10]. No recent data on health effects associated with the ingestion of total dissolved solids in drinking-water appear to exist; however, associations between various health effects and hardness, rather than total dissolved solids content, have been investigated in many studies [10].Total hardness (TH), a parameter used in the estimation of WQI ranged from 32 mg/L during the wet season to 54.0 mg/L in the dry season with a mean of 45.33 mg/L and a standard deviation of 11.72 (Table 1). The mean level of 45.33 mg/L was below the acceptable limit of 200.0 mg/L [9]. The seasonal fluctuations in total hardness correlated well with the total dissolved solids.
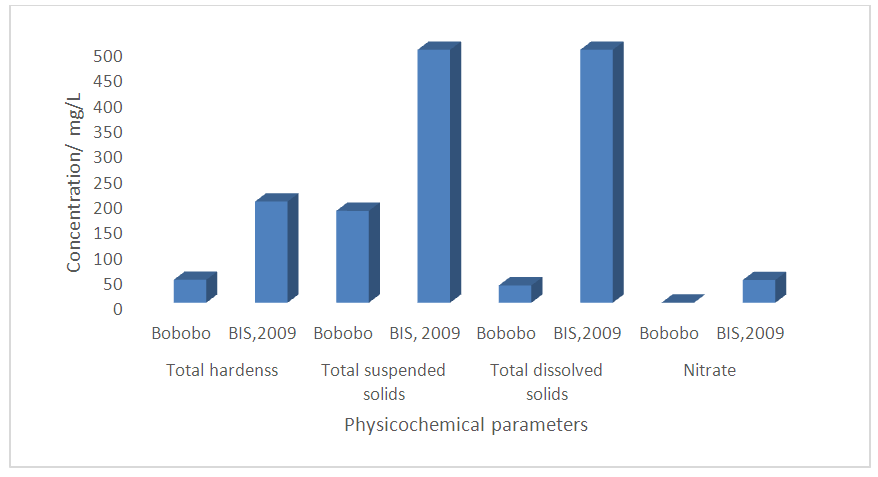 | Figure 1. Determinant parameters used in computing WQI with respect to the standard to be met |
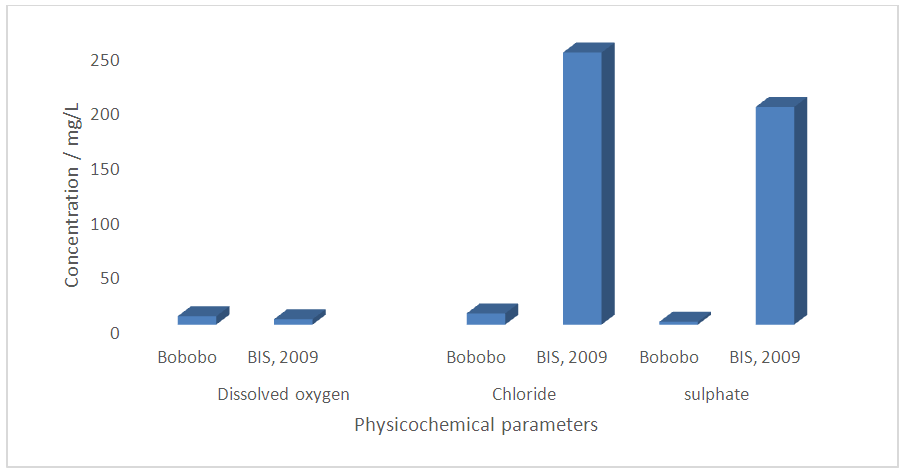 | Figure 2. Determinant parameters used in computing WQI with respect to the standard to be met |
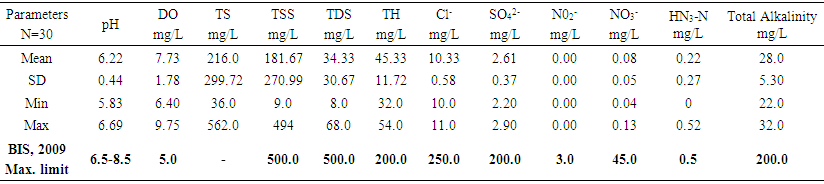 | Table 1. Mean levels of major physicochemical parameters in Bobobo stream |
|
|
|
4. Conclusions
- The Bobobo stream is not fit for drinking per the standard to be met, based on computed WQI of 57.13. Drinking untreated water from the Bobobo stream is likely to result in water-related epidemics among the residents in the catchment area. The Municipality should provide treatment to the water and supply or the mining companies should strengthen their social responsibilities of providing some alternate sources of potable water.
ACKNOWLEDGEMENTS
- The authors appreciate the contribution of Mr Bobobee, a senior lecturer at the Chemistry Education Department, University of Education, Winneba for reading through the draft manuscript and making very important submissions.