World Environment

p-ISSN: 2163-1573    e-ISSN: 2163-1581

2017;  7(1): 1-9

doi:10.5923/j.env.20170701.01


Correlation between Air Temperature and Atmospheric Turbidity at a Subtropical Location

M. El-Nouby Adam1, 2, Eman F. El-Nobi2

1Quality Assurance Unit (ALI), King Saud University, Riyadh, Saudi Arabia

2Faculty of Science (Physics Department), South Valley University, Qena, Egypt

Correspondence to: Eman F. El-Nobi, Faculty of Science (Physics Department), South Valley University, Qena, Egypt.

Email:

Copyright © 2017 Scientific & Academic Publishing. All Rights Reserved.

This work is licensed under the Creative Commons Attribution International License (CC BY).
http://creativecommons.org/licenses/by/4.0/

Abstract

Population growth, mechanization, and industrialization have now made humanity the equivalent of other natural processes in its effect on air-pollution levels and associated climatic change. The significant correlation between air temperature (T) and atmospheric turbidity has been recognized. Given the fundamental role played by atmospheric turbidity and the lack of studies concerning its magnitude at Qena, Egypt, the current study has introduced an assessment of this parameter. Because of the unavailability of spectral measurements, a model has been used to estimate hourly values of the Linke turbidity factor (TL) from broadband measurements of direct normal irradiance (In) from 2001 to 2004. The results describe a clear picture of TL under cloudless sky conditions. The frequency distribution of TL has been shown, and the influence of T on TL has been investigated. To see the effect of T on TL more clearly, further analysis was performed. The values of TL were classified according to the corresponding air temperature in 1°C intervals. Then the average TL for each interval was estimated. The study showed that for T ≤22°C, the average value of TL decreased with increasing T, but for T > 22°C, the value of TL rose with increasing T. In both cases, a quadratic equation could be fitted to the dependence of the average TL on T (the coefficients of determination of the fitted lines were 0.33 and 0.98, respectively). Based on the variability of T, an attempt was made to explain the diurnal variation of average monthly, seasonal, and overall hourly TL as illustrated by the results presented.

Keywords: Solar radiation, Air pollution, Atmospheric turbidity, Air temperature, Precipitable water

Cite this paper: M. El-Nouby Adam, Eman F. El-Nobi, Correlation between Air Temperature and Atmospheric Turbidity at a Subtropical Location, World Environment, Vol. 7 No. 1, 2017, pp. 1-9. doi: 10.5923/j.env.20170701.01.

1. Introduction

The attenuation of solar radiation through a real atmosphere versus that through a clean, dry atmosphere gives an indication of atmospheric turbidity. Atmospheric turbidity is associated with atmospheric aerosol load. These aerosols are solid and liquid particles suspended in the atmosphere and ranging in size from 10–3 μm to several tens of microns [1]. As a result of the relation existing between aerosols and attenuation of solar radiation reaching the Earth’s surface, various turbidity factors based on radiometric methods have been defined to evaluate atmospheric turbidity [2]. These factors include the Linke turbidity factor (TL), the Ångström turbidity coefficient, the Shueppe turbidity coefficient, and the Unworth-Montath coefficient [3]. The best choice among these factors depends on the application under consideration. To characterize total extinction by the atmosphere, TL is an appropriate measure [4]. It refers to the whole spectrum, that is, overall spectrally integrated attenuation, including the presence of water vapor and aerosols. It is also considered to be one of the first simple measures of the contents of the atmosphere. In addition, earlier studies mentioned that TL remain a useful parameter because of its inherent simplicity and the existing long series f published data based on it [5]. Some researchers have used TL data to derive the Ångström turbidity coefficient β from empirical relationships [6, 7, 8, 1, 9, 10, 11]. However, such empirical relationships may not provide a good estimate of β in all cases [12, 13]. If spectral measurements are not available, several models can be used to estimate TL from broadband measurements of direct irradiance [14, 15, 16, 5, 1, 9]. Because spectral measurements were unavailable, this study has used broadband direct irradiance measurements to estimate atmospheric turbidity.
The study of atmospheric turbidity is important in meteorology, climatology and for monitoring of atmospheric pollution [4, 3, 17, 1]. It is also an important parameter for predicting solar energy availability under cloudless skies, which is essential for designing solar thermal power plants and other solar energy conversion devices with concentration systems. This means that it is essential to study the performance of solar radiation devices at a particular location before installing them [18]. Malik (2000) and Guechi et al. (2011) mentioned that studying the efficiency of solar-cell modules under a variety of atmospheric turbidity and weather conditions is essential to optimize their performance because an increase in turbidity reduces the output current of solar cells. The reason why this is not done is often the unavailability of atmospheric data for the specific location for which the solar system will be designed. Accordingly, photovoltaic and solar thermal energy systems are usually designed considering their performance under standard test conditions, without taking into account the state of the local atmosphere [9]. Hence, it is important to provide a clear picture of atmospheric turbidity in the region of this study (Qena, Egypt). Qena, as a subtropical location, is a city of abundant solar radiation for most months of the year. Accordingly, it would appear to be well suited to the use of solar energy in various applications because of the interest that this form of clean energy elicits as a way to solve the energy demand problem [19, 20]. El Shazly et al. (1997) concluded that the incoming solar energy at Qena is a significant source of renewable, clean energy that is sufficient to supply people in the area with the energy they need.
Therefore, the main objective of this research was to study the characteristics of TL under clear skies at Qena, Egypt. The dependence of TL on T is discussed in Section 3.2. Based on the relationships found, the diurnal variation of average monthly, seasonal, and overall hourly TL has been explained in Section 3.3.

2. Data

2.1. Computing the Linke Turbidity Factor (TL)

As mentioned above, the Linke turbidity factor (TL) represents the whole spectrum, that is, overall spectrally integrated attenuation, including water vapor and aerosols [21]. In addition, several investigators have derived TL from broadband direct irradiance measurements. These measurements are routinely performed with pyrheliometers, which offer relatively low cost, high stability and accuracy, and ease of use and calibration [5]. The following equation is used to estimate TL using the broadband direct normal solar irradiance, In [22, 1, 23, 18]:
(1)
where Io is the extraterrestrial normal solar radiation, which is estimated (Eq. (2)) using the day number of the year (n) and the solar constant (ISC). In addition, ma is the relative optical air mass as described by Kasten (1966) (Eq. (3)) using the solar zenith angle in degrees (SZA). The Rayleigh optical thickness was estimated using Eq. (4) proposed by Kasten (1980). More details about the theoretical background of TL and its computation techniques can be found in El Shazly (1996):
(2)
(3)
(4)
Rahoma and Hassan (2012) commented that Linke (1922) recognized the variation of TL with ma, but had little success in developing a new relationship. El Shazly (1996) eliminated the partial dependence of TL on ma by setting ma=2 and using the Kasten formula [24] introduced for this purpose. He illustrated that the effect of ma at Qena was weak because of the deviations of ma from the assumed value ma=2 in this city (the average value of ma was 2.33±0.46). The average value of ma for all the cases (8480) used in the current study was equal to ≈2 (with standard error of estimation SEE = 0.01). Accordingly, Eq. (1) was used to determine TL in the study area.

2.2. Measurements

The hourly values of the solar radiation components of In, global (G) and diffuse (D), used in this study were measured by South Valley University (SVU) Meteorological Research Station (MRS). The hourly values (hour integral irradiance) of In, G, and D under all sky conditions were collected from 2001 to 2004. In addition, the cloud amount (in octas) was used in this work to describe the state of cloudiness of the atmosphere. It is visually observed at the end of each hour in the study station. According to these visually observed, the datasets of In, G and D, were classified. The dataset of In under cloudless sky conditions were separated out to determine TL. Moreover, the present study used the separated datasets of both G and D to determine D/G ratio under cloudless sky conditions (Kd).
SVU-MRS is located at Qena, Egypt (26.20°N, 32.75°E, and 96 m amsl) and can be defined as an urban site. The Egyptian Meteorological Authority (EMA) is responsible for scientific advice, calibration, and quality systems for the Egyptian Monitoring Network. The accuracy of the radiometric instruments is in the first class according to the World Meteorological Organization classification [25, 26]. Moreover, these instruments are calibrated each year against a reference instrument that is traceable to the World Radiometric Reference (WRR) maintained at Davos, Switzerland [27, 28]. More details, including a description of the site, instruments, and data collections at the SVU meteorological research station, can be found in previous papers by the author (e.g. [29, 30, 6, 31, 8, 32, 33, 34, 35, 36, 37]). The Precision Spectral Pyranometer (PSP) No. 16317IS is an ISO 9060 secondary standard pyranometer with a spectral range of 295–2800 nm. It is used for precise measurement of global solar radiation. In addition, diffuse solar radiation (D) was measured by shading the direct beam from a similar pyranometer using an anodized aluminum shadow band [20]. The direct normal solar irradiance was recorded by a normal-incidence pyrheliometer (NIP), KZ No. 970159IS. The Combilog Datalogger (No. 1020, Th. Friedrichs & Co., Germany) recorded the hourly values of In, G, and D.
Furthermore, meteorological parameters such as air temperature (T), relative humidity (RH), and cloudiness were recorded. The values of precipitable water content (W) were estimated using Eq. (5). Leckner (1978) presented this equation for estimating W using the relative humidity as a fraction of one (RH) and the ambient temperature in Kelvin (T):
(5)

3. Results and Discussion

3.1. Hourly Results for the Linke Turbidity Factor (TL)

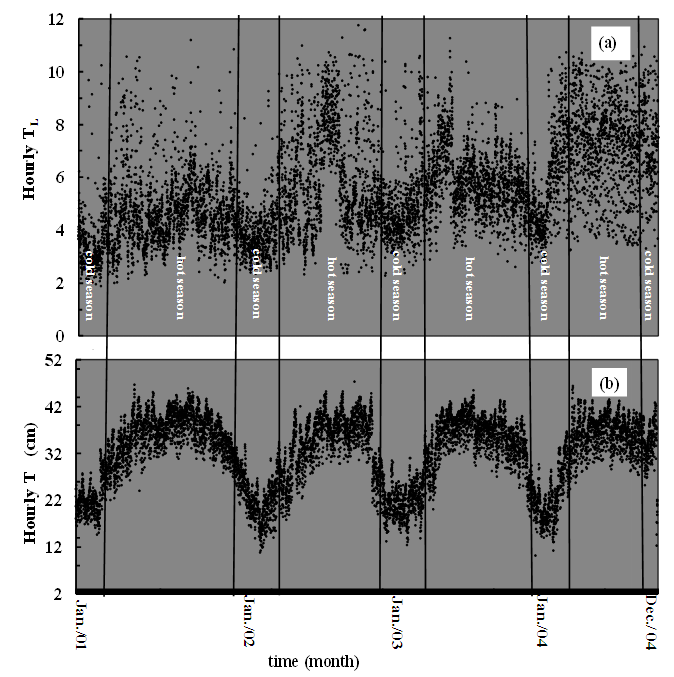
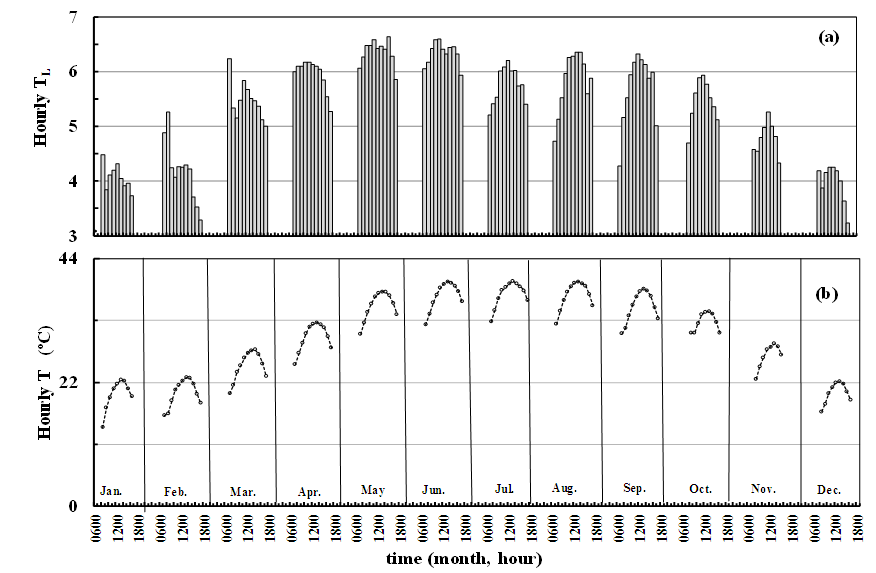
The temporal variation of the hourly results for the Linke turbidity factor (TL) in the study area was examined. The fluctuations in TL from 2001 to 2004 were also analyzed. Figure 1 shows the fluctuations in TL and T during the study period. The figure reflects a remarkable variation from hour to hour. The behavior of TL may be due to changes in atmospheric conditions, which affect the content of water vapor and dust particles in the atmosphere similarly to T and W. In addition, the effect of the Kd ratio (which refers to the amount of aerosols in the atmosphere) on TL was considered. El Shazly (1996) concluded that the values of TL at Qena are highly dependent on variations in T, W, Kd, and sometimes variations in wind. In this research, the diurnal variation of TL has been characterized (sections 3.2 and 3.3). Correlations between T and both W and the Kd ratio were used. The dependence of TL on T was explained based on changes in both W and the Kd ratio (3.2). Figure 1a shows that, over the whole period, TL ranged from ≈ 2 to 11.8. The maximum value of TL at Qena is less than the maximum for Cairo (11.87), but higher than the maximum for Aswan, 10.8 [38]. The maximum value occurred at 12:00 on August 7, 2002, under conditions of T= 42°C, W= 2.8 cm, and Kd= 14.43%. In addition, the minimum value occurred at 17:00 on February 21, 2001 (T= 17ºC, W= 0.9 cm, and Kd = 17.59%). According to Adam and El Shazly (2008), during daytime hours (8:00 A.M. to 3:00 P.M.), the atmosphere tended to be generally unstable, with some neutral conditions. At 12:00 (on August 7, 2002), the stability rating was slightly unstable. This stability rating reflects a surface wind speed of less than 6 m/sec and a value of G= 3.8 MJ m–2. These atmospheric conditions, representing upward convection currents of hot air loaded with aerosols, made the atmosphere more turbid. At 17:00 (on February 21, 2001), the atmosphere tended to be neutral, and the value of G was in the very low class (0.74 MJ m–2).
Figure 1. Fluctuation of hourly values of TL (a) and T, in ºC (b) at Qena from 2001 to 2004
Generally, Fig. 1a shows that high values of TL occur in the hot seasons; however, the average TL was 5.51±0.26 (the average value of T was 34.75±2.22°C). In the cold seasons, the average value of TL was 4.45±0.44 (the average value of T was 23.54±2.54°C). The effect of T on this variable will be studied in the next section (3.2). According to earlier studies (e.g. [5]), this behavior of TL is due to the effects of anthropogenic air pollutants and of particles emitted from the desert. They mentioned that these particles increase the diffuse component of solar radiation and reduce the values of In. The presence of these particles tends to change the diffusion of beam solar radiation into diffuse radiation. As mentioned earlier, Qena is located between the eastern and southern deserts in the southern part of Egypt (close to Aswan), in an area which contain large particles like sand. These coarse particles can increase the diffusion component.
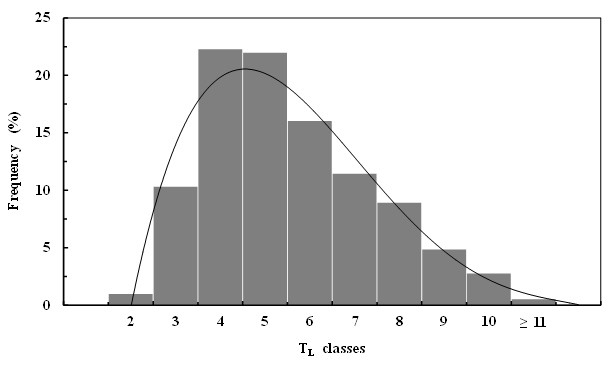
To obtain a clear picture of atmospheric turbidity, the TL frequency distribution in the study area from 2001 to 2004 was used. Figure 2 presents the frequency distribution of the data measured for different classes of TL during the measurement period. TL was classified into ten classes: 2, 3, 4, 5, 6, 7, 8, 9, 10, and ≥ 11. Each class includes the values which are closer to the index of the class than to any other index. For example, class 5 includes the values closer to 5 (4.45-5.44). In addition, class 2 indicates a low content of water vapor and dust particles in the atmosphere. Moreover, the dataset for TL ≥11 represents values of TL ≥ 10.45 (this class indicates a high content of water vapor and dust particles in the atmosphere). The frequencies of TL values for these classes were 0.98%, 10.31%, 22.28%, 21.95%, 16.03%, 11.44%, 8.92%, 4.83%, 2.76%, and 0.51% respectively. It is apparent that the frequency distribution over the whole period has a peak of about 22.28%, which falls into TL class interval 4. These results seem reliable if one considers the nature of atmospheric stability in the study region. Most unstable atmospheric conditions occur between 6 A.M. and 6 P.M. However, 92% of daytime hours (7:00 to 17:00 LST) during the study period are characterized by unstable atmospheric conditions [36].
Figure 2. Frequency distribution (%) of the data measured for different classes of TL at Qena from 2001 to 2004

3.2. Effect of Air Temperature on TL

The importance of meteorological factors in the transport and diffusion stage of the air-pollution cycle is well recognized [39, 40, 41, 42]. Adam (2013b) stated that these factors play an important role in ambient distributions of air pollution. The influx of pollutants from the ground surface, their residence in the atmosphere, and the formation of secondary pollutants is controlled not only by the rate of emission of the reactants into the air from the source, but also by wind speed, turbulence level, air temperature, and precipitation. Hence, it is often important to understand the physical processes leading to an observed concentration of pollutants at a given point. In addition, Adam (2003) mentioned that diurnal variation of temperature near the ground is one of the key characteristics of the atmospheric boundary layer over land [43]. Therefore, in this section, the correlation between T and other atmospheric conditions that affect the content of water vapor and dust particles in the atmosphere (such as W and Kd) is illustrated, and accordingly the correlation between T and TL is analyzed. The analyses were carried out to quantify the relationship, if any, between the hourly values of T and the variables (W, Kd).
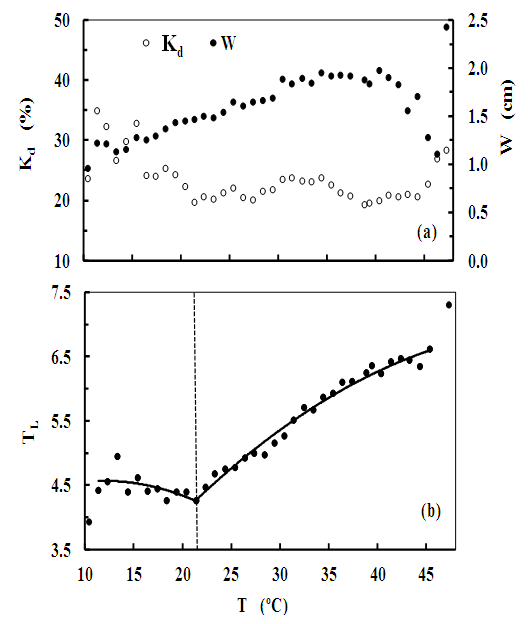
Figure 1(b) illustrates the variation of the hourly values of T during the period under study. Analysis of these results showed that the correlations between T and both W and Kd were weak (0.28 and –0.08 respectively). To see more clearly the effect of air temperature (T) on these variables (W and Kd), further analysis was undertaken. The values of W and Kd were classified according to the corresponding air temperature in 1°C intervals. Then the average values of W and Kd for each interval were estimated. In this section, these average values are used to study the correlations between T and both W and Kd (Fig. 3a).
From Fig. 3b, it is evident that for T≤22°C, W increases and simultaneously Kd decreases with increasing T. This occurs because, at low temperatures, condensation of water vapor and formation of mist occur, leading to an increase in the Kd ratio. With increasing T, condensed water begins to evaporate and mist disappears, leading to an increase in W and a decrease in Kd (the minimum value of average Kd was ≈ 19%). For T>22°C, both W and Kd increased with increasing T. This occurs because when the Earth’s surface temperature increases substantially, upward convection currents of hot air loaded with aerosols make the atmosphere more turbid. The dependence between T and both variables is clear. Adam and El Shazly (2008) found that during daytime hours (8:00–15:00 LST), the atmosphere tends to be generally unstable, with some neutral conditions. However, under unstable atmospheric conditions, dust concentrations decrease with decreasing atmospheric instability. During the increase and decrease of both variables, their values fluctuated according to the formation of secondary pollutants and the rates of emission of reactants into the air from the source [31]. The correlations between T and both W and Kd were 0.81 and 0.74 respectively. The regression lines reflect that 66% and 55% of the variance in W and Kd respectively can be explained by the variation in T. This result reflects the strong effects of T on other atmospheric conditions that affect the content of water vapor and dust particles in the atmosphere (such as W and Kd). Therefore, the effect of T on atmospheric turbidity will be discussed with a view to increasing our knowledge of the diurnal variability of this variable at Qena.
Figure 3. Dependence of Kd (%), W (cm) (a) and TL (b) on T (in ºC) at Qena from 2001 to 2004
Figure 3b illustrates the variation of average TL with increasing T. It is apparent that at low temperature (10°C ≤ T ≤ 22°C), the average value of TL decreases with increasing T. This behavior may be due to the frequent mist and higher relative humidity in the morning, phenomena which indirectly increase the extinction cross-section of hygroscopic aerosols and the frequent occurrence of inversions which dissipate in late morning, enabling dispersion of aerosols [44, 45]. Generally, at Qena, low temperatures occur in early morning and late afternoon during some months (such as January, February, March, April, November and December, known as the cold season). In addition, these results are in agreement with those of El Shazly (1997), who studied atmospheric transparency at Qena and found that the atmospheric transparency coefficient decreases toward sunset due to the high aerosol content in these hours. The relation between T and TL can be expressed by the following equation:
(6)
The coefficient of determination of the fitted line was 0.33. Hence, the regression line represents 33% of the variance in TL. The less noticeable behavior of TL is due to the decreased quantity of aerosols suspended in the atmosphere. Low temperatures lead to condensation of water vapor and formation of mist, which cause a reduction of direct solar radiation and an increase in the Kd ratio, leading to an increase in TL. Subsequently, the decrease in Kd with increasing T was due to evaporation of condensed water and disappearance of mist, leading to a decrease in TL.
Figure 3b illustrates that at high temperatures (T>22°C), the average value of TL increases with increasing T. The relationship can be represented by the following equation:
(7)
The coefficient of determination of the fitted line was 0.98, meaning that the regression line represents 98% of the variance in TL. The rise in TL with increasing temperature is due to the increase in W with increasing T. As the Earth’s surface temperature increases substantially, upward convection currents of hot air loaded with aerosols make the atmosphere more turbid, leading to increases in TL. In addition, during the afternoon hours, the values of hourly TL change with changing T, clearly illustrating the dependence between TL and T. El Shazly (1996) demonstrated that TL is mainly dependent on T. Adam and El Shazly (2008) found that during daytime hours (8:00–15:00 LST), the atmosphere tends to be generally unstable, with some neutral conditions. However, under unstable atmospheric conditions, dust concentrations decrease with decreasing atmospheric instability.
From the above discussion, it is clear that the variability of TL at Qena during the study period was in agreement with other studies (in Cairo). El Hussainy (1986) and Kassem (1997) found that TL decreased gradually with increasing T until ≈ 25°C, after which TL increased again with increasing T. In addition, they showed that TL increases as W increases. They also showed that the results were to be expected because increases in W cause reductions in solar radiation due to scattering and absorption. Hence, TL decreased.
The next step was to introduce a regression formula to study the simultaneous effect of T, W, and Kd on TL. The following equation represents the fitted linear regression between TL and these variables:
(8)
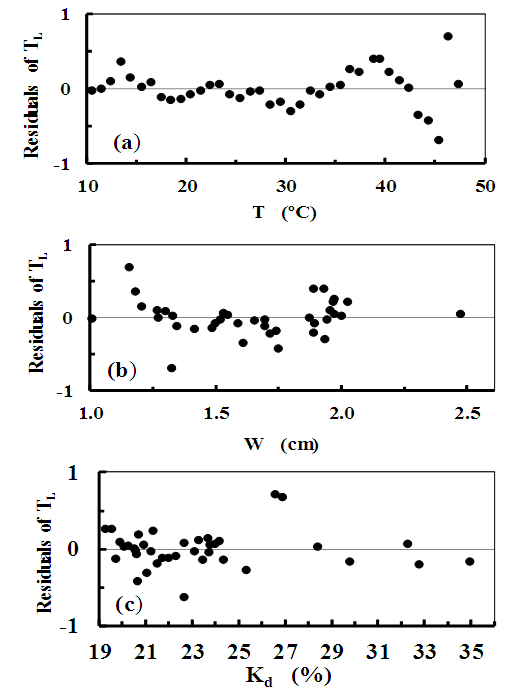
The overall correlation between TL and T, W, and Kd was 0.97 (with individual correlation coefficients between TL and T, W, and Kd of 0.92, 0.51, and -0.19 respectively). However, the value of R does not guarantee that the regression line can fit the data well [46]. A statistical analysis was applied to determine if R was statistically significant. The relation between the residuals of the averages of TL and of T, W, and Kd was calculated, and the residual plots are shown in Fig. 4. For each case, these figures show a random pattern for the values of these residuals. Accordingly, the linear relationship between the averages of TL and T, W, and Kd provides a good fit to the data used. In addition, F-statistic was equal to 178.6*** (*** refers to the significance of F at a confidence level of 99%). Therefore, the value of R is statistically significant. Hence, this effect of T on TL, which affects the content of water vapor and dust particles in the atmosphere as described in Section (3.3), explains the average diurnal variations of TL for each month, each season (hot and cold), and overall.
Figure 4. Scatter plot of residuals of TL for different values of: T, in ºC (a), W, in cm (b), and Kd ratio, (%)

3.3. Diurnal Variation of TL

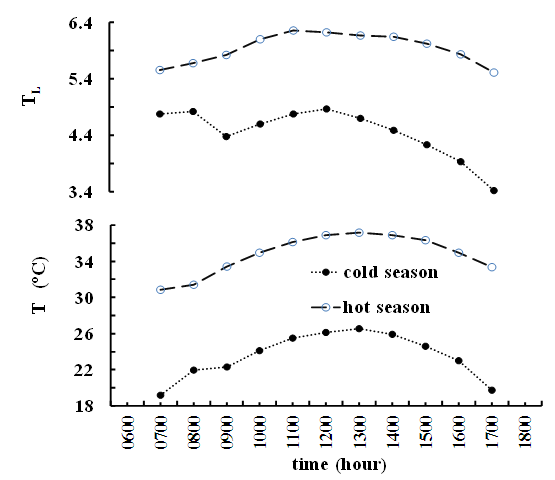
Figure 5 illustrates the diurnal variation of the monthly average hourly TL at Qena during the study period. The figure shows that, from early morning to mid-morning (7:00–9:00 LST), the months can be classified into two groups. The first group includes months that had T ≤ 22°C during these hours (I) (January, February, March, April, November, and December, constituting the cold season (Fig. 6)). The other group contains months that had T > 22°C during these hours (May to October, constituting the hot season). For the first group, as mentioned above, in the early morning (7:00 LST), condensation of water vapor and formation of mist occur, causing a reduction in direct solar radiation and resulting in high values of TL. Its average value through these months was 5.8±0.8. This average value of TL decreased to reach 4.6±0.9 at 9:00 LST. This means that, from 7:00 to 9:00, a drop of 26.1% was observed. In addition, during the cold season, this drop became 9.3%. The reduction in TL occurs because with increasing T, condensed water evaporates and mistdisappears. For the second group, the Earth’s surface temperature increases markedly, creating upward convection currents of hot air loaded with aerosols and making the atmosphere more turbid, leading to increases in TL. These results are in agreement with those obtained by El Hussainy (1986) and Kassem (1997).
Figure 5. Diurnal variation of monthly averages of hourly TL (a) and hourly T, in ºC (b) at Qena from 2001 to 2004
Figure 6. Diurnal variation of average seasonal values (cold and hot) of hourly TL and hourly T in ºC at Qena from 2001 to 2004
From late morning to afternoon (10:00–17:00 LST) for all months (as well as the hot and cold seasons, except 17:00 LST. when the average T was 19.7°C), the Earth’s surface temperature increases markedly, creating upward convection currents of hot air loaded with aerosols, making the atmosphere more turbid, and leading to increases in TL. During this part of the day, the average value of hourly TL changes with changes in T. The dependence between TL and T is very clear, and the correlation between TL and T was discussed in Section (3.2). El Shazly (1996) illustrated that TL is mainly dependent on T. Adam and El Shazly (2008) found that during daytime hours (8:00–15:00 LST) the atmosphere tends to be generally unstable, with some neutral conditions. However, under unstable atmospheric conditions, dust concentrations decrease with decreasing atmospheric instability. El-Shazly et al. (1991) showed that temperature has an important effect on atmospheric extinction at Qena (Egypt). They concluded that temperature increases aerosol mass concentration and thus atmospheric extinction. They also discovered the significant role of high temperature near the Earth’s surface, which gives rise to vertical mixing of pollutants, which raises the buoyancy of particulate matter in the atmosphere. Finally, they found that the relative humidity increases under these conditions because more aerosol particles are present to absorb water molecules.
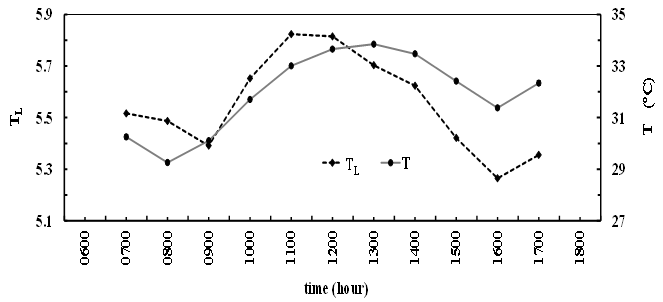
Generally, the diurnal variation of TL averaged over the whole study period reflects the variations of the average values of all data for each hour (Fig. 7). For T > 22°C, the average value of TL decreased from early morning at 7:00 LST (5.51, with SEE = 0.08) to 9:00 LST (5.39, SEE = 0.05). This result was observed because the drop in TL from 7:00 LST to 9:00 LST in the cold season was greater than the increase from 7:00 LST to 9:00 LST in the hot season (9.3% and 4.6%, respectively). Therefore, the average behavior of TL for all data for each hour tends to its behavior during the cold season (as mentioned above for the first group). Later in the morning, the average TL increases from 9:00 LST to reach the maximum value at 11:00 and 12:00 (5.82, SEE = 0.06 and 5.81, SEE =0.06, respectively). As mentioned earlier, for the second group (as well as in the hot season), when T increases and the Earth’s surface temperature rises, the atmosphere becomes more turbid, and hence TL increases. The values of T at 11:00 and 12:00 were equal to 33.00 and 33.65 respectively. Moreover, TL decreases from noon to 16:00 (5.26, SEE = 0.08) and then increases again to reach 5.35 (SEE=0.10) at 17:00. This increase is due to an increase in T (from 31.38°C at 16:00 to 33.34°C at 17:00 LST). El Shazly (1996) mentioned that diurnal patterns of atmospheric turbidity might be due to high dust content in the lower atmospheric layers arising from well-developed vertical mixing of dust particles under conditions of high temperature, especially in the afternoon hours. In addition, the diurnal variation of atmospheric turbidity at Qena showed an increase in the direction of the sunset. He explained that this behavior is logical in view of the general climatic features of the study region, which is characterized by higher temperatures in the afternoon. More details about the characteristics of aerosols at Qena can be found in studies by Mohamed et al. (1987) and El Shazly (1989). In addition, Adam (1995) and El Shazly et al. (1997) illustrated the effect of aerosols on broadband solar radiation.
Figure 7. Diurnal variation of hourly averages of TL and T in ºC at Qena from 2001 to 2004
Finally, the above discussion makes it clear that the variation in TL at Qena, Egypt is depends mainly on variations in air temperature (T). Moreover, El Shazly (1996) supported this conclusion. He found that the seasonal variation of TL at Qena, Egypt depends mainly on variations in air temperature. In addition, he showed that his findings were in agreement with those of other studies that illustrated approximately the same seasonal behavior as at Qena under different climates and locations, such as Dhahran, Saudi Arabia [47], Tunisia [48], Cairo, Egypt [49], Danube Delta coastal area [50] and Avignon, France [51, 52].

4. Conclusions

Measured hourly values of broadband measurements of direct normal irradiance (In) under cloudless conditions have been used to estimate the Linke turbidity factor (TL) from 2001 to 2004. The correlation between T and other atmospheric conditions that affect the content of water vapor and dust particles in the atmosphere (such as W and Kd) was illustrated, and accordingly the correlation between T and TL was analyzed. The average diurnal variation of hourly TL for each month and each season (hot and cold) was explained, as well as the diurnal variations of hourly TL over the whole period. The overall findings of this study can be briefly summarized as follows:
1. Hourly values of TL varied from ≈ 2 to 11.8. The maximum value of TL at Qena is less than the maximum for Cairo (11.87), gut higher than the maximum for Aswan (10.8). According to Leckner (1978), 0.98%, 10.31%, and 80.62% of the daytime hours (7:00 to 17:00 LST) during the study period were characterized by (clear, warm air), (turbid, moist, warm air), and (polluted atmosphere) respectively.
2. Authors and affiliations At low temperatures (10 ≤ T ≤ 22°C), the average of TL decreases with increasing T, but at high temperatures (T > 22°C), the average increases with increasing T. For both cases, a quadratic equation can be fitted to represent the dependence of average TL on T. The coefficients of determination of the fitted lines were 0.33 and 0.98 respectively.
3. The simultaneous effect of T, W, and Kd on TL had a multiple correlation, R, equal to 0.97 (the individual correlation coefficients between TL and T, W, and Kd were 0.92, 0.51, and -0.19 respectively). The value of R was statistically significant (F-statistic equal to 178.6*** at a confidence level of 99%).

ACKNOWLEDGEMENTS

The author would like to thank the Program Research Center at Arabic Linguistics Institute, Deanship of Scientific Research, Vice Rectorate for Graduate Studies and Scientific Research, King Saud University, Riyadh, Kingdom of Saudi Arabia, for funding and supporting this research.

References

[1]  Lopez G, Batlles FJ, 2004. Estimate of the atmospheric turbidity from three broad-band solar radiation algorithms, a comparative study. Annales Geophysicae 22(8): 2657–2668.
[2]  Zakey AS, Abdelwahab MM, Maka PA, 2004. Atmospheric turbidity over Egypt. Atmospheric Environment 38: 1579–1591.
[3]  El Shazly SM, 1996. A study of Linke turbidity factor over Qena, Egypt. Advances in Atmospheric Sciences 13, 519–532.
[4]  Kasten F, 1980. A simple parameterization of the pyrheliometric formula for determining the Linke turbidity factor. Meteor. Rundsch. 33, 124–127.
[5]  El-Wakil M, El-Metwally M, Gueymard C, 2001. Atmospheric turbidity of urban and desert areas of the Nile Basin in the aftermath of Mt. Pinatubo’s eruption. Theor. Appl. Climatol. 68, 89–108.
[6]  Dogniaux R, 1975. Variations géographiques et climatiques des expositions énergétiques solaires sur des surfaces acceptrices horizontales et verticales. Rep. B38, IRM, Brussels.
[7]  Grenier JC, de la Casinière A, and Cabot T, 1994: A spectral model of Linke’s turbidity factor and its experimental implications. Sol. Energy, 52, 303–314.
[8]  Jacovides CP, Varotsos C, Kaltsounides NA, Petrakis M, Lalas DP, 1994. Atmospheric turbidity parameters in the highly polluted site of the Athens basin. Renew. Energy 4: 465–470.
[9]  Djafe D, 2013. Estimation of the Ångström coefficient over Ghardaïa city. Revue des Energies Renouvelables 16, 741–748.
[10]  Adam ME-N, 2013a. Sensitivity analysis of aerosols’ effect in UVB transmission to solar zenith angle at subtropical location (Qena, Egypt). Atmospheric Environment 71, 311–318.
[11]  Adam ME-N, 2014. Atmospheric modulations of the ratio of UVB to broadband solar radiation: effect of ozone, water vapor, and aerosols at Qena, Egypt. Int. J. Climatol. 34, 2477–2488.
[12]  Cucumo M, Marinelli V, Oliveta G, 1999. Experimental data of the Linke turbidity factor and estimate of Ångström turbidity coefficient for two Italian localities. Renew. Energy 17, 397–410.
[13]  El Hussainy FM, Omran MA, 1998. Analysis and trends of atmospheric turbidity parameters over Cairo. Meteorol. Atmos. Phys. 66: 113–121.
[14]  Al-Jamal KS, Ayyash M, Rasas S, Al-Aruri SN, 1987. Atmospheric turbidity in Kuwait. Atmos. Environ. 21: 1855–1859.
[15]  Louche A, Maurel M, Simonnot O, Peri G, Iqbal M, 1987. Determination of Ångström’s turbidity coefficient from direct solar irradiance measurements. Solar Energy 38, 89–96.
[16]  Gueymard C, 1994. Analysis of monthly average atmospheric precipitable water and turbidity in Canada and the northern United States. Solar Energy 53: 57–71.
[17]  Chaâbane M, Masmoudi M, Medhioub K, 2004. Determination of Linke turbidity factor from solar radiation measurement in northern Tunisia. Renewable Energy, 29(13): 2065–2076.
[18]  Trabelsi A, Masmoudi M, 2011. An investigation of atmospheric turbidity over Kerkennah Island in Tunisia. Atmos. Res. 101, 22–30.
[19]  Adam ME-N, 1995. Studies of Solar Radiation Components Related to Aerosols in the Atmosphere at Qena, Upper Egypt. MSc thesis, South Valley University, Qena, Egypt.
[20]  Ahmed ZM, 2008. Empirical models for calculating some solar radiation components at Qena, Upper Egypt using sunshine period measurements. MSc Thesis, South Valley University, Qena, Egypt.
[21]  Rahoma UA, Hassan AH, 2010. Estimate of aerosol optical depth using broadband direct normal observations at the highest polluted area in the world. Am. J. Applied Sci. 7: 647–655. doi:10.3844/ajassp.2010.647.655.
[22]  Linke F, 1922. Transmissions: Koeffizient und Trübungsfaktor. Beiträge zur Physik der Atmosphäre 10, 91–103.
[23]  Mavromatakis F, Franghiadakis Y, 2007. Direct and indirect determination of the Linke turbidity coefficient. Solar Energy 81, 896–903.
[24]  Kasten F, 1988: Elimination of the virtual diurnal variation of the Linke turbidity factor. Meteor. Rundsch. 41, 93–94.
[25]  WMO (World Meteorological Organization), 1990. Guide to Meteorological Observation Methods. Tn-8, Geneva, Switzerland, Chapter 9. WMO Secretariat, 925–932.
[26]  WMO (World Meteorological Organization), 2006. Guide to Meteorological Instruments and Methods of Observation. WMO No. 8, 158–167.
[27]  WRC (World Radiation Centre), 1985. Sixth International Pyrheliometer Comparison (IPC VI), 1–18 October, Working Report No. 137, Davos, Switzerland.
[28]  WRC (World Radiation Centre), 1995. International Pyrheliometer Comparison (IPC VII), 25 September–13 October, Working Report No. 188, Davos, Switzerland.
[29]  Adam ME-N, 2011a. Effect of the atmosphere on UVB radiation reaching the Earth’s surface: Dependence on solar zenith angle. Atmos. and Ocean. Sci. Let. 4: 139–145.
[30]  Adam ME-N, 2011b. Effect of macrophysical parameters of clouds on broadband solar radiation (295–2800 nm) at a subtropical location. Atmos. and Ocean. Sci. Let. 4: 180–185.
[31]  Adam ME-N, 2013b. Suspended particulates concentration (PM10) under unstable atmospheric conditions over a subtropical urban area (Qena, Egypt). Advances in Meteorology Vol. 2013, Article ID 457181, 10 pages, http://dx.doi.org/10.1155/2013/457181.
[32]  Adam ME-N, 2015. Determination of daily total ultraviolet-B in a subtropical region (Upper Egypt): an empirical approach. Atmos. Res. 153: 1–9.
[33]  Adam, ME-N, Emad A, Ahmed EA, 2016a. Comparative analysis of cloud effects on ultraviolet-B and broadband solar radiation: Dependence on cloud amount and solar zenith angle. Atmos. Res. 168: 149–157.
[34]  Adam ME-N, Emad A, Ahmed EA, 2016b. An assessment of the ratio of ultraviolet-B to broadband solar radiation under all cloud conditions at a subtropical location. Advances in Space Research 57, February 1, 2016, 764–775.
[35]  Adam ME-N, El Shazly M, 2007. Attenuation of UVB radiation in the atmosphere: cloud effects at Qena (Egypt). Atmos. Environ. 41: 4856–4864.
[36]  Adam ME-N, El Shazly MS, 2008. Diurnal variation of atmospheric stability at Qena (Upper Egypt). Mausam (J. India Meteorol. Serv.) 59, 69–76.
[37]  Adam ME-N, Kassem KhO, Ahmed EA, 2013. Statistical relationship between UVB (280–320 nm) and broadband solar radiation (295–2800 nm) at a subtropical location (Qena, Egypt). Atmos. Ocean. Sci. Lett. 6: 173–178.
[38]  Kassem KO, 1997. Studies on Atmospheric Turbidity Including the Effect of Some Weather Parameters. MSc Thesis, Faculty of Science at Qena, South Valley University, 212 pp.
[39]  Espinosa AJF, Rodriguez MT, Alvarez FF, 2004. Source characterization of fine urban particles by multivariate analysis of trace metal speciation. Atmos. Environ. 38: 873–886.
[40]  Chung CE, Ramanathan V, Kim D, Podgorny IA, 2005. Global anthropogenic aerosol direct forcing derived from satellite and ground-based observations. J. Geophys. Res. 110: D24207, doi: 10.1029/2005JD006356.
[41]  Karar K, Gupta AK, Kumar A, Biswas AK, Devotta S, 2005. Statistical interpretation of week day/week end differences of ambient gaseous pollutant, vehicular traffic and meteorological parameter in urban region of Kolkatta. J. Environ. Sci. Eng. 47, 164–175.
[42]  Bhaskar BV, Vikram M, Mehta VM, 2010. Atmospheric particulate pollutants and their relationship with meteorology in Ahmedabad. Aerosol and Air Quality Research 10, 301–315. doi: 10.4209/aaqr.2009.10.0069.
[43]  Stull RB, 2000. Meteorology for Scientists and Engineers. Brooks/Cole.
[44]  Rizk HFS, Fareg SA, Ateia AA, El-Bialy A, 1985. Effect of pollutant aerosols on spectral atmospheric transmissivity in Cairo. Environ. Int. 11, 487–492.
[45]  Rizk HFS, Soliman SH, El-Bialy A, Ateia AA, 1986. Aerosol optical thickness in Cairo atmosphere. J. Inst. Eng. 66: 45–51.
[46]  Willmott CJ, 1981. On the validation of models. Physical Geography 2: 184–194.
[47]  Abdelrahman MA, Said SAM, Shuaib AN, 1988. Comparison between atmospheric turbidity coefficients of desert and temperate climates. Solar Energy 40: 219-225.
[48]  Mohamed Saad, Amel Trabelsi, Mohamed Masmoudi, Stephane C. Alfaro, 2016. Spatial and temporal variability of the atmospheric turbidity in Tunisia, Journal of Atmospheric and Solar-Terrestrial Physics, Volume 149, Pages 93-99.
[49]  El Hussainy FM, 1989. A study of atmospheric turbidity parameters over Cairo. ASRE, Cairo, Egypt, March 19–22, 1(6): 53–63.
[50]  Sorin Constantin, Ștefan Constantinescu, David Doxaran, 2017. Long-term analysis of turbidity patterns in Danube Delta coastal area based on MODIS satellite data: Journal of Marine Systems, Volume 170, June 2017: 10-21.
[51]  Katz M, Baille A, Mermier M, 1982a. Atmospheric turbidity in a semi-rural site, I: Evaluation and comparison of different atmospheric turbidity coefficients. Solar Energy 28: 323–328.
[52]  Katz M, Baille A, Mermier M, 1982b. Atmospheric turbidity in a semi-rural site, II: Influence of climatic parameters. Solar Energy 28: 329–339.
[53]  Adam ME-N, 2003. A SODAR-Based Investigation of the Atmospheric Boundary Layer. PhD Thesis, Meteor. Inst. Univ. Freiburg, Germany, No. 8, 259 pp.
[54]  El Shazly SM, 1989. Studies of the size distribution of the suspended dust particles in the atmosphere of Qena, Egypt. Mausam (J. India Meteorol. Serv.) 40, 447–450.
[55]  El Shazly SM, 1997. A study of atmospheric transparency over Qena, Upper Egypt. Water, Air, and Soil Poll. 94, 259–273.
[56]  El Shazly SM, Abdelmageed AM, Hassen GY, Nobi B, 1991. Atmospheric extinction related to aerosol mass concentration and meteorological conditions in the atmosphere of Qena, Egypt. Mausam (J. India Meteorol. Serv.) 42, 376–374.
[57]  El Shazly SM, Abdelmageed AM, Adam ME-N, 1997. Solar radiation characteristics at Qena, Egypt. Időjárás: Quart J. Hungarian Meteorol. Service 101, 215–231.
[58]  El Hussainy FM. 1986. A Study of Some Aspects of Solar Radiation over Egypt. PhD thesis, Cairo University, Cairo, Egypt.
[59]  Guechi A, Chegaar M, Merabet A, 2011. Effect of spectral irradiance distribution on the performance of solar cells. Proceedings of the E-MRS Fall Meeting and Symposium, September 19–23, Warsaw, Poland.
[60]  Kasten F, 1966. A new table and approximate formula for relative optical air mass. Arch. Met. Geoph. Biokl. B14:206–223.
[61]  Leckner B, 1978. The spectral distribution of solar radiation at the Earth’s surface—Elements of a model. Solar Energy 20, 143–150.
[62]  Malik AQ, 2000. A modified method of estimating Ångström’s turbidity coefficient of solar radiation models. Renewable Energy 21(3): 537–552.
[63]  Mohamed A, Abdel Kerim FM, Bassily AB, Armia E, Nassary M, 1987. Heavy metal determination in the atmosphere of Qena using spectroscopic technique. Bull. Fac. Sci., Qena, Egypt.
[64]  Rahoma UA, Hassan AH, 2012. Determination of atmospheric turbidity and its correlation with climatological parameters. Am. J. Environ. Sci. 8: 597–604.