World Environment

p-ISSN: 2163-1573    e-ISSN: 2163-1581

2016;  6(3): 84-92

doi:10.5923/j.env.20160603.03


Variations in Surface Ozone and NOx at Qena a Subtropical Site in Upper Egypt

Abdel Galeil A. Hassan

Physics Department, Faculty of Science, South Valley University, Qena, Egypt

Correspondence to: Abdel Galeil A. Hassan , Physics Department, Faculty of Science, South Valley University, Qena, Egypt.

Email:

Copyright © 2016 Scientific & Academic Publishing. All Rights Reserved.

This work is licensed under the Creative Commons Attribution International License (CC BY).
http://creativecommons.org/licenses/by/4.0/

Abstract

Measurements of surface ozone (O3), NOx (NO + NO2) and meteorological Parameters have been made in South Valley University campus, Qena, Upper Egypt (26.20° N, 32.75° E), from January 2014 to December 2015. The main objective of this study is to investigate the diurnal, monthly and seasonal variations of O3 and nitrogen oxides (NOx). The meteorological factors impacts on O3 and NOx levels have been under taken. The measurements of O3 and NOx showed distinct diurnal and seasonal variability at this site. The hourly average pattern of O3 over the study period showed a maximum value (49.9±5.6) ppbv in the afternoon (12.00 h LST) and minimum one (22.2±8.47) ppbv during early morning (6.00 h). In addition, for NOx, the maximum concentration (8.96±3.3) ppbv was observed during night time and minimum (3.44±0.5) ppbv during daytime. The variability of O3 and NOx, during day time, reflect the photolysis of nitrogen dioxide. This study also indicates the maximum value of O3 was recorded in hot months (Apr.-Sept.) and minimum during cold months (Oct. – Mar.). A negative correlation coefficient of - 0.47 for the relationship between O3 and NOx reveals the role of NO2 photolysis that generates O3 at this site. The correlation between O3 and meteorological parameters indicate that the ambient air temperature solar radiation and wind speed have positives correlation (0.62, 0. 51 and 0.22), respectively. On the other hand, the relative humidity has a negative effect on ozone level with a correlation coefficient equals -0.53. The relationship between NOx and meteorological parameters have negative correlations (-0.30, -0.25 and -0.41) with temperature, solar radiation and wind speed, respectively and positive relation (0.34 with relative humidity).

Keywords: Surface ozone, Nitrogen oxides, Meteorological factors, Semi-urban area

Cite this paper: Abdel Galeil A. Hassan , Variations in Surface Ozone and NOx at Qena a Subtropical Site in Upper Egypt, World Environment, Vol. 6 No. 3, 2016, pp. 84-92. doi: 10.5923/j.env.20160603.03.

1. Introduction

Surface ozone (O3) is a secondary pollutants and is formed through a series of photochemical reactions in the presence of volatile Organic compounds (VOCs) and nitrogen oxides (NOx) under intense solar radiation [1]. O3 is produced by the reaction of oxygen molecule (O2) with an oxygen atom, which originates from the photolysis of nitrogen dioxide (NO2) by solar radiation. O3 is destroyed by reacting with NO to form NO2 and O2. O3 is capable of causing damage to human health via respiratory disease [2-6]. High concentrations of surface ozone also affect vegetation and forests [7].
The main sources of NOx is complete combustion of fossil fuel particularly from vehicle emissions [8, 9]. VOCs are emitted directly into the atmosphere from vegetation and a variety of natural and anthropogenic sources [10]. Non-methane hydrocarbons are the main group of atmospheric VOCs and a precursor to O3 production via hydroxyl (OH) radical-initiated oxidation, and subsequent reactions with NOx [11-14]. O3 levels in the atmosphere have been widely studied for many locations in the world [15-30]. On the other hand, very few studies have been conducted in Qena particularly outside the city campus. Most of the previous studies have been conducted inside an urban area or in rural area and most of them reported that there is a obvious relationship between O3 level and its precursors (NOx, VOCs). In addition, most of the previous studies, related to ozone, reported that the ozone concentrations during the daytime were found to be significantly different from those of night time. During daytime hours, higher concentrations of ozone were recorded than during the night time. The concentrations would build up rapidly from the early hours of the day, to peak around noon, and then drop to a low in the evening. [27-30]. An analysis of the influences of meteorological parameters on O3 and its precursors can contribute to a better understanding of the local and regional causes of O3 pollution [31]. The seasonal and diurnal variations of surface O3 and its precursors and the related meteorology have been extensively studied around the world [32, 33]. These studies showed that O3 chemistry and the effects of meteorological conditions could vary depending on the characteristics of the climate and air pollutants emissions in the place of interest. The main objective of this study is to investigate the diurnal, monthly and seasonal variations of O3 and nitrogen oxides (NOx). The metrological factors impacts on O3 and NOx levels have been under taken.

2. The Location of the Sampling Site

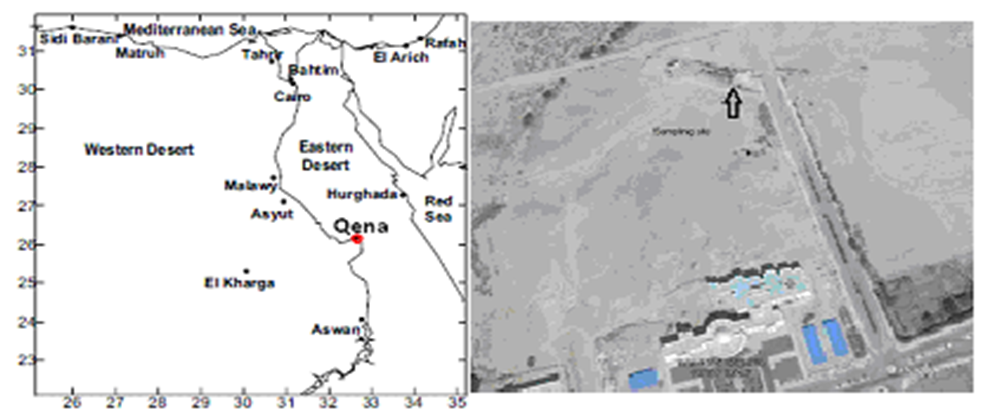
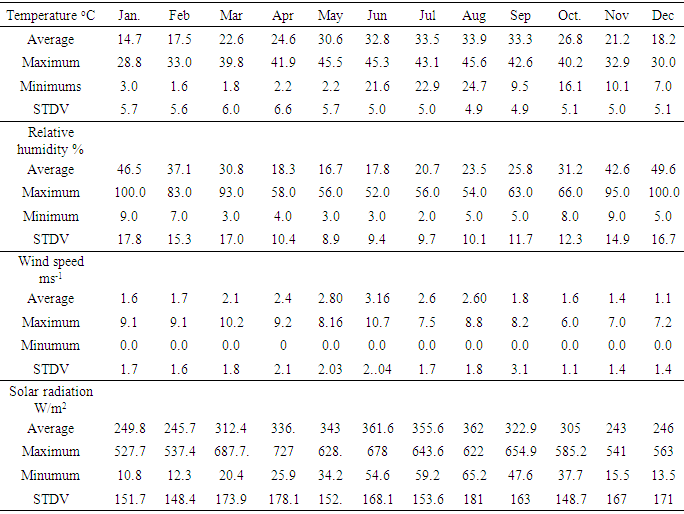
The location of the sampling site at South Valley University (SVU) metrological research station (26°17' N, 32°43' E, 97 m asl) is shown in Fig. 1. South Valley University is located about 6 K northeast of Qena city in eastern desert. Also, the station is located about 0.5 km from the University Campus and 1 km from red sea road (Qena – El Hurghada high way). In general, the site lie within the subtropical region and its terrain is semi-desert where a little establishment and vegetation are found around the site The location is characterized with no major industrial activities The climate of Qena city is characterized by cold winter, and very hot but non-humid in summer, a hot season from March to October and a cold season from November to February. During summer time, temperatures could reach 46°C, while winter temperatures drop to sub-zero levels. Table 1 shows the monthly mean variations of meteorological parameters like wind speed, temperature, and relative humidity at present location during the period of observations. The wind speed was high during the period from April to Aug. and low from Nov. to Jan. The maximum average wind speed ranged from 2.4 to 3. 16 m/s.
Figure (1). The location of the sampling site
Table (1). Monthly mean variations of meteorological parameters during the period of study at Qena
     

3. Results and Discussion

3.1. Diurnal Variation of O3 and NOx

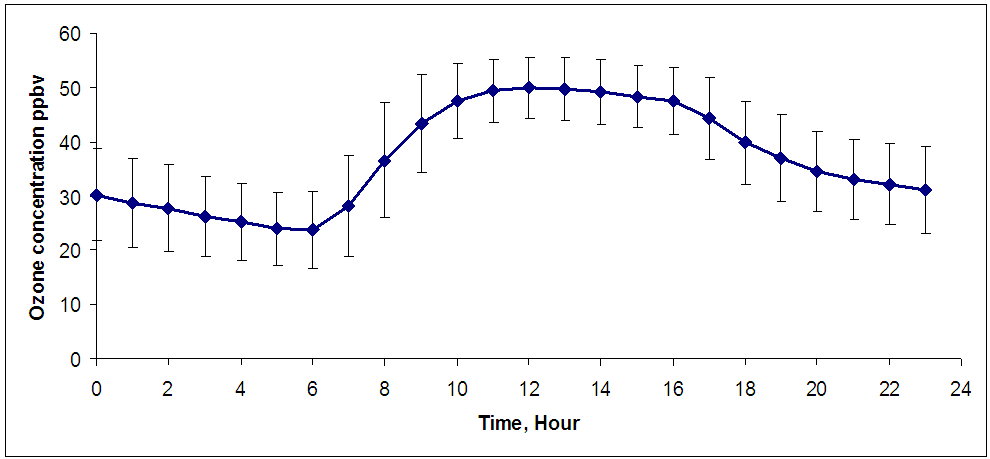
The hourly average of O3 variations within day over a period from January 2014 to December 2015 are graphically in Fig. 2. The vertical bars represent the standard deviation. The figure shows highest levels of O3 concentration during the daytime and lowest levels in the nighttime. The maximum surface O3 (49.9±5.6) ppbv was observed in the late afternoon (12.00 h LST, local standard time) and minimum one (22.2±8.47) ppbv was observed during early morning (6.00 h). The daytime increase in O3 concentration is mainly from the photoxidation of carbon monoxide, hydrocarbons, and methane in the presence of sufficient amount of NOx. In the our location, the main sources of carbon monoxide and hydrocarbons are motor vehicle exhaust and some man activities in the university. Also, it is clear that with the start of sunshine, O3 concentration gradually increases and it reaches a maximum value at noon time (12.00 h). O3 may be produced according the following reaction:
(1)
Figure (2). Daily average diurnal variations of O3 from January 2014 to December 2015
The present data shows that the O3 concentrations started to decline after 1700 h in the evening on all days. The low concentration of O3 observed during nighttime is, may be, due to the absence of photolysis of NO2 and loss of O3 by NO, may be through the following titration reaction.
(2)
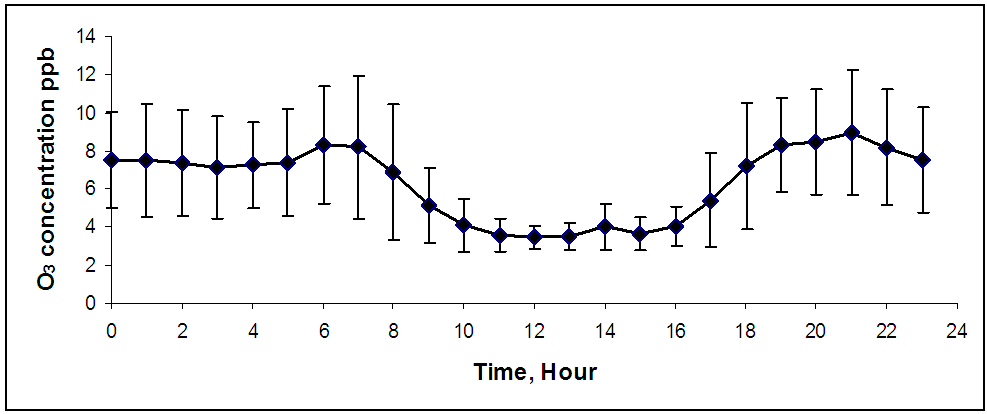
Figure 3 shows the hourly average of NOx variations during the period of study. Nitrogen oxides can be caused by photochemical, transport and emission processes whose strength varies between day and night. It was found that NOx concentration was higher during nighttime (21.00 h) and lower during daytime (13.00 h). During night, the boundary layer descends and remains low till early morning; hence, in the absence of solar radiation, NOx gets trapped in the shallow surface layer and become at high levels.
Figure (3). Daily average diurnal variations of NOx from January 2014 to December 2015
At this location, the maximum and minimum average concentration of NOx are found to be about 8.96±3.3 ppbv and 3.44±0.5, respectively. These concentrations are relatively small compared to that of other sites in Egypt such as Cairo and Alexanderia [23, 27].
The present results show similar behavior of both surface ozone and oxide of nitrogen with other studies, that have been proposed in other urban and rural locations. Also, it is clear that the NOx concentration is mirror image of O3 concentration during the sunshine duration. Fig. 2 and Fig. 3 are indicating that an increase in O3 level is associated with a drop in the concentrations of NOx [17, 24, 26, 27, 30, 36, 37, 38].
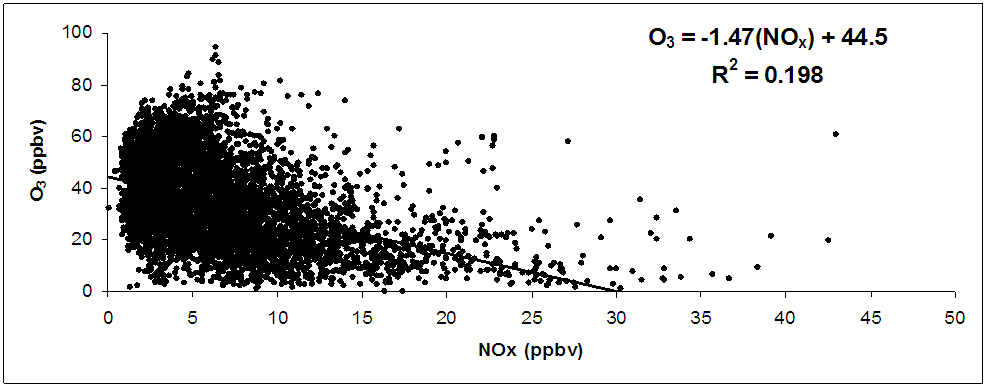
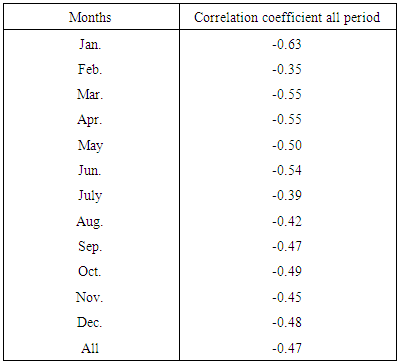
In order to better understand the relationship between surface O3 with NOx, relationships were examined. The Scatter diagram of hourly O3 and NOx is shown in Fig. 4. Significant negative correlations were found between NOx and O3 as shown in Table 2 and Fig. 4. The present result shows that the correlation coefficients between NOx and O3 varying from -0.35 to - 0.63 with average values equals -0.47. In urban stations in Istanbul, Topeu and Incecik [39, 40] (2002, 2003) are stated that the correlation coefficients varying from −0.54 to −0.84 for summer months in the years of 1998 and 1999. A similar relationship between NOx and O3 in Istanbul between 2001 and 2005 have been found by Im et al [41] (2008).
Figure (4). Scatter diagram of hourly O3 and NOx concentrations
Table (2). Correlation coefficient between NOx and O3
     

3.2. Monthly and seasonal of O3 and NOx

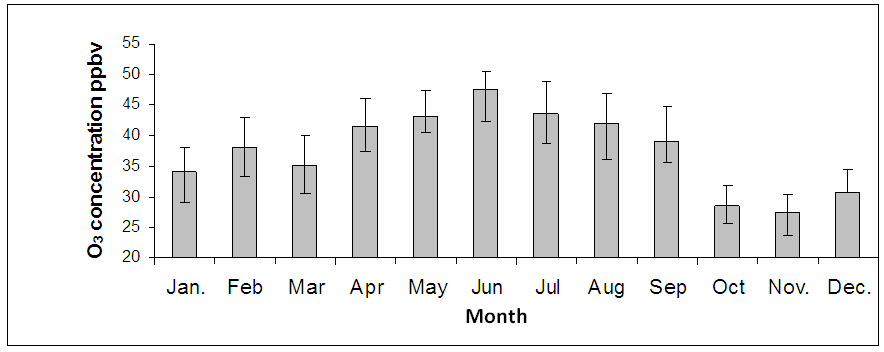
The monthly mean O3 concentrations at Qena, averaged over each month in the 2014–2015 periods are shown in Fig. 5. The highest value of concentration was found in hot months (Apr.-Sep) while the minimum one was found in cold months (Oct- Mar). The highest level of averaged O3 (47.6 ppbv) was observed in Jun. and the lowest one was found in Nov. (27.4 ppbv).
Figure (5). Monthly variations of O3 at Qena city during the period (2014-2015)
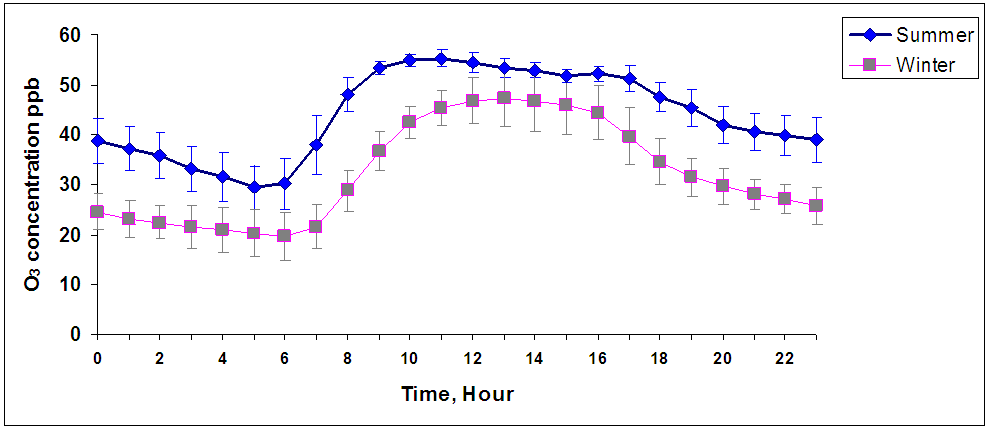
In this study, the diurnal variations of O3 observed at Qena are highly influenced by the seasonal changes that depend on the site characteristics and emissions. At this site O3 levels tend to follow the solar radiation intensity, resulting in higher O3 concentration during the daylight period (9.00 - 17.00 h) in summer days and during period (11.00-16.00 h) in winter days (see Fig. 6). The diurnal pattern of O3 for each season is characterized by minimum concentration during early morning hours (4.00-6.00 h). At the present location, the maximum average value of O3 (55.28 ppbv) during summer season was observed at 11.00 h while the minimum one (29.42 ppbv) was observed at morning (6.00 h). On other hand, during winter season, the maximum average of O3 was 47.3 ppbv and it is recorded at 13.00 h while, the minimum one was 19.63 ppbv (recorded at 6.00 h).
Figure (6). Diurnal variation of O3 in Qena city during summer and winter of the period 2014-2015
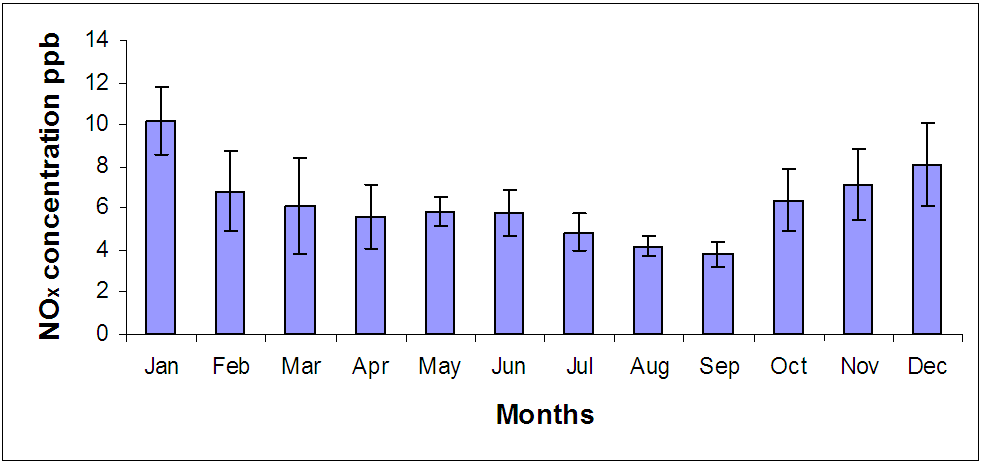
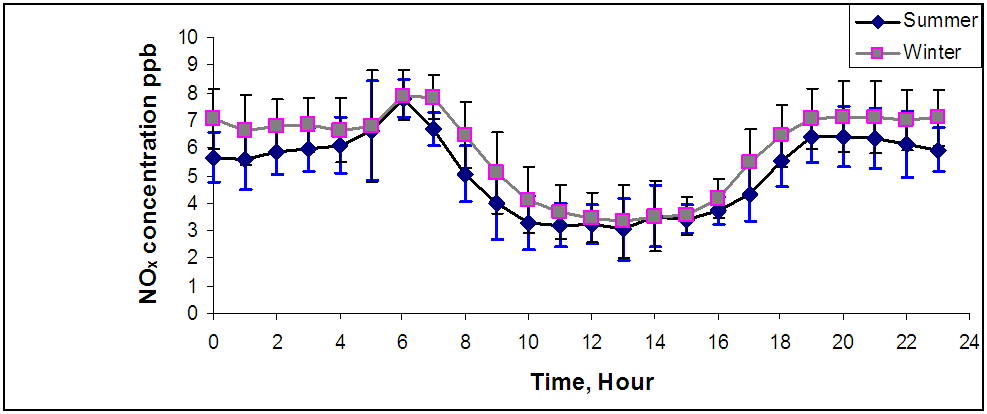
Fig. 7 represents the monthly mean NOx concentration at Qena, averaged over each month in the 2014–2015 periods. It is clear that the highest value of nitrogen oxide was found in cold months and the minimum one in hot months. The results show that the highest averaged value of NOx (10.17 ppb) was observed in January and the lowest one (3.8 ppbv) was in Sept. NOx level shows almost opposite diurnal variation pattern compared to O3, characterized by high concentrations during morning and afternoon and low concentration during noon. With increasing solar intensity, the photolysis rate of NO2 increases, leading to decreased NO2 and increased O3 As seen in Fig. 8, the highest values of NOx were monitored in early morning (6.00-8.00 h) and afternoon (17.00 - 23.00 h). The highest values in early morning and afternoon are attributed to increasing the human activities and traffic flow with very low solar radiation intensities.
Figure (7). Monthly variations of NOx at Qena city during the period (2014-2015)
Figure (8). Diurnal variation of NOx in Qena city during summer and winter of the period 2014-2015

3.3. Ozone and NOx Variations with Meteorological Parameters

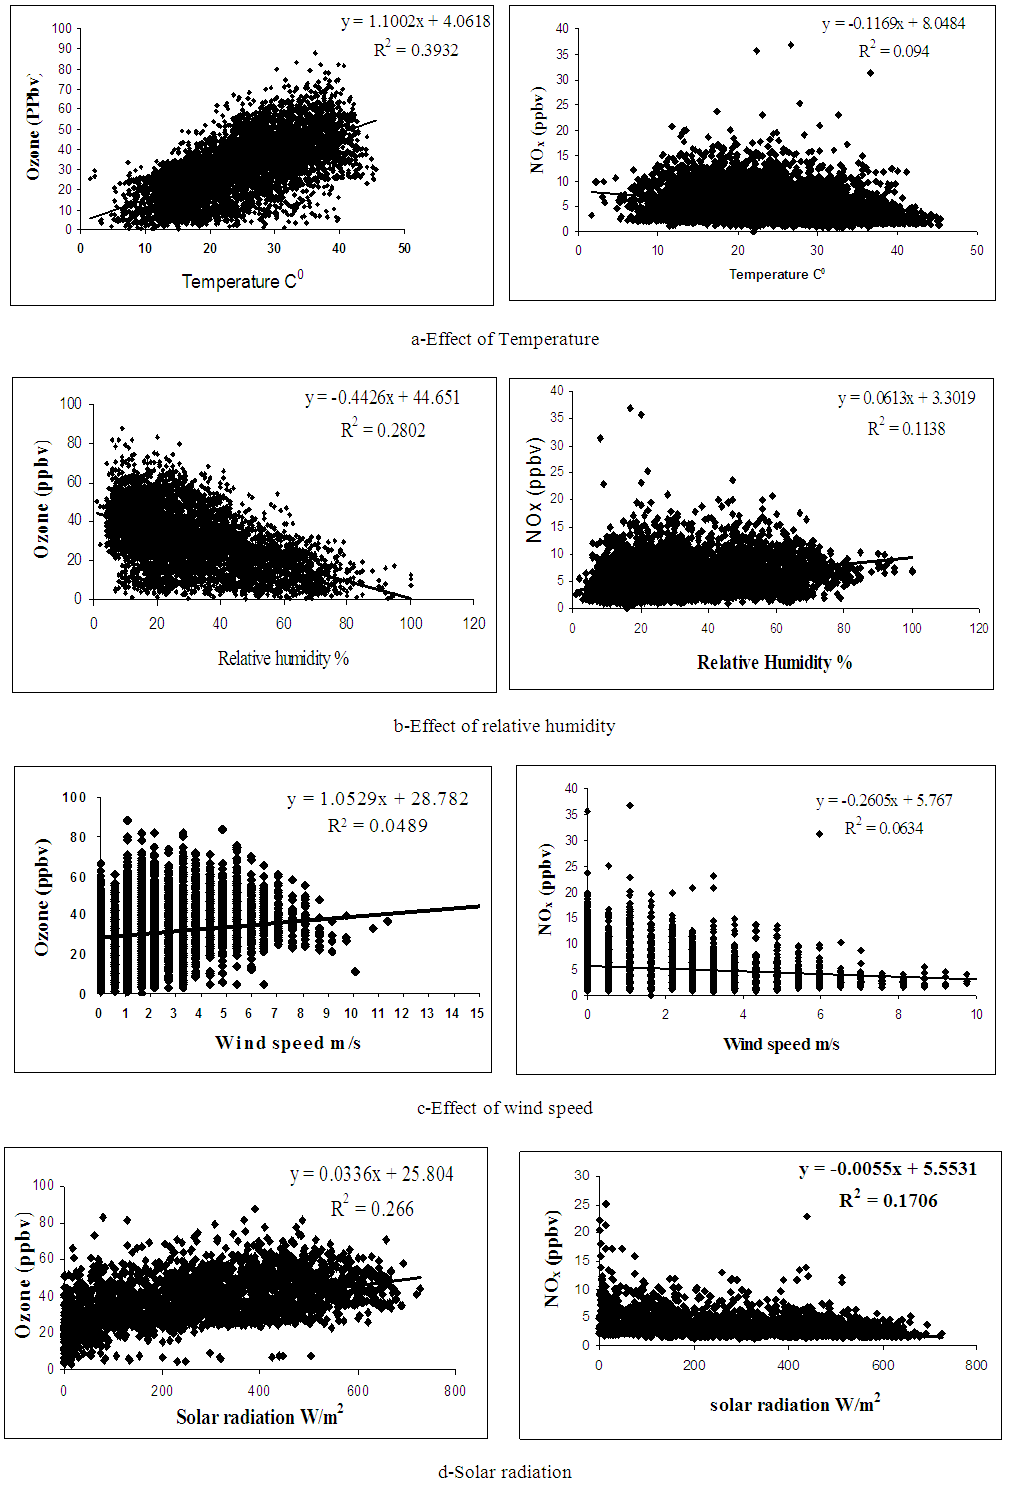
The pollutants variability is influenced by the changes in meteorological parameters such as temperature, humidity, wind speed and solar radiation. A detailed account of variations of O3 with and meteorological parameters is described in present section. Figure (9) and Table (3) show the correlation coefficients between hourly averaged O3 concentration, NOx and meteorological parameters. It was found a positive relationship between the ambient temperature, solar radiation and wind speed with O3 concentration where the correlations coefficient (r) are 0.62 0.22 and 0.51, respectively. The increasing ambient temperature is associated with increasing solar radiation intensity, particularly during day light hours. We can say that the photochemical formation of ozone in air at a location is influenced by ambient temperature, solar radiation, and NOx concentration. On other hand, relative humidity has a negative effect on O3 concentrations where the correlation coefficient (r) is -0.53. The effect of relative humidity can be explained as follow: an increase in humidity reduces the amount of solar radiation reaching the earth’s surface, thus led to reduce the photochemical formation of ozone.
Figure (9). Relations of both O3 and NOx vs a- Air temperature, b-Relative humidity, c-Wind speed and d-Solar radiation
Table (3). Correlation coefficients between hourly averaged O3 concentration, NOx and meteorological parameters (temperature, relative humidity, wind speed and solar radiation)
     
As we mentioned before, in Fig. 2 and Fig. 3, the O3 concentrations are increasing with a drop in the concentrations of NOx. The correlation coefficient between NOx and meteorological parameters confirm this relation where NOx concentrations have a negative correlations (-0.30, -0.25 and -0.41) with temperature, solar radiation and wind speed, respectively and positive relation (0.34) with relative humidity.

4. Conclusions

In this study, the variations of both surface ozone O3 and oxide of nitrogen NOx are investigated in site lie within the subtropical region with terrain is semi-desert where a little vegetation is found around the site. The location is characterized with no major industrial activities. The site lie within South valley university campus, Qena, Upper, Egypt. The investigation involves: diurnal, monthly, seasonal variations and the effect of metrological parameters on both O3 and NOx. The investigation showed the following:
• The highest levels of O3 concentration (49.9±5.6 ppbv) were during the daytime (12.00 h LST) and lowest levels (22.2±8.47ppbv) early morning (6.00 h).
• NOx concentration was higher (8.96±3.3 ppbv) during nighttime (21.00 h) and lower (3.44±0.5 ppbv) during daytime. (13.00 h)
• The study shows that the NOx concentration is mirror image of O3 concentration, particularly particularly during the sunshine duration.
• The monthly variation shows that the highest value of O3 concentration was found in hot months (Apr.-Sep) while the minimum one was found in cold months (Oct- Mar).
• Also, the monthly variation of NOx, shows the highest value of nitrogen oxide in cold months and the minimum one in hot months.
• A positive relationship between the ambient temperature, solar radiation and wind speed with O3 concentration where the correlations coefficient (r) are 0.62, 0.22 and 0.51, respectively. On other hand, relative humidity has a negative effect on O3 concentrations where the correlation coefficient (r) is -0.53.
• A negative relationship between the ambient temperature, solar radiation and wind speed with NOx concentration where the correlations coefficient (r) are -0.30, -0.25 and -0.41, respectively.
• The variability of O3 and NOx, during day time, reflect the photolysis of nitrogen dioxide.

References

[1]  Abdul-Wahab, S. A., Bakheit, C. S., & Al-Alawi, S. M. (2005). Principal component and multiple regression analysis in modeling of ground-level ozone and factors affecting its concentrations. Environmental Modelling and Software, 20, 1263–1271.
[2]  Ho, W.C., Hartley, W.R., Myers, L., Lin, M.H., Lin, Y.S., Lien, C.H. and Lin, R.S. (2007). Air Pollution, Weather, and Associated Risk Factors Related to Asthma Prevalence and Attack Rate. Environ. Res. 104: 402–409.
[3]  Karakatsani, A., Kapitsimadis, F., Pipikou, M., Chalbot, M.C., Kavouras, I.G., Orphanidou, S. D., Papiris, S. and Katsouyanni, K. (2010). Ambient Air Pollution and Respiratory Health in Mail Carriers. Environ. Res. 110: 278–285.
[4]  Neidell, M. and Kinney, P.L. (2010). Estimates of the Association between Ozone and Asthma Hospitalizations that Account for Behavioral Responses to Air Quality Information. Environ. Sci. Policy 13: 97–103.
[5]  Mills, G., Hayes, F., Simpson, D., Emberson, L., Norris, D. Harmens, H. and Buker, P. (2011). Evidence of Widespread Effects of Ozone on Crops and (Semi-) Natural Vegetation in Europe (1990-2006) in Relation to AOT40-and Flux-Based Risk Maps. Global Change Biol.17: 592–613.
[6]  Huang, H.L., Lee, M.G. and Tai, J.H. (2012). Controlling Indoor Bioaerosols Using a Hybrid System of Ozone and Catalysts. Aerosol Air Qual. Res. 12: 73–82.
[7]  Fuhrer, J., Skarby, L. and Ashmore, M.R. (1997). Critical Levels for Ozone Effects on Vegetation in Europe. Environ. Pollut. 97: 91–106.
[8]  Song, F., Shin, J.Y., Atresino, R.J. and Gao, Y. (2011). Relationships among the Springtime Ground-Level NOx, O3 and NO2 in the Vicinity of Highways in the US East Coast. Atmos. Pollut. Res. 2: 374–383.
[9]  Chelani, A.B. (2012). Study of Extreme CO, NO2 and O3 Concentrations at Traffic Site in Delhi: Statistical Persistence Analysis and Source Identification. Aerosol Air Qual. Res. 13: 377–384.
[10]  Sharma, U.K., Kajii Y. and Akimoto, H. (2000). Characterization of NMHCs in Downtown Urban Center Kathmandu and Rural Site Nagarkot in Nepal. Atmos.Environ. 34: 3297–3307.
[11]  Atkinson, R. (1997). Gas-phase Troposphere Chemistry of Volatile Organic Compounds: 1. Alkanes and Alkenes. J. Phys. Chem. Ref. Data 26: 215–290.
[12]  Atkinson, R. (2000). Atmospheric Chemistry of VOCs and NOx. Atmos. Environ. 34: 2063–2101.
[13]  Tang, J.H., Chan, L.Y., Chan, C.Y., Li, Y.S., Chang, C.C., Liu, S.C., Wu, D. and Li, Y.D. (2007). Characteristics and Diurnal Variations of NMHCs at Urban, Suburban, and Rural Sites in the Pearl River Delta and a Remote Site in South China. Atmos. Environ. 41: 8620–8632.
[14]  Tang, W.Y., Zhao, C.S., Geng, F.H., Peng, L., Zhou, G.Q., Gao, W., Xu, J.M. and Tie, X.X. (2008). Study of Ozone “Weekend Effect” in Shanghai. Sci. China, Ser. D Earth Sci. 51: 1354–1360.
[15]  Davidson A. (1993). Update on ozone trend in California's south coast air basin. J Air Waste Manag Assoc 1993; 43: 226–7.
[16]  Wakamatsu S, Ohara T, Uno I (1996). Recent trends in precursor concentrations and oxidant distribution in the Tokyo and Osaka areas. Atmos Environ 1996; 30: 715–21.
[17]  Duenas C, Fernandez MC, Canete S, Carretero J, Liger E (2004). Analyses of ozone in urban and rural sites in Malaga (Spain). Chemosphere; 56: 631–9.
[18]  Elminir HK (2005). Dependence of urban air pollutants on meteorology. Sci Total Environ; 350: 225–37.
[19]  Camalier L, Cox W, Dolwick P (2007). The effects of meteorology on ozone in urban areas and their use in assessing ozone trends. Atmos Environ; 41: 7127–37.
[20]  Carvalho A, Monteiro A, Ribeiro I, Tchepel O, Miranda AI, Borrego C, et al (2010). High ozone levels in the northeast of Portugal: analysis and characterization. Atmos Environ.; 44: 1020–31.
[21]  Garcia MA, Sanches ML, Perez IA, Torre B (2005). Ground level O3 mixing ratios at a rural location in northern Spain. Sci Total Environ; 348:135–50.
[22]  Nishanth M. K, Satheesh Kumar and. Valsaraj T.K (2012). Variations in surface ozone and NOx at Kannur: a tropical, coastal site in India, J Atmos Chem 69:101–126.
[23]  Kassem. Kh.O, Elshazly S. M, Masaaki Takahashi, El-Nouby adam M, Hassan. A A and Emad. A.A (2010). Diurnal and seasonal variations of surface ozone in Cairo and Alexandria, Egypt.
[24]  El-Hussainy, F.M., Sharobiem, W. M., Ahmed, M. D., (2003) Surface ozone observations over Egypt. Quarterly Journal of Hungarian Meteorological service. Vol, 107, No.2 April-June, pp.133-152.
[25]  Shampa Sarkar (2015) Seasonal Monitoring of Ozone Concentration and its Correlation with Temperature and Relative Humidity. Int. Res. J. Environment Sci. Vol. 4(7), 81-85.
[26]  Hesham A. Al-Jeelani (2014). Diurnal and Seasonal Variations of Surface Ozone and Its Precursors in the Atmosphere of Yanbu, Saudi Arabia. Journal of Environmental Protection, 5, 408-422.
[27]  M. I. Khoder. M. I (2009) Diurnal, seasonal and weekdays–weekends variations of ground level ozone concentrations in an urban area in greater Cairo, Environ Monit Assess, 149:349–362.
[28]  Abdul-Wahab, S.A., Al-Alawi, S.M., 2002. Assessment and prediction of tropospheric ozone concentration levels using artificial neural networks. Environmental Modelling and Software 17, 219–228.
[29]  Abdul-Wahab, S.A., Bouhamra, W., Ettouney, H., Sowerby, B., Crittenden, B.D., 1996. A statistical model for predicting ozone levels in the Shuaiba Industrial Area in Kuwait. Environmental Science and Pollution Research 3, 195–204.
[30]  Abdul-Wahab, S.A., Bouhamra, W., Ettouney, H., Sowerby, B., Crittenden, B.D., 2000. Analysis of air pollution at Shuaiba Industrial Area in Kuwait. Toxicological and Environmental Chemistry 78, 213–232.
[31]  Jun, T., Xia, Z., Wang, H. and Li, W. (2007) Temporal Variations in Surface Ozone and Its Precursors and Meteorological Effects at an Urban Site in China. Atmospheric Research, 85, 310-337.
[32]  Dueñas, C., Fernández, M.C., Cañete, S., Carretero, J. and Liger, E. (2002) Assessment of Ozone Variations and Meteorological Effects in an Urban Area in the Mediterranean Coast. Science of the Total Environment, 299, 97-113.
[33]  Lehman, J., Swinton, K., Bortnick, S., Hamilton, C., Baldridge, E., Eder, B. and Cox, B. (2004) Spatio-Temporal Characterization of Tropospheric Ozone across the Eastern United States. Atmospheric Environment, 38, 4357-4369.
[34]  Satsangi, G.S., Lakhani, A., Kulshrestha, P.R. and Taneja, A. (2004) Seasonal and Diurnal Variation of Surface Ozone and a Preliminary Analysis of Exceedance of Its Critical Levels at a Semi-Arid Site in India. Journal of Atmospheric Chemistry, 47, 271-286.
[35]  Saito, S., Nagao, I. and Kanzawa, H. (2009) Characteristics of Ambient C2-C11 Non-Methane Hydrocarbons in Metropolitan Nagoya, Japan. Atmospheric Environment, 43, 4384-4395.
[36]  Zhang, B.N. and Oanh, N.T.K. (2002) Photochemical Smog Pollution in the Bangkok Metropolitan Region of Thailand in Relation to O3 Precursor Concentrations and Meteorological Conditions. Atmospheric Environment, 36, 4211-4222.
[37]  Negar Banan, Mohd Talib Latif, Liew Juneng, Fatimah Ahamad (2013): Characteristics of Surface Ozone oncentrations at Stations with Different Backgrounds in the Malaysian Peninsula. Aerosol and Air Quality Research, 13: 1090–1106.
[38]  T. Nishanth & M. K. Satheesh Kumar & K. T. Valsaraj Variations in surface ozone and NOx at Kannur: a tropical, coastal site in India. J Atmos Chem (2012) 69:101–126.
[39]  Topcu S, Incecik S. Surface ozone measurements and meteorological influences in the urban atmosphere of Istanbul. Int J Environ Pollut 2002; 17: 390–404.
[40]  Topcu S, Incecik S. Characteristics of surface ozone concentrations in urban atmosphere of Istanbul: a case study. Fresenius Environ Bull 2003; 12: 413–7.
[41]  Im U, Tayanç M, Yenigun O. Interaction patterns of major photochemical pollutants in Istanbul, Turkey. Atmos Res 2008; 89: 382–90.