-
Paper Information
- Paper Submission
-
Journal Information
- About This Journal
- Editorial Board
- Current Issue
- Archive
- Author Guidelines
- Contact Us
World Environment
p-ISSN: 2163-1573 e-ISSN: 2163-1581
2016; 6(3): 71-78
doi:10.5923/j.env.20160603.01

False Adaptive Resilience: The Environmental Brutality of Electric Power Generator Use in Ogbomoso, Nigeria
 Abstract
 Reference
 Full-Text PDF
 Full-text HTML
Akindele O. Akin
Department of Urban and Regional Planning, Ladoke Akintola University of Technology, Ogbomoso, Nigeria
Correspondence to: Akindele O. Akin, Department of Urban and Regional Planning, Ladoke Akintola University of Technology, Ogbomoso, Nigeria.
| Email: |  |
Copyright © 2016 Scientific & Academic Publishing. All Rights Reserved.
This work is licensed under the Creative Commons Attribution International License (CC BY).
http://creativecommons.org/licenses/by/4.0/

Epileptic electric power supply in Nigeria has forced almost every household and firms to the usage of electric power generators. This has been noted to have direct and indirect consequences on the local and global environment. Against this background, this paper analyses the environmental consequences of electric power generator usage as it relates with contributions to climate change. Issues were taken from the incidence of electric generator usage, the mathematical estimation of the amount of fossil fuel combusted via the use of the generator and therefore the emission estimation of carbon and carbon dioxide was performed. This was done using the online carbon footprint calculator. Using multi-stage sampling procedure, 50 urban blocks and 517 respondents were sampled observing the plethora of electric generator types and the effluents from them. The study observed that the use of electric generators when summed together for about 180M Nigerian population taking a cue from the study area is a monumental contribution to climate change. Distance and green buffers were suggested as antidotes to the problems of electric generator use.
Keywords: Electric power generator, Carbon footprint, Adaptive resilience, Environmental pollution, Nigeria
Cite this paper: Akindele O. Akin, False Adaptive Resilience: The Environmental Brutality of Electric Power Generator Use in Ogbomoso, Nigeria, World Environment, Vol. 6 No. 3, 2016, pp. 71-78. doi: 10.5923/j.env.20160603.01.
Article Outline
1. Introduction
- Climate change is today recognized as one of the defining challenges of the 21st century [1]. The latter part of the 20th century saw an average of 0.6°C increase in global temperature. This was projected to produce between 1.4°C -5.8°C global temperature increases in the 21st century, only if the rate of carbon emission, economic and demographic development patterns can be stabilized. Continued use of fossil fuel, the corresponding high generation as well as the accumulation of carbon dioxide has been blamed as a major factor for global warming [2-5]. The ever increasing urbanization does not only bring irreversible changes in production and consumption pattern, it creates overload for the existing insufficient facilities and as well encourages a massing of wastes and pollutants at a scale too high for the carrying capacity of cities. This is because more than 75% of global energy is consumed (most of which are borne by burning fossil fuels) in the cities producing more than 80% GHG [1].The colossal failure of the antiquated National Electric Power Authority (NEPA), and its moribund descendant – the Power Holding Corporation of Nigeria (PHCN, Plc), have compelled almost all Nigerians to invest in electric power generators. Owning a portable gasoline generator in Nigeria today is not only essential, but the norm. Recent statistics from the Centre for Management Development reveals that an estimated 60 million Nigerians invest about N1.6 trillion to purchase and maintain standby generators annually. In a study of Lagos, there was twice the number of electric generators as there are rooms in Lagos [6]. At once therefore, in a building of twenty rooms not less than 15 electric generators would be working simultaneously; emitting thick clouds of environmentally unfriendly gases for very long hours. The most toxic of these product gases is carbon monoxide which is virtually invisible. It is an odourless and colourless effluent which becomes fatal with sustained. The exhaust produced by a typical 5.5 kW generator contains as much carbon monoxide as that of six idling cars. Nigeria is in dire need of active surveillance for proper generator use. There has been a high death toll on the account of electric generator usage and the number is rising on the daily basis [6].The pathology of climate change has been explained from three schools of thought: the terrestrial, astronomical and extra-terrestrial causes of climate change [7]. The first have attributed climate change to: changes in the distribution of land and water surfaces, changes in the earth’s topography, changes in atmospheric chemistry and changes in snow and ice cover of the earth’s surface. The second opined that climate change occurs because of the changes in the eccentricity of the earth’s orbit, changes in the precision of the equinoxes and changes in the obliquity of the plane of ecliptic [8-11]. The third suggests that climate change is borne by the variations in the amount of radiation (solar luminosity) and variations in the absorption of solar radiation outside the earth’s atmosphere [12, 13]. The scientific consensus is that global warming is largely anthropogenic consisting of 36-70% water vapour, 9-26% CO2, 4-9% CH4, and 3-7% Ozone [14, 15]. The atmospheric concentrations of CO2 and CH4 have increased by 31% and 149% respectively, which is a record high since 1750 [16]. Carbon dioxide is expected to rise to 970ppm by 2100 [17]. Climate commitment studies indicate that even if GHG are stabilized at 2,000 levels a further 0.5°C would still occur [18].Humans globally burn 9,730,000 tons of fossil fuel per annum. This connotes 27,027 tons daily. On a daily basis, Nigeria burns about 40M barrel of oil [19]. The more fossil fuel we burn, the more greenhouse gases we have which leads to more and more heat all over the planet which is called global warming that is currently contributing to more than 150,000 deaths and 5million illnesses every year, [20]. Those numbers could double by 2030. Gases are not the only contributors to climate change, other factors such as Internal forcing mechanisms like ocean variability, External forcing mechanism like orbital variation: solar output, volcanisms, and plate tectonics among others. The internal forcing mechanisms are natural processes within the climate system itself while the external forcing mechanisms can be either natural or anthropogenic in nature [21]. The combination of these factors (gases and others) results to terrible effect such as global warming and ozone layer depletion among others. This has brutal consequences on environmental liveability.Generators that use fossil fuel (coal, oil and natural gas) generally have the most widespread effect on the environment, as the combustion process produces airborne pollutants that spread over a wide area. [22-26]. Fossil fuel power plants produce environmental problems including land and water use, air emissions, thermal releases, climatic and visual impacts from cooling towers, solid waste disposal, ash disposal (for coal), and noise. [22]. Due to the need for large amounts of steam, generators can have a great effect on water use [27]. For example, a typical 500 MW coal fired power plant uses 25 x 109 l/GW-year of water, which must be taken from water source, and then cooled to return to the water source with as little environmental effect as possible. The biggest effect fossil fuel plants have overall is the emission of air pollutants, particularly SOX, NOX, CO, CO2, and hydrocarbons. Carbon monoxide, CO, carbon dioxide, CO2, and the hydrocarbons are the "greenhouse gases," believed to be responsible for global warming. SOX and NOX produce acid when released into the atmosphere, leading to the production of acid rain [22]. It therefore behooves this study to know: is the incidence of electric power generator high enough to be significant in climate change studies? Is there any evidence that the environment is bearing any brunt yet as a result of generator use? This paper therefore investigates the real and potential contribution of electric generator use to residents’ livability with particular reference to climate change.
2. Climate Change and the Human Factor
- Human induced activities including the excessive production of CO2 through the use of electric generators have resulted into series of fluctuations in the normal workings of the climate system [28, 29]. Recent observations and experiences shows that, against the normal belief there seems to be certain variability noticed within the space of time for which uniformity in climatic condition is expected. Certain natural causes exist that enhance climatic variability on one hand while on the other hand certain human induced causes of such variability exist. Of particular importance, from the point of view of policy and programmes, documented human induced causes of climate change include: deforestation and conversion of forestland into agricultural land use [30, 28, 31]; and other uses such as transportation; accumulation of carbon dioxide; such as through the excessive use of electric generators, overpopulation [3, 4], 2007; changes in land use pattern and expansion of built up environment ([31-36]. Desertification is a natural follow up from climate variability, but the contribution of man to its widespread is widely acknowledged [23, 25, 26, 24]. Heat trapping GHGs gases has been accumulating due to human activities causing hike in global temperature. This includes Carbon-dioxide (CO2), Methane, Nitrous oxide and Chlorofluorocarbons (CFCs) in the atmosphere; all of which are contributing to the warming of the earth. This inclusion makes the earth gets warmer than it would have been otherwise. Following increased human activities such as, the burning of oil and coal; the destruction of forests and the warming that comes from the effects of metabolism of plants and soils. These activities have individually and/or jointly released larger quantities of carbon-dioxide into the atmosphere than it has been removed either by diffusion into the oceans or by photosynthesis of plants on land [30, 37]. The quantities of Carbon dioxide (CO2) and other heat trapping gases are though very low yet, they hold high capacity in retaining certain appreciable quantities of radiant heat (infra-red radiation). An increase in the quantity of CO2 and other heat trapping gases lead to an increase in the capacity of the earth to retain heat thereby raising the temperature at which the atmosphere comes to equilibrium with the radiant energy received from the Sun [37]. Usage of electric generators surely would increase the local production of CO2 and so the local leading to global increase in temperature.The world’s average temperature in the last 3 or 4 centuries has increased by 0.5°C [30, 31]. The accumulation of the heat trapping gases in the atmosphere shifts the equilibrium between the incoming solar radiations from the earth into the blackness of space continuously for a new higher temperature. This aggravates land heating and water evaporation, causing even a higher temperature. More of such evaporation causes more opportunity to warm the higher latitudes. Warming of the earth through the internal factor of the sun is natural. The warming becomes exacerbated with the accumulation of the heat trapping gases. The evidence from the past century suggests that in the middle and higher latitudes, the warming may proceed at a rate of 0.3°C to as much as 1°C per decade throughout the next decades. If no steps are taken to reduce the accumulation of heat-trapping gases, the warming can be expected to accelerate. A One degree centigrade change in mean temperature in the middle latitudes on land in the northern hemisphere is encountered by moving 60 to 100 miles latitudinal. Such changes are expected to accumulate in these latitudes over the next decades unless steps are taken now to slow or stop the accumulation of heat trapping gases [38, 39]. Buttressing the above statement, during the 1953 – 1988, the mean temperature of Ibadan city increased on the average by 0.033°C per annum (approximating 0.33°C per decade) owing to the increasing incidence of release of heat trapping gases attending the increase in the population of motor vehicles over the years. Hence, the mean air temperatures have been generally warmer [40].
3. Ecological and Carbon Footprints
- The concepts of ecological and carbon footprints [41-43] put forward a plausible understanding the spatial capital required to run our earth, what is available or potentially available and the rate and extent of how and where we take and consume ecological resources. Carbon footprint has been defined as the total set of GHG emissions caused by an individual event, organization or product.The concept of externalities is useful in the explanation of most types of environmental degradation. Externality occurs when the actions of one entrepreneur or country affect other economic agents or countries, and the actions are not controlled by market forces [44-46]. It is the cost or benefit imposed by the production and consumption activities of an individual on the rest of the society towards which no payment was made. Global warming may be likened to an environmental externality that was generated by an individual city or state of which consequences are imposed on other cities or states without a cost from the one generating it or a compensation for the one bearing the brunt.
4. Methodology
- The study relied on primary and secondary data. Using multi-stage sampling procedure, 50 urban blocks and 517 respondents were sampled, observing the plethora of electric generator types and the effluents from them. Air samplers were used to estimate the effluence from the sampled electric generators. The online carbon footprint calculator was used to estimate carbon footprint for the usage of electric generators.Complete Combustion
 Incomplete Combustion
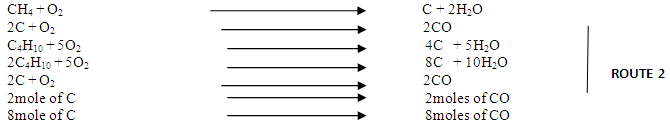 The study estimated the carbon footprint of electric generator use upon the assumption that the volume of hydrocarbon used is a function of the volume of GHGs emitted.
 5. Discussion of Findings
- This section of the paper discusses the role of electric power generators in the accumulation of GHGs. The first part discusses the incidence of electric generator use. The second part discusses the incidence of types of effluents produced through the use of electric generators. This information gives impetus to the contribution of electric generator to the local and global accumulation of major greenhouse gases.
6. Incidence of Generator Use
- Understanding the incidence of generator use is not very simple. Number of persons having a generator alone would not give the best picture if the incidence of power outage is not investigated. Incidence of power outage alone would not tell in precise terms the number of hours that each individual or individual household put their electric generators on. The number of the working hour of the sampled generator may not also tell us the amount of fuel burnt per day and so the actual estimation of the pollutants produced by the generator. This is because, the age of generator, frequency of servicing the generators, type of generator in terms of capacity and the type of fuel it uses need to be factored into the conclusion.The incidence of power outage was summarized from the number of hours during which the residents could not enjoy electricity from the government, per day, the number of day in a week and the rate at which it trips off. For instance, it answers the question; if there was electricity, how long does it stay on before it goes out? The rate at which electricity trips off was obtained in ordinal form, while the rest were taken at interval scale. Likert scaling was used to convert the ordinal data to interval. The addition of the three was divided by three (the number of variables involved) and the result is presented on table 3. Generator possession was measured in ratio scale that is; the percentage of respondent that has a generator. Regularity of generator usage was measured in ordinal scale rating from daily, 5 days a week, twice a week to quarterly a year. The number of generator work hour, average volume of fuel used per day, number of generators in the building, age of generator, distance to building, number of generator used for domestic or other uses were measured in interval scale. It must be stated here that for the purpose of analysis, the scaling used for all the ordinal data here allotted more weight to the negative values of generator use. For instance, the respondents rating of the incidence of power outage starts from ‘very much significant’, ‘very significant’, ‘just significant’, and ‘not significant ’to‘ not at all significant. The weights allotted to these respectively are 0, 1, 2, 3 and 4. So that when power outage is not significant at all, it will score a higher point. This will align the scaling with the purpose of analysis and computation combination with other variables may be meaningful.
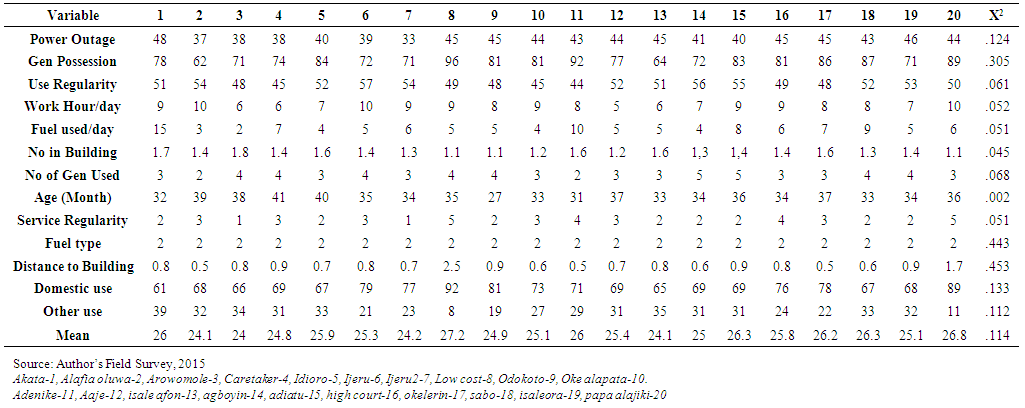 | Table 1. Incidence of Generator Use |
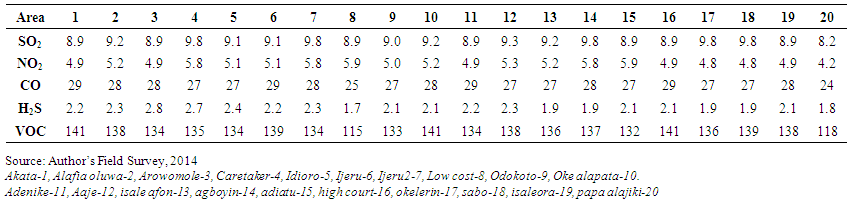 | Table 2. Effluence from Electric Generator (mg/m3) |
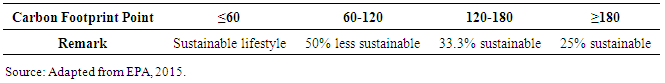
7. Carbon Footprint Estimation for Domestic Electric Generators
- This study adapts the carbon footprint estimation using the online carbon footprint calculator (EPA, 2015). The calculator is a comprehensive account of the total make up of household’s lifestyle that directly concerns the emission of CO2 or relating to it. It is assumed here that; the rate at which different engines combust fuel/fossils is not the same, but is dependent on their individual power rating. However, the mean average of all the sampled electric generators is put in the analysis of this paper. Again, because the ecological footprint calculator did not specifically include electric power generators in the scoring guide, the ones used for transportation is adapted here since both vehicles and electric generators work alike and combusts hydrocarbons to produce greenhouse gases. For simplicity therefore, instead of comparing the distance covered by vehicles with number of electric generator’s working hour; the volume of hydrocarbon combusted by each of the households sampled were commuted into CO2 factors (lbs) as was operationalised by the online calculator.Household carbon a footprint has been used to describe the total CO2 emissions associated with household energy consumption. According to the study, almost all the houses have one or more electric generator set. Aside this, services paid for that have been processed with electric generator are also factored into the analysis. For instance, number of children whose school runs on generator, number of hours on which any members of the family stays on generator outside the home including shopping, salon, laundry, grinding, phone charging, cinema, printing and photocopy and refrigeration of food items among others but done outside the house are all commuted into each household’s electric generator’s carbon footprint.
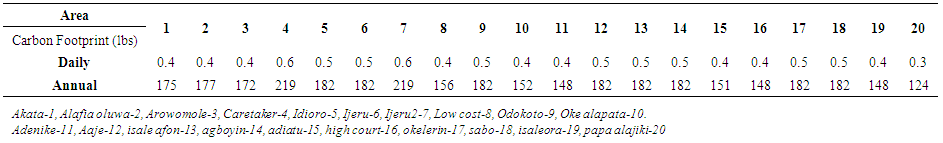 | Table 3. Estimated Households’ Carbon Footprint of Electric Generator |
|
8. Concluding Remarks
- Sustainable facility provision through solar, wind and hydro-electric power sources would go a long way to reduce carbon foot print through electric generator use. Residents need more environmental education to make choices for sustainable environment. This is when sustainable environmental practices would be encouraged among the citizenry. Greening the city is an imperative for carbon mitigation which is a tenet of environmental conservation through tree planting and soft environmental landscaping, creation of parks and gardens including sustainable urban agriculture. When all these are put into consideration, carbon footprint would reduce greatly leaving our earth a more liveable place.