Jan-Erik Lane
Fellow with Public Policy Institute, Belgrade, Serbia
Correspondence to: Jan-Erik Lane, Fellow with Public Policy Institute, Belgrade, Serbia.
| Email: |  |
Copyright © 2016 Scientific & Academic Publishing. All Rights Reserved.
This work is licensed under the Creative Commons Attribution International License (CC BY).
http://creativecommons.org/licenses/by/4.0/

Abstract
As more and more signs of global warming appear, people ask why not more is done to halt climate change as well as whether the COP21 project really can deliver upon its promises. A decentralised policy approach puts the emphasis upon the various country governments in accordance with the principle of state sovereignty in public international law. But without strong international coordination and governance, the COP21 project may falter. Thus far there is only transaction cost activity with meeting among IGO:s and NGO:s as well as a small COP21 secretariat. The Super Fund that will finance the energy transition to carbon neutral energy sources is still in limbo: How to raise this colossal amount of dollar and how to distribute it? All these questions are problems for the social sciences. Which have been little heard so far. Management theory and implementation theory should be brought to bear on the COP21 project before it crumbles. Global governance of climate change problems must become more explicit and stronger, employing theSuper Fund for incentives.
Keywords:
Decarbonisation: Goal I, Goal II and Goal III, Risk of garbage can processes, Super Fund and incentives, Managing COP21 project, Implementation theory, COP21 goals: I, II, III
Cite this paper: Jan-Erik Lane, COP21 MANAGEMENT: Decentralised Policy-Making, International Governance and the Super Fund, World Environment, Vol. 6 No. 2, 2016, pp. 34-61. doi: 10.5923/j.env.20160602.02.
1. Introduction
In Paris, the governments of the states of the world together with IGO:s and NGO:s committed themselves to the biggest management project in human history ; complete decarbonisation during the 21 century. Could such an enormous change in energy consumption really be accomplished – constituting implementation success? And how is the COP21 process to be managed, interconnecting national governments with international governance?The background of this unique coordination project covering almost all states and involving so many IGO:s and NGO:s is the fear of climate change in the coming decades with threat of global warming at levels that people can difficultly support, with dire consequences for both the economic and social systems. The COP is based upon a theory about global temperature that singles out energy as the crux of the matter, in particular the so-called anthropogenic greenhouse gases (GHG) and the CO2 emissions among them.Yet, the essential theory behind COP stems from the natural sciences, including a host of hypothesis about GHG:s and temperature as well as projections for the future consequences of alternative warming levels – not uncontested ones, some of them with uncertainty. But where is the set of hypotheses from the social sciences about how to go about this huge project to save mankind and its fundamental living conditions?The aim of this paper is to point about the problematic of global warming management in relation to the three basic objectives: Goal I, Goal II and Goal III. Unless these problems are paid attention to, we will face a dire implementation failure. The assumptions upon which COP management are built need to be spelled out and critiqued for veracity, as they may be make belief. They speak of a close coordination of decentralised policy-making and international oversight and control in relation to the goals of halting the rise of CO2:s, reducing CO2:s by 40 per cent and perhaps move towards a decarbonised economy entirely.
2. Management Theories
One may separate between at least four types of management theories, looking at developments since the beginnings of the 20th century with the giants Weber., Fayol and Taylor. Lots have been written about the development of the managerial approach, but here we simplify matters a little to get to the point that is relevant for the COP21. Thus, we have:1) Instrumental rationality, or efficiency: The basic paradigm is the means-end, to be employed for recommendations about improvement and change. How to organise things so that we have Max Outputs – Inputs – physical effectiveness? Or how to Max Revenues – Costs, when activities can be measured in money ? This approach is normative, but not morally normative.2) Ethical rationality: How to design the best organisations in an overall meaning? Management has to take various aspects of organisation into account, and not merely efficiency or productivity in a narrow sense. Thus, a list of evaluation criteria was developed and analysed: human relation dimensions like satisfaction, happiness, proudness etc., environmentalism, service to local communities, lack or corruptibility, etc. The overall assessment favour management in organisations constrained by market forces. Thus, socialist management was outlawed and cronyism criticised.3) Real life management, or bounded rationality: Even if managers would try hard, which they do not always happen to do, they face cognitive limitations, barring comprehensive rationality of type 1). Instead they must concentrate upon a limit set of established objectives and rely upon a safe set of means, or technologies. H. Simon labelled this management style « standard operating procedures ».4) The garbage can model of foolish management: March, once a collaborator of Simon, took the limitation on rational decision-making to its ultimate concept ual opposite with Norwegian Olsen, viz organised foolishness. If it were to be true of COP implementation, then we should not try this. We will wait and see what happens and how to react in a peace-meal fashion, i.e. the policy of resilience with Wildavsky. However elegant theoretically, the garbage can model always suffered from an ambiguity:- is garbage can modelling necessarily true of management, public, private, international, etc. ?- or is this model merely a contingency, covering a few cases of policy failures and management errors ?I believe the second tenet is defendable, but certainly not the first tenet.Approaching COP implementation, one would still bet upon the management approach 1), searching for policies that eliminate fossil fuels for electricity production and bring down CO2 emissions in transportation. It can be done, but will it be enough for the COP21 objectives.I will argue that COP21 management face four sets of countries in different conditions:i) weak governments in anarchic societies;i)) strong government in well-ordered societies:iii) countries vary much reliant upon fossil fuels or traditional renewables;iv) countries with a balanced energy mix.One can classify all the signatory states to the Paris Agreement on COP21 into these four sets. And the prediction is that governments in ii) and iv) may succeed with COP21 management by themselves. Countries in ii) and iii) will need assistance from international governance bodies, while countries in i) and iii) need massive financial assistance, albeit with the imminent risk of embezzlement.COP21 management has to take the following two factors into account:  when it starts. And these two factors strongly affect the likelihood of success or degree of goal attainment for the COP21 project.Now, the COP21 project is not only a responsibility for national governments but there is also the dimension of international governance. Somehow an oversight function is to be set up involving not only transaction cost heavy reunions of global leaders but also project controls based upon evaluation of performance and outcomes. The key incentive here is the Super Fund and its hundred billion dollars per year. Nothing like this has even been tried in management, combining international guidance with national policy-maing on such a grandiose scale.Incentives play a major role in social and economic life besides legal prohibitions. The COP21 project has to figure out the incentive mechanisms to employ for a most dramatic transformation of the present energy consumption structure in order to reduce the anthropogenic greenhouse gases. Thus, costs for the use of fossil fuels must go up and projects for carbon neutral power sources be subsidised. But how is all of this to be done nationally and under international guidance?To sum up: COP21 management faces a variety of country situations with regard to the GDP-CO2 link and the energy mix. We will make an overview of these country differences that will play a major role in policy-making as well as international governance. Thus, the Super Fund should target the most polluting countries as well as the weakest states in terms of resources for policy change.
3. Empirical Findings
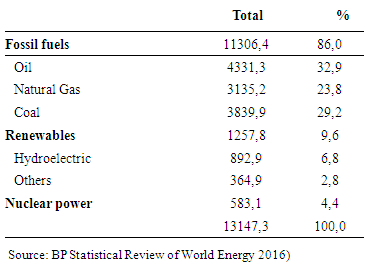
A sample of countries will be looked at below. It takes into account their GDP-CO2 links as well as their patterns of energy consumption. The emphasis is upon the huge country differences that need to be acknowledged and taken into account in global governance.i) THE GLOBAL ENERGY SITUATIONEnergy is the capacity to do work. Lacking energy, no social system can operate, not even the family. The daily use of energy is almost astronomical on a small Planet Earth, and it has had a trend of steady increases year by year. The governments of the states of the world have obliged the change the prevailing energy pattern profoundly in a short time period of a few decades. Not only may all forms of energy be measured, but all these measures are translatable into each other – a major scientific achievement. One may employ some standard sources on energy consumption and what is immediately obvious is the huge numbers involved – see Figure 1.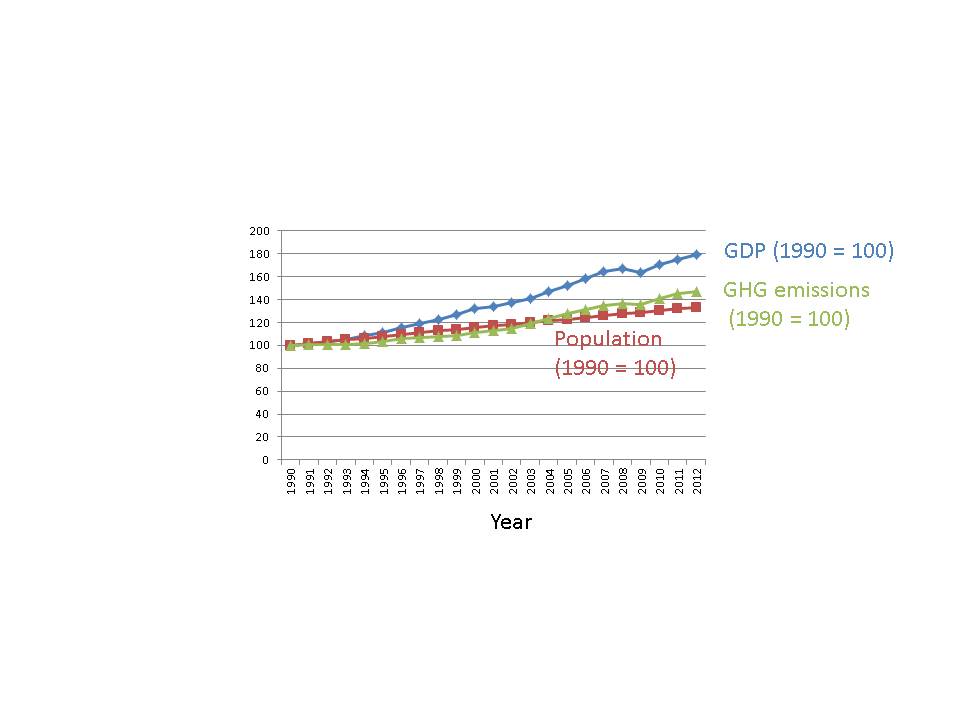 | Figure 1. The global scene |
Table 1. Energy consumption 2015 (Million Tonnes of oil equivalent)
 |
| |
|
Examining Figure 1, one understands the size of the task of the decarbonisation policy effort. Complete decarbonisation would mean the elimination of the energy consumption of fossil fuels and traditional renewables. This is a herculean task, impossible simply. But the mix of energy usage will change during this century towards more of carbon neutral energy sources, but all the stylised energy projections provide fossil fuels with prominent share of energy markets.The three steps in global COP management include:- reversing the GDP-GHC(CO2) link from increasing to decreasing - GOAL I:- cut CO2 emissions by 40& by 2030, from 2005 base - GOAL II;- eliminate fossil fuels more or less by 2075 – GOAL III.The question arise of course; How is this to be managed? And the costs involved? The main replies so far state: decentralisation to each nation and drawing upon the Stern Super Fund! Thus, each government or state has accepted this 3 steps goal and they can draw upon the expertise of IGO;s and NGO;s as well as ask for financial help from the Super Fund to be put in place at some point in time. How to manage this uniquely gigantic project?COP21 management can do nothing about population growth increasing the CO2:s directly and indirectly, but it may attempt to change energy consumption so that the link between GDP and GHG(CO2) is broken (Figure 2).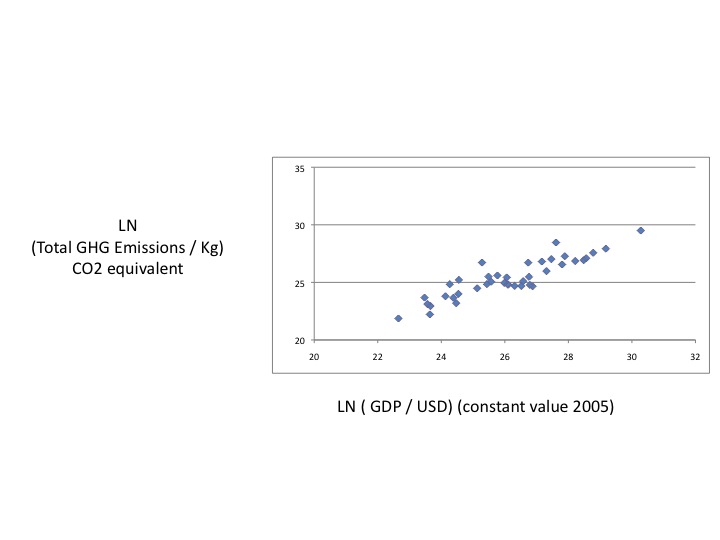 | Figure 2. GDP-GHC link globally |
However, given the link in Figure 2, COP21 management cannot simply recommend that economic output be cut back – Sach's sustainable economy. Decarbonisation is to be maximised, given the constraint that economic growth is NOT undermined. But the energy needs of human social systems just keep augmenting (Figure 3).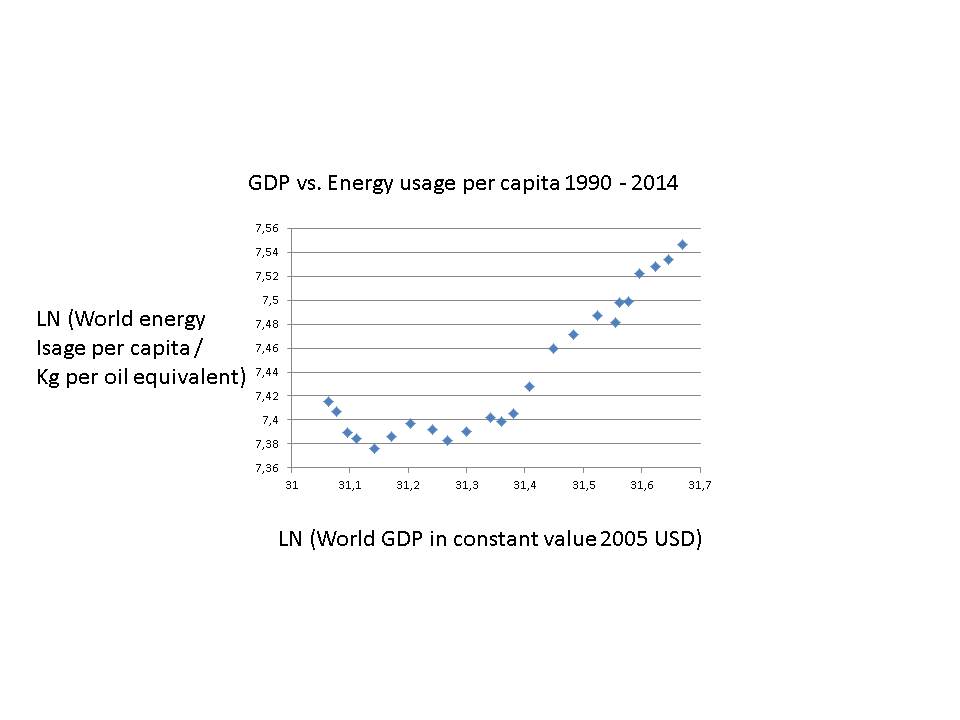 | Figure 3. Economic development and energy per person |
Thus, the «noyeau »: Change energy pattern ! But it can only be done by each country in the world. Let us distinguish the promising cases from the not so promising ones, i.e. with regard to the possibility of rational management of COP21 goals. Where is goal achievement likely?ii) COUNTRY PREDICAMENTSOur argument is that countries face very different conditions for decarbonisation according to the three steps of the COP21 project. Let us give some examples from around the world, employing the basic model: a) COUNTRIES WITH DECLINING CO2:sIt is perhaps not astonishing that Nordic countries have broken the GDP-GHG(CO2) link and have conducted decarbonisation with admirable success. These are tiny countries with minor effect upon the global scenarios above in Figures 1-3. But they often set the tone at international meetings on climate change. Let us examine Denmark (wind power), Sweden (atomic andhydro power).and Norway (hydro power and gas).
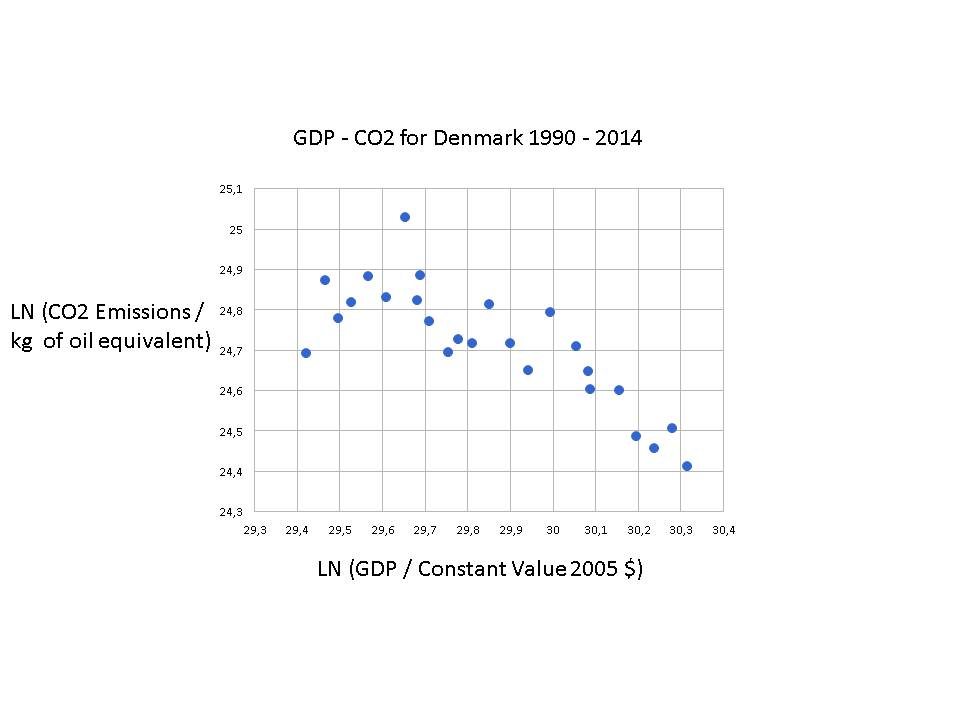 | Figure 4. Denmark: Declining curve |
Danish governments and society has achieved a remarkable turn around, combining economic growth with the decrease of CO2:s. Yet, this accomplishment much advertised only satisfies GOAL I in COP21 management, i.e. the first objective for 2020. Denmark like any advanced capitalist county still relies upon fossil fuels, including coal (Figure 5).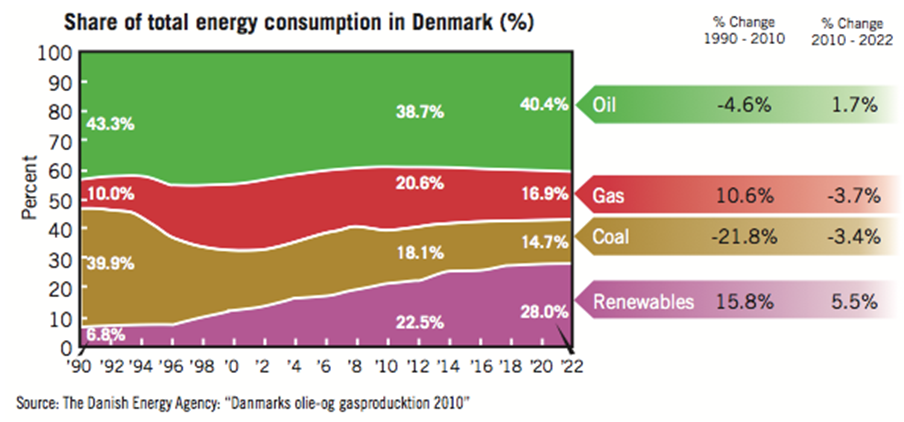 | Figure 5. Energy consumption in Denmark (1990-2022) |
Danish state and society must reduce oil and natural gas more to comply with the GOAL II in COP21 management – solar power?The Swedish curve for GDP-CO2:s looks much the same as Danish neighbour, downward and outward sloping, but the Swedish energy mix is very different from Denmark's (Figure 6), as for instance Sweden is not a producer of oil and natural gas. However, Sweden presents a most diversified energy production and consumption pattern, which constitutes a POSITIVE for accomplishing the GOAL I and II in time.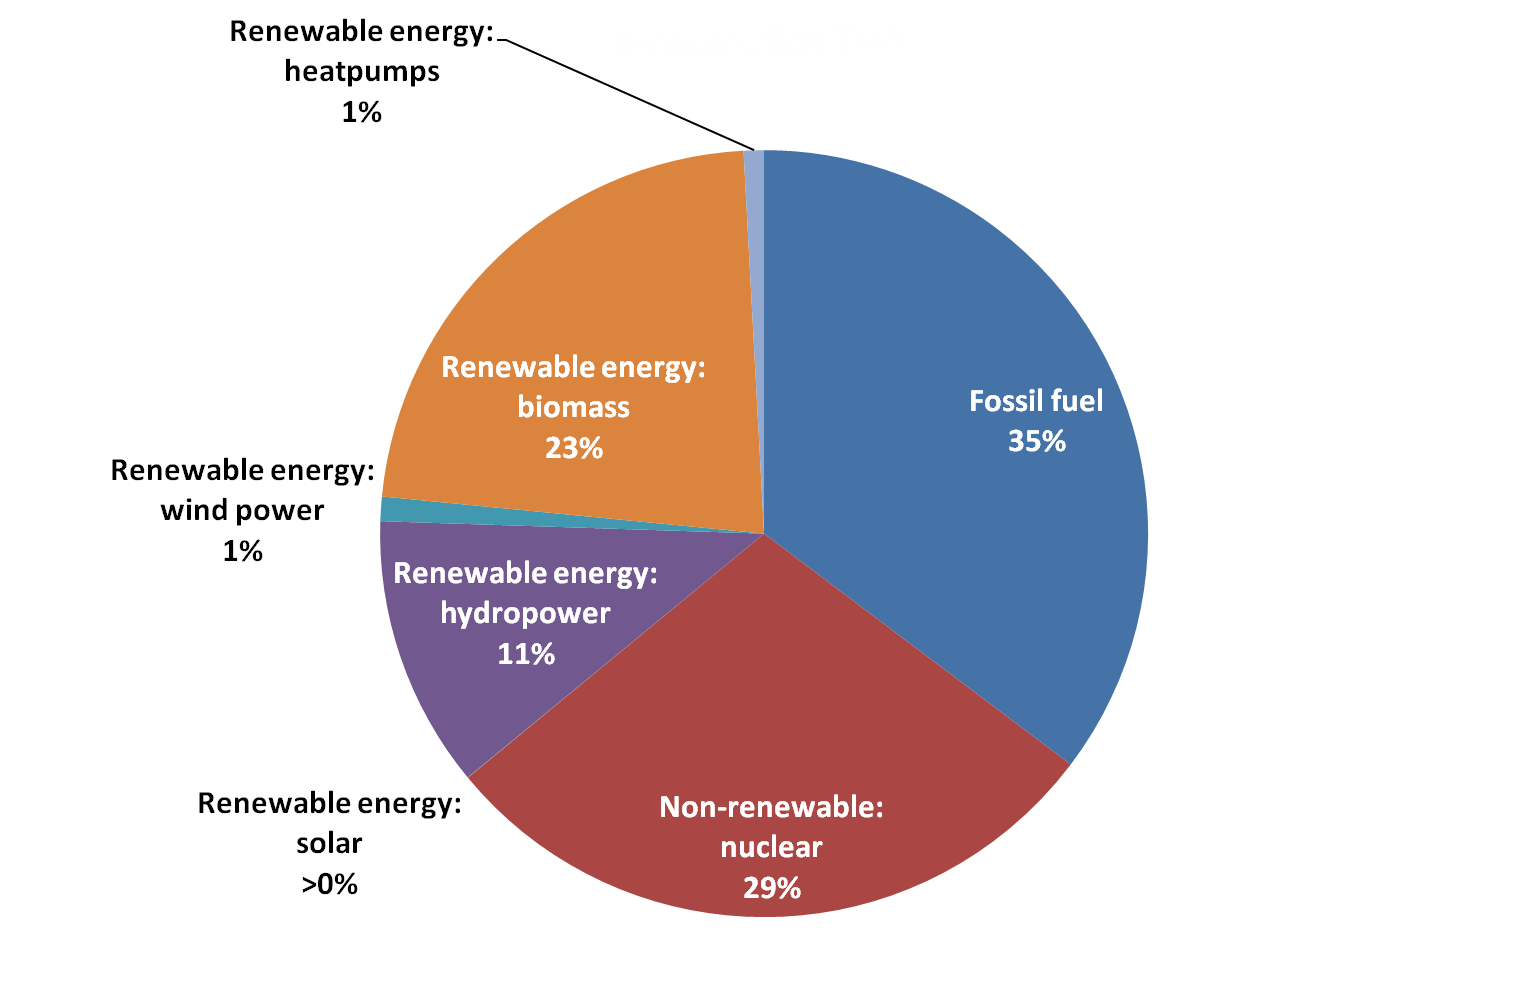 | Figure 6. Energy mix for Sweden |
The problem in Swedish energy management is policy ambiguity, reflecting the availability of many means too few goals. Sweden pursues an aggressive line of anti-nuclear power, either closing plants or restrain it by taxation. Thus, modern renewables like solar, wind and thermal power sources are given favourable treatment by the state. But this policy ambiguity characteristic of European environmentalism mixes up two entirely different kinds of green concern, viz the short-run fear of global warming with the long-run storage problem of atomic waste. Sweden has started use rely much upon burning waste and peats, despite their emissions.Interestingly, Norway displays a higher emission f GHG:s than Denmark and Sweden per capita, despite its great reliance upon hydro power (Figure 7).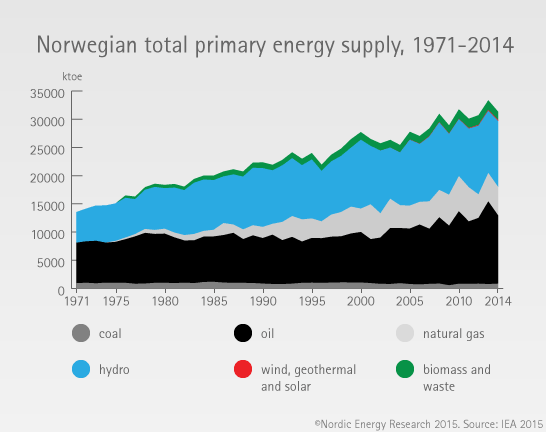 | Figure 7. Norway’s energy mix. Source: http://www.nordicenergy.org/indicators/topic/energy-systems-2/ |
In addition to access to enormous hydro power resources, Norway has lots of natural gas, although the country has experienced its Hubbert peak for oil production. Norway as the other Scandinavian countries fulfil GOAL I in the COP21 project, but will face difficulties with the accomplishment of GOAL II. None of these.Rich countries could hope for assistance from the Super Fund.The Nordic countries display good numbers on decarbonisation today and constitute a promise for the achievement of GOAL I and II though hardly for GOAL III. They have actually high GHG;s or CO2:s per capita, although not like the Gulf States (Qatar!). One man require in COP21 management that they reduce CO2:s even more than GOAL II, but this is to enter justice into the management model. Justice comes up naturally through contribution via the Super Fund to poor nations with huge emissions totally see but low on a per capita level.Summing Up: The Scandinavian countries are well situated for Goal I, but they need to do a lot more for achieving Goal II. They could hardly qualify for Super Fund assistance. Time has come to examine the giant country polluters, whether they have high or low emissions per person.b) COUNTRIES WITH UNCERTAIN POLICIESWhen one goes beyond the EU, one finds only two cases of declining GDP-COP curve: Australia and Japan. Japan has for a long time substituted coal for atomic power, although recently with a crucial set. But Australia has always been the country of fossil fuels, exporting coal and iron in huge amounts. However, it has reached its CO2 peak recently (Figure 8).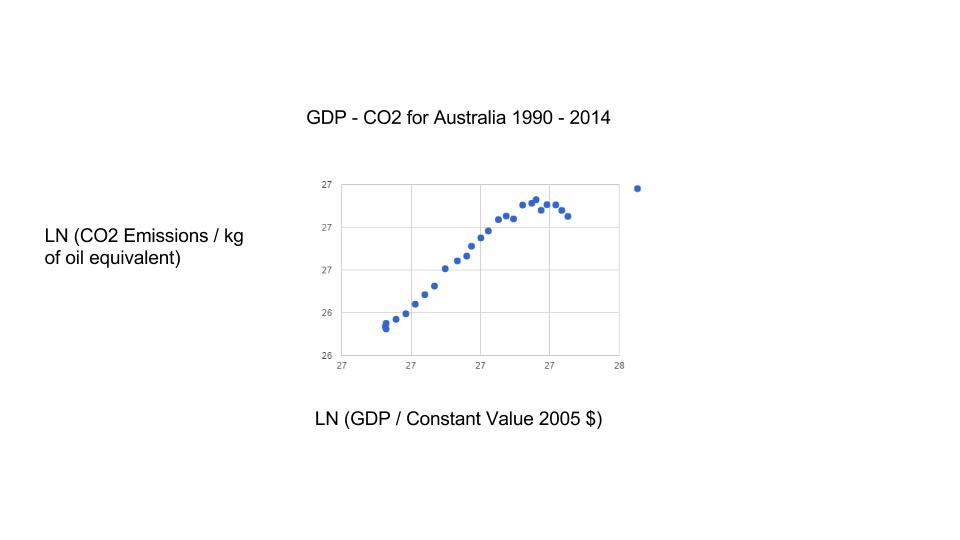 | Figure 8. Australia |
Australia has been extremely dependent upon fossil fuels, domestically and in exports. Cutting back its coal dependency will allow the country to halt its CO2 emissions, while moving to renewables. The fossil fuel dependency of Australia is simply stunning (Figure 9).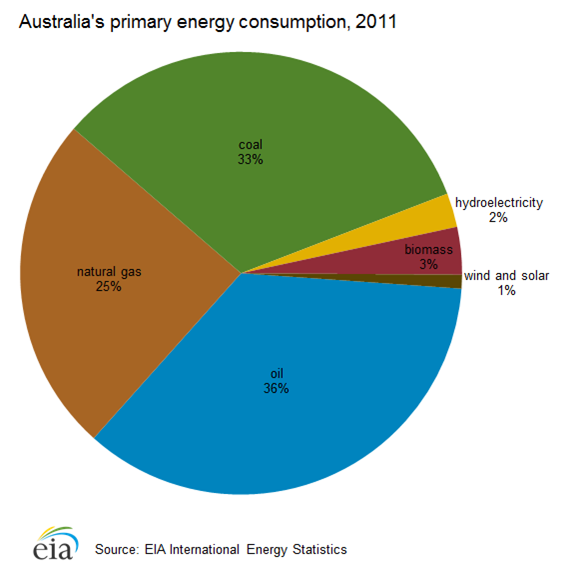 | Figure 9. Energy mix in Australia |
Australia has often been accused of fuelling climate change. These accusations appear to be vindicated in the Figure above that shows an extreme reliance upon fossil fuels. Add then all the export of raw materials! One prime minister of Australia has declared that the country will reduce CO2:s only if economic growth is not hurt. It remains to be seen how Australia tackles Goal I and Goal II.Although Canada is a major emitter of GHG:s as well as one of the world’s largest fossil fuel producer – oil sands, it has managed to stem the increase in emissions for the most recent years, i.e. halting the augmentation, at least for a time (Figure 10). Figure 11 may be invoked to explain this, showing a very mixed energy consumption pattern with lots of different energy sources. | Figure 10. CANADA: LN (CO2 / Kg and LN (GDP / Constant Value 2005 USD) (y = 0,41x + 15,7; R² = 0,85) |
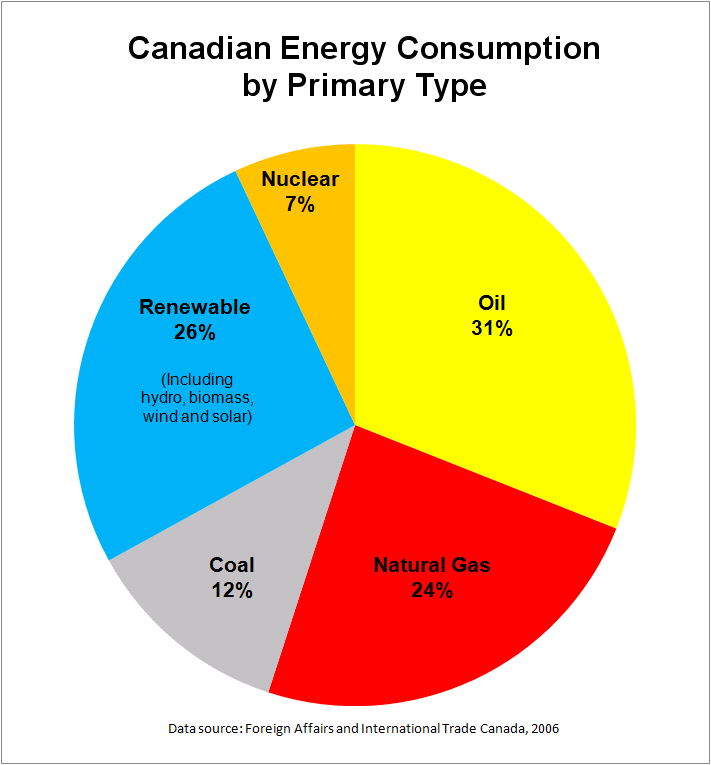 | Figure 11 |
Canada has a strong advantage compared with for instance China and India in that it has access to lots of hydro power and natural gas. The burning of coal is as low as 12 per cent, but oil still makes up almost a third of energy consumption. But its emissions still go up with GDP. How to break this dire link – that is the crux of the matter?!Canada has not yet like the US managed to clearly and definitely turn the links – GDP-energy, GDP emissions - downwards. The collapse of the oil price should make Canada invest more in water and modern renewables or atomic power. But will it happen?For most countries hold that their emission of CO2:s increases, as well as augments with the GDP. However, there are a few notable exceptions of decreases that are worth mentioning among the large mature economies, like the US (Figure 12).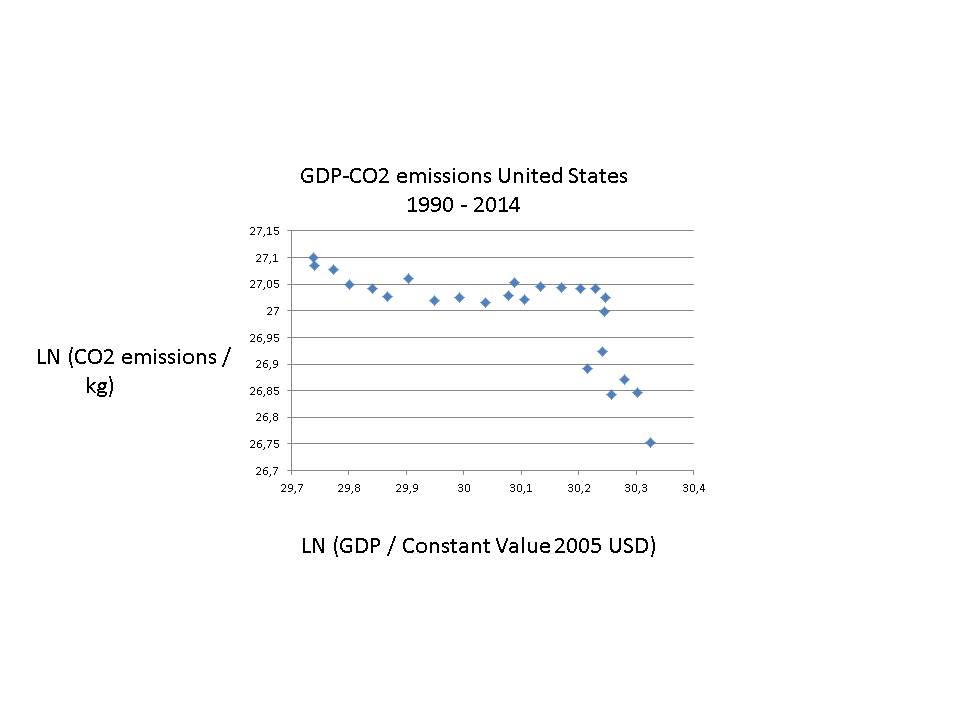 | Figure 12. USA: LN (CO2 / Kg and LN (GDP / Constant Value 2005 USD) (y = -0,32x + 36,7; R² = 0,49) |
Recently, the level of CO2 emission has been reduced significantly in the US. It reflects partly the economic crisis that began 2007, but the entire energy pattern is undergoing change, from coal towards modern renewables. Yet, the US remains the second largest polluter in the world. This CO2 reduction reflects that the US can draw upon a mixed bag of energies, including nuclear and hydro power, with solar power expanding rapidly (Figure 13). But will this trend last?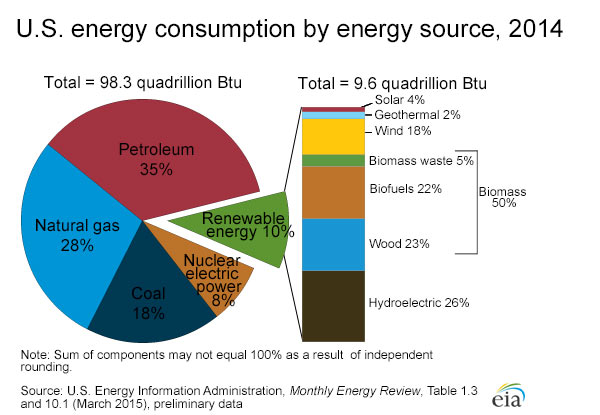 | Figure 13. US energy mix |
The US is still heavily dependent upon fossil fuels, as some 80 per cent comes there from, facing a challenger of reaching GOAL II. What is changing is the shale rock innovation, as more and more of energy is produced within the US, allowing even for considerable export of petroleum. The shake oil and gas revolution may though not promote decarbonisation. Further reduction of CO2:s may meet with firm resistance from the Republican House of Congress, which may oppose the COP21 Agreement, like presidential candidate D. Trump. However, solar power should be attractive in many US states, both in micro use in households and large plant use.Not only coal consumption is being decreased but also atomic power is cut back, as it cannot compete with energy from shale rock. Yet, when solar and wind power falters, natural gas enters the picture. Solar plants take enormous amounts of space. Energy policy-making is most active in Washington, involving a complex system of tax deductions and returns.The advent of shale oil and gas has changed the entire energy markets, lowering the price of oil most substantially. This implies not only that there will be no Hubbert peak oil for the world, but also that switching to renewable energy source will be extremely expensive, relatively speaking compared with shale oil and gas. When petroleum is abundant, then investments in carbon neutral power sources may be non-lucrative and require massive state subsidies. Figure 13 shows how important energy is to the entire US society, including for its superpower position. When further reductions in CO2:s threaten vital national interests, the US like other nations will no doubt employ fossil fuel-Another interesting country is the largest EU economy, namely Germany. Figure 14 shows a marked decrease in CO2 emissions.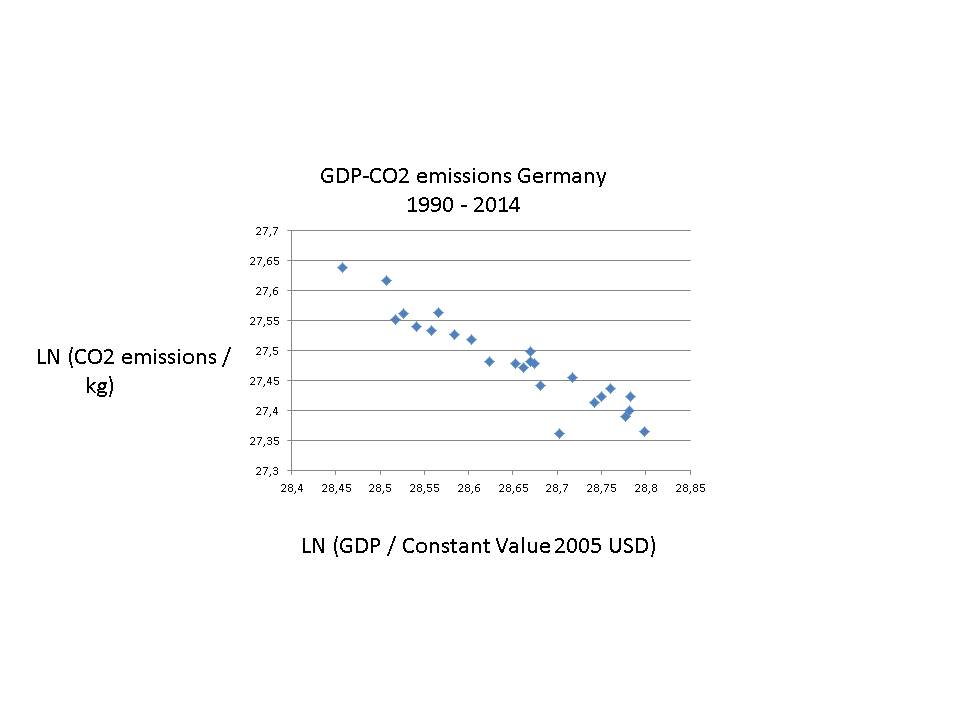 | Figure 14. GERMANY: LN (CO2 / Kg and LN (GDP / Constant Value 2005 USD) (y = -0,69x + 47,3; R² = 0,88) |
The German data show an impressively consistent decreasing trend, which is not to be found with many countries, if at all. How come that Germany has succeeded in a short time span to reduce CO2:s? Germany needs massive amounts of energy for industry and transportation, but it has decided to phase out nuclear power. Can really the domestic employment of renewables satisfy this giant’s demand for electricity? German energy policy – ENERGIWENDE – is spectacular comparatively speaking, but it also appears risky indeed.It is true that nuclear power and renewables has made it possible for Germany to decrease its CO2:s much, but the country is still dependent upon fossil fuels, especially coal and oil – almost 60%. What will happen with the nuclear power stations are phased out in 2022 is that most likely the CO2 emissions will start going up again. To replace nuclear power with solar and wind power on a truly massive scale will be difficult to say the least. Already, Germany uses more coal from Columbia and gas from Russia.The German energy policy is causing much stir, because the losers – nuclear industry and coal power interests – want compensation that will run into billions of dollars, if not more. Can one really run a much advanced economy on mostly renewables?Interestingly, also France has like Germany managed decarbonisation to some extent (Figure 15). It reflects its unique energy mix, relying much upon nuclear power in a comparatively unique way.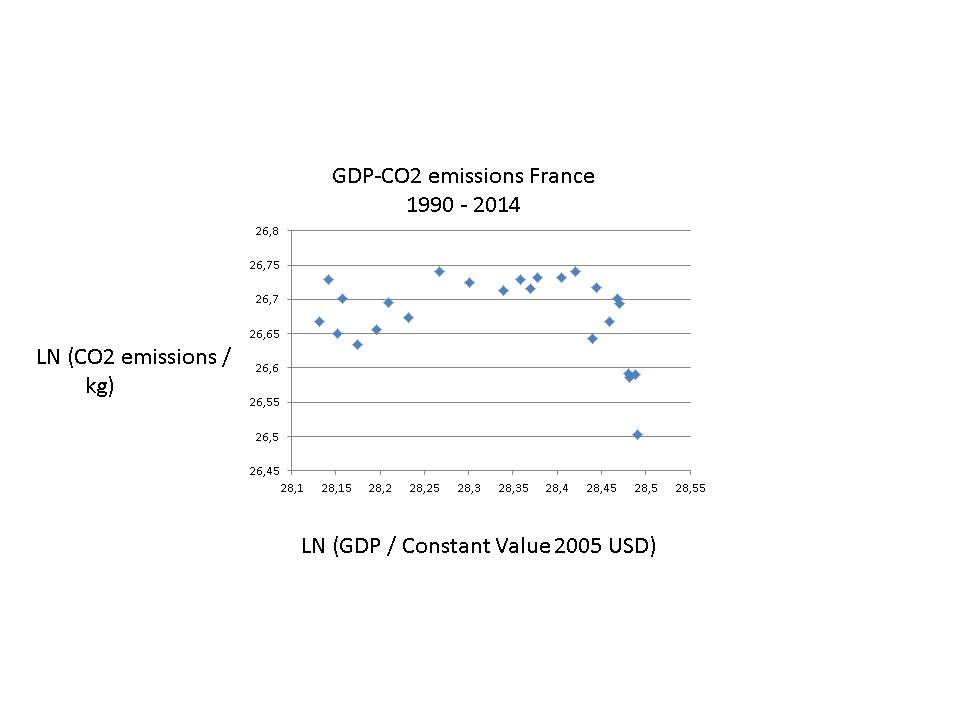 | Figure 15. France (y = -0,13x + 30,4; R² = 0,08) |
Yet, France has decided to diminish its reliance upon nuclear power. But how will it be replaced by other sources of energy? Figure 16 informs about the reliance upon fossil fuels in Germany and France too.  | Figure 16. Mixes of energy in France and Germany. Source: http://blog.iass-potsdam.de/2015/05/energy-transition-france-following-in-germanys-footsteps/ |
As underlined, no other country in the world employs nuclear power to such an extent (Figure 16), allowing France to avoid lots of CO2:s. But the Green movement’s criticism of nuclear power is based upon entirely different argument than the wish to decarbonise economy and society. Actually, doing both – decarbonisation and de-nuclearisation – may prove difficult for France. The French energy sector – EDF and AREVA – has suffered immensely from lower energy prices and scepticism about nuclear power, requiring massive state support.An entirely different trend is to be found in South Korea (Figure 17), which has 'caught up' in a stunning speed but with enormous GHG emissions.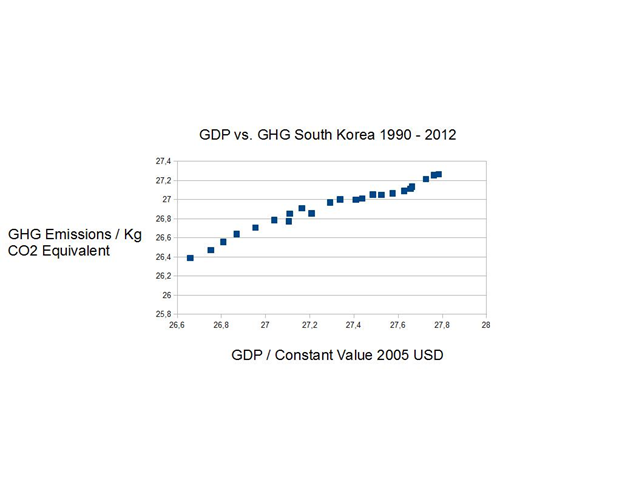 | Figure 17. SOUTH KOREA: LN (GHG / Kg CO2 eq and LN (GDP / Constant Value 2005 USD) |
Lacking much hydro power, South Korea has turned to fossil fuels for energy purposes, almost up to 90 per cent (Figure 18).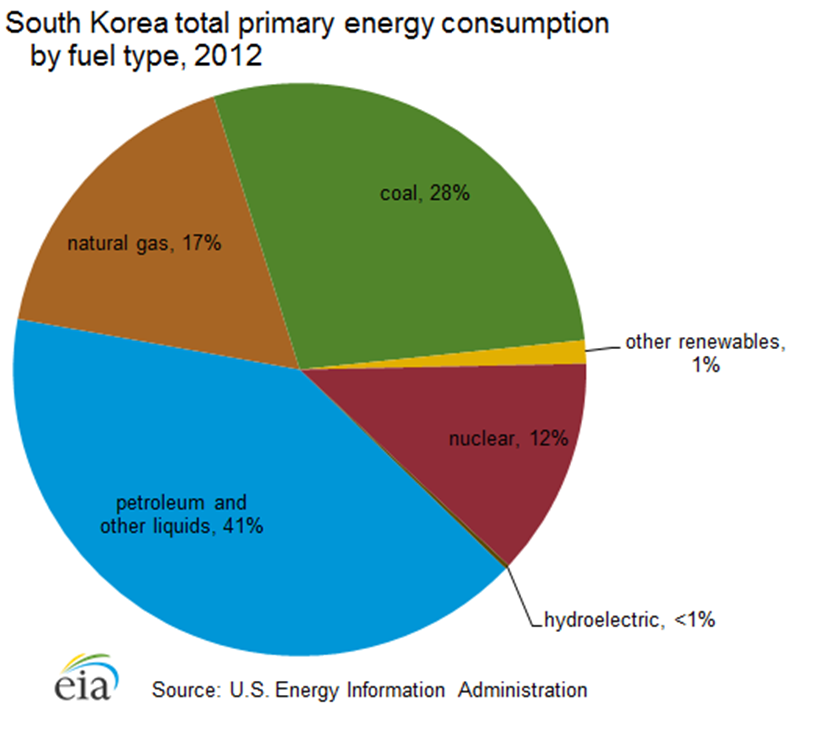 | Figure 18. Energy in South Korea |
It differs from China only in the reliance upon nuclear power, where the country is a world leader in plant constructions. Reducing its GHG emissions, South Korea will have to rely much more upon renewable energy sources, as well as reducing coal and oil for imported gas or LNGs.Summing Up: Mature capitalist economies appear to be able to reduce their CO2 emissions, while maintaining some level of economic growth. But the future is uncertain, as the example of advanced South Korea shows. These countries must fix their own policies in order to comply with COP21. If in trouble, these countries may renege.c) HEAVY POLLUTING COUNTRIES REEVANT FOR THE SUPER FUNDOne finds that the emissions of CO2:s follows economic development closely in many countries, like China, South Koreas and most Latin American countries. The basic explanation is population growth and GDP growth – more people breathing and searching for higher life style. Take the case of China, whose emissions are the largest in the world, totally speaking (Figure 19). Interestingly, China has begun a fundamental change of its energy policy in 2015, reacting to mostly domestic demands for cleaner air and environment.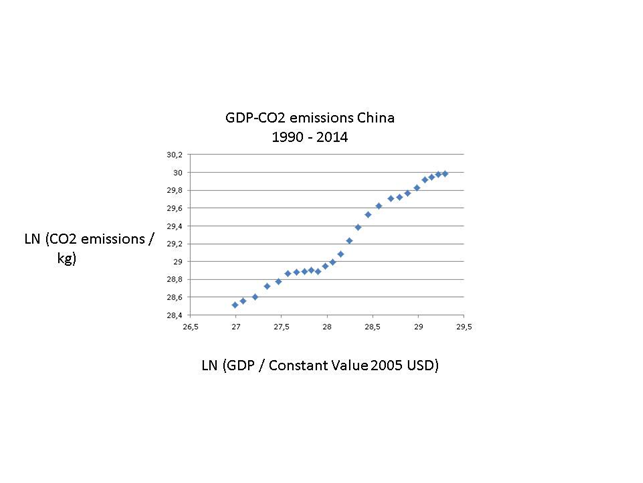 | Figure 19. CHINA: LN (CO2/ Kg and LN (GDP / Constant Value 2005 USD) (y = 0,7x; R² = 0,97) |
The sharp increase in CO2:s in China reflects not only the immensely rapid industrialization and urbanization of the last 30 years, but also its problematic energy mix (Figure 20), which is now up for overhaul.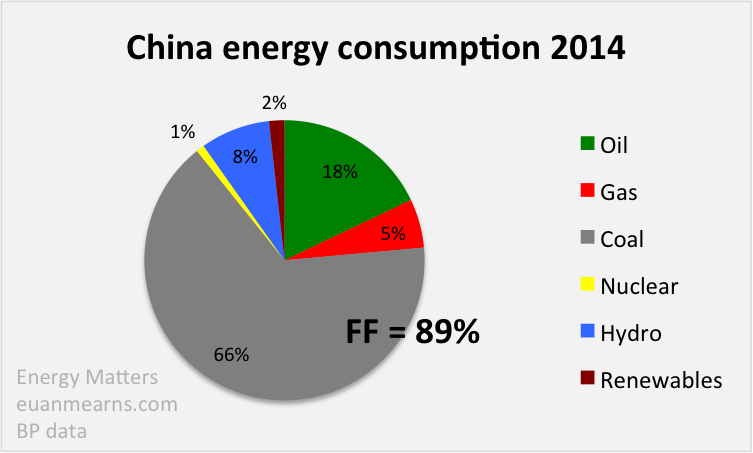 | Figure 20. China energy consumption 2014. Source: http://euanmearns.com/china-post-industrial-revolution/ |
Almost 70 per cent of the energy consumption comes from the burning of coal with an additional 20 per cent from other fossil fuels. The role of nuclear is very small indeed but about to change. Numerous solar power plants as well as wind plants are constructed, as old coal fired stations are phased out.Yet, this energy mix makes China very vulnerable and responsive to demands for radically cutting CO2 emissions: use other energy sources or install massively highly improved filters for carbon capture. It is true that China has turned to wind power, solar power and nuclear power on a huge scale recently, but the task of achieving a 40% reduction is enormous – GOAL II. China evidently hopes to respect its COP21 commitments while still enjoying an economic growth rate around 5%, but it is realistic? New coal plants have actually been opened recently, replacing out-dated old ones in order to propel growth.Decarbonisation n China will probably not achieve GOAL II, because CO2 emissions are increasing in the transportation sector with the car market becoming the biggest in the world and air transportation exploding. What is saved in one sector is dissipated in another.Several small countries have much higher emissions per capita than China, and also giant USA. This raises the enormously difficult problematic in COP21 management of fair cuts of emissions. Should the largest polluters per capita like the rich Gulf States cut most or the biggest aggregate polluters, like emerging economies China, India and Indonesia for instance? At COP21 negotiations in Paris, this issue about redistribution was resolved by the creation of a super fund to assist energy transition and environment protection in developing counties, as proposed early by economist Stern (2007).Let us here look at the ethanol country par preference: Brazil. Figure 21 shows a considerable levelling out of total emissions, but it is followed by huge increases, mirroring the GDP development.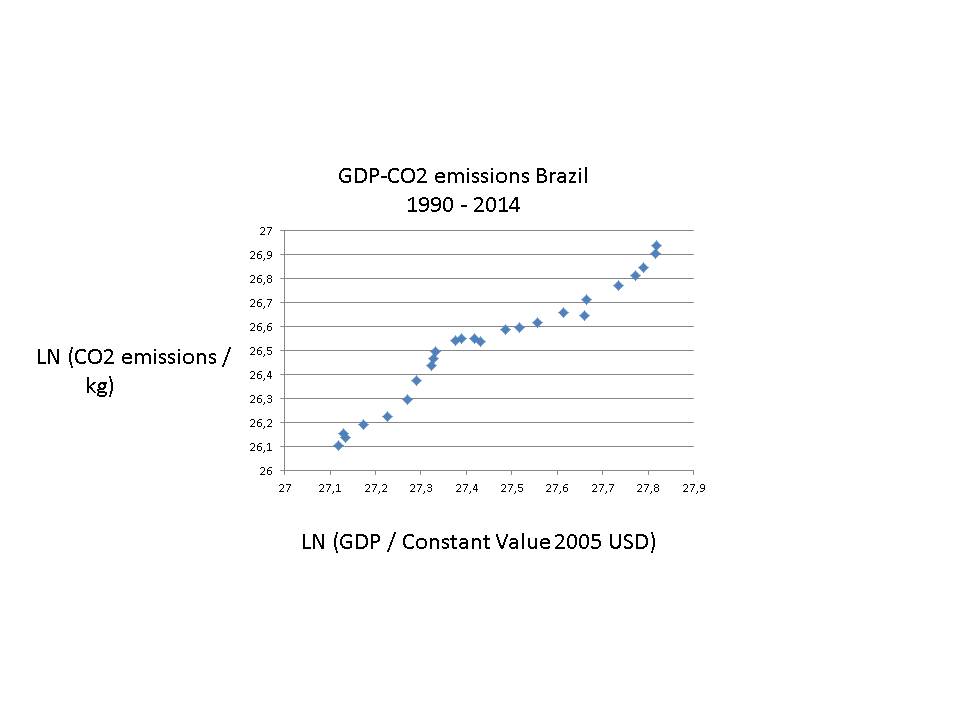 | Figure 21. BRAZIL: LN (CO2 / Kg and LN (GDP / Constant Value 2005 USD) (y = 1,029x - 1,72; R² = 0,95) |
Brazil employs the most biomass in the world - ethanol, but the emissions stay at a very high level, which is a reminder that even modern renewables may lead to CO2:s. One advantage for Brazil is its large component of hydro power, but the overall picture for the largest Latin American country is not wholly promising, when it comes to reduction of emissions. Will it accomplish GOAL I – maybe! But hardly GOAL II. Two caveats:- Global warming reduces the potential for hydro power – water scarcity, and Brazil has very little nuclear power (Figure 22). There are plans for mega hydro projects in the Amazon basin, but Brazil has first and foremost to come to terms with the extensive deforestation of this huge rain forest, contributing a lot to global warming. And other nations are involved here.- Biomass and waste only contribute to decarbonisation when there is a sequence of harvesting and build-up of new carbon consuming entities. When the rain forest is cut down once and for all, or poisonous waste burnt, then there is carbonisation. Ethanol fulfils decarbonisation.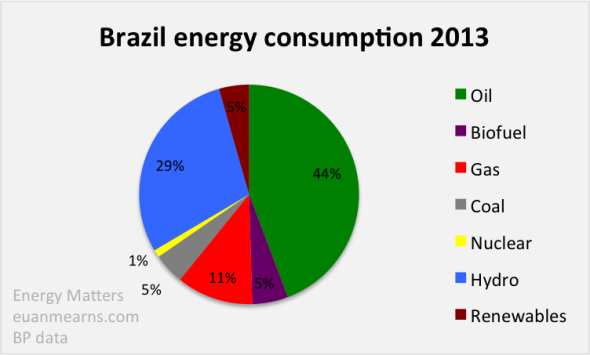 | Figure 22. Brazil energy consumption 2013 |
I believe most “emerging economies” will rely much upon fossil fuels, like the examples above. One finds no example of declining GDG-CO2(GHG) links in Latin American nations, nor in Africa or Asia, meaning that COP21 management will struggle to get GOAL I implement.India will certainly appeal to the same problematic, namely per capita or aggregate emissions. The country is even more negative than China to cut CO2 emissions, as it is in an earlier stage of industrialization and urbanization. Figure 23 shows the close connection between emissions and GDP for this giant nation.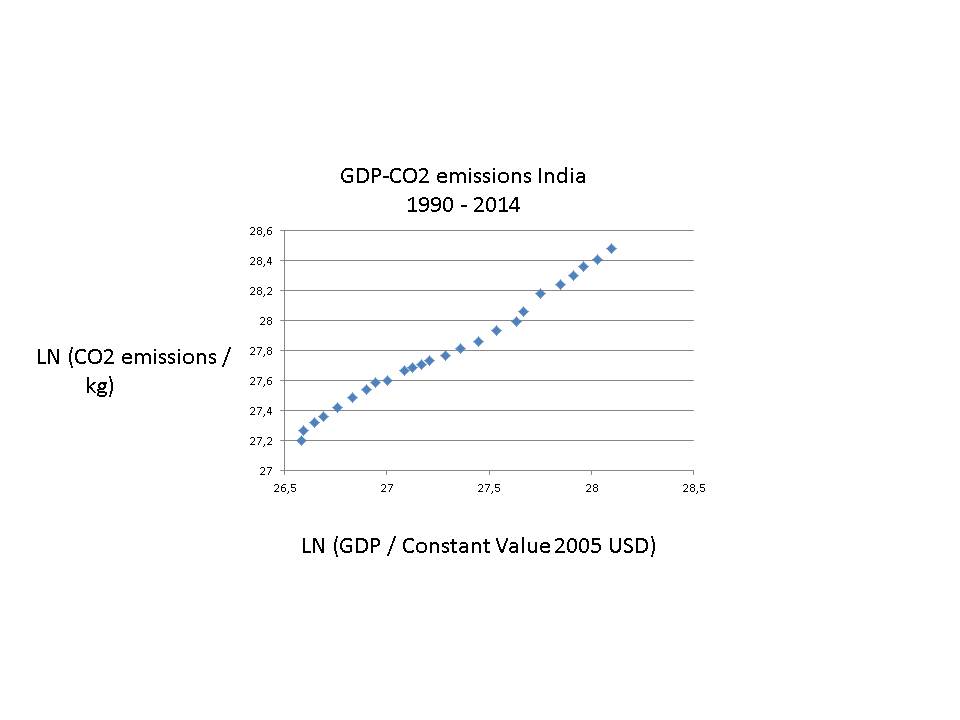 | Figure 23. INDIA: LN (CO2/ Kg and LN (GDP / Constant Value 2005 USD) (y = 0,77x + 6,79; R² = 0,99) |
India needs cheap energy for its industries, transportation and heating as well as air-conditioning, meaning it aims strongly at electrification. From where will this power come? India has water power and nuclear energy, but relies most upon coal, oil and gas as power source. It has strong ambitions for the future expansion of energy, but how is it to be generated, the world asks. India actually has small numbers for energy per capita, although it produces much energy totally. Figure 16 shows its energy mix where renewables play a bigger role than in China. However, the renewables in India may lead to deforestation and considerable pollution.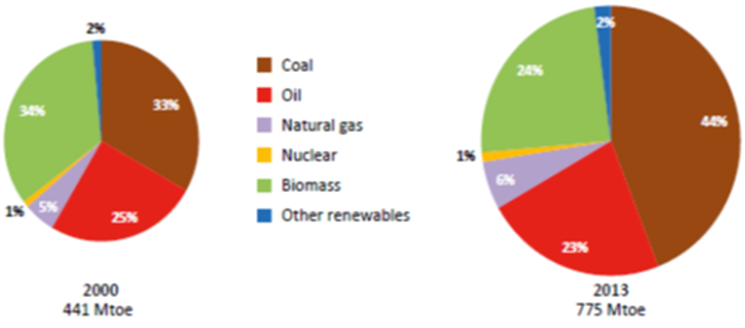 | Figure 24. Primary energy demand in India by fuel. Source: http://www.eia.gov/beta/international/analysis.cfm?iso=IND |
India needs especially electricity, as 300 million inhabitants lack access to it. The country is heavily dependent upon fossil fuels (70 per cent), although to a much less extent than China. Electricity can be generated by hydro power and nuclear power, both of which India employs. Yet, global warming reduces the capacity of hydro power – water shortages - and nuclear power meets with political resistance. Interestingly, India uses much biomass and waste for electricity production, which does not always reduce CO2 emissions. India’s energy policy will be closely watched by other governments and NGO:s after 2018. The constant tension between the demand for economic growth on the one hand and environmental protection on the other hand is sharply portrayed in Ramesh (2015).One may guess correctly that countries that try hard to “catch-up” will have increasing emissions. This was true of China and India. Let us look at three more examples, like e.g. giant Indonesia – now the fourth largest emitter of CO2:s in the world.Indonesia is a coming economic giant. Figure 25 reminds of the upward trend for China and India. However, matters are even worse for Indonesia, as the burning of the rain forest on Kalimantan augments the CO2 emissions very much. Figure 26 presents the energy mix for this huge country in terms of population and territory.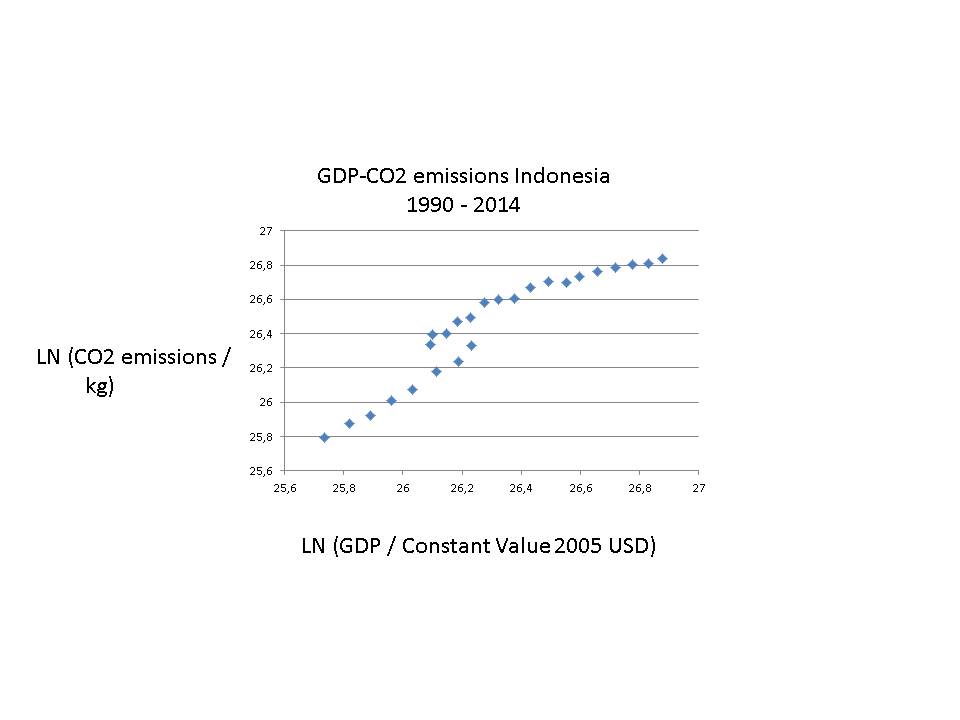 | Figure 25. INDONESIA: LN (CO2 / Kg and LN (GDP / Constant Value 2005 USD) (y = 1,69x; R² = 0,90) |
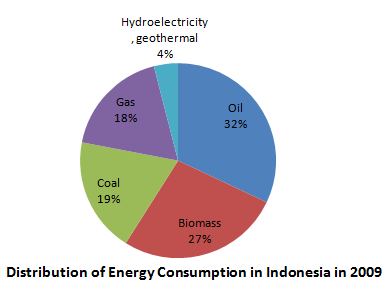 | Figure 26. INDONESIA’s energy mix. Source: (http://missrifka.com/energy-issue/recent-energy-status-in-indonesia.html) |
Only 4 per cent comes from hydro power with 70 per cent from fossil fuels and the remaining 27 per cent from biomass, which alas also pollutes, especially traditional renewables like charcoal and dung.Neither India nor Indonesia will reach GOAL I and GOAL II. They need huge financial support from the Super Fund, as they not only utilise carbon full energy but also burns down forests, adding to deforestation and desertification.The same upward trend holds for another major developing country with huge population, namely Pakistan (Figure 27).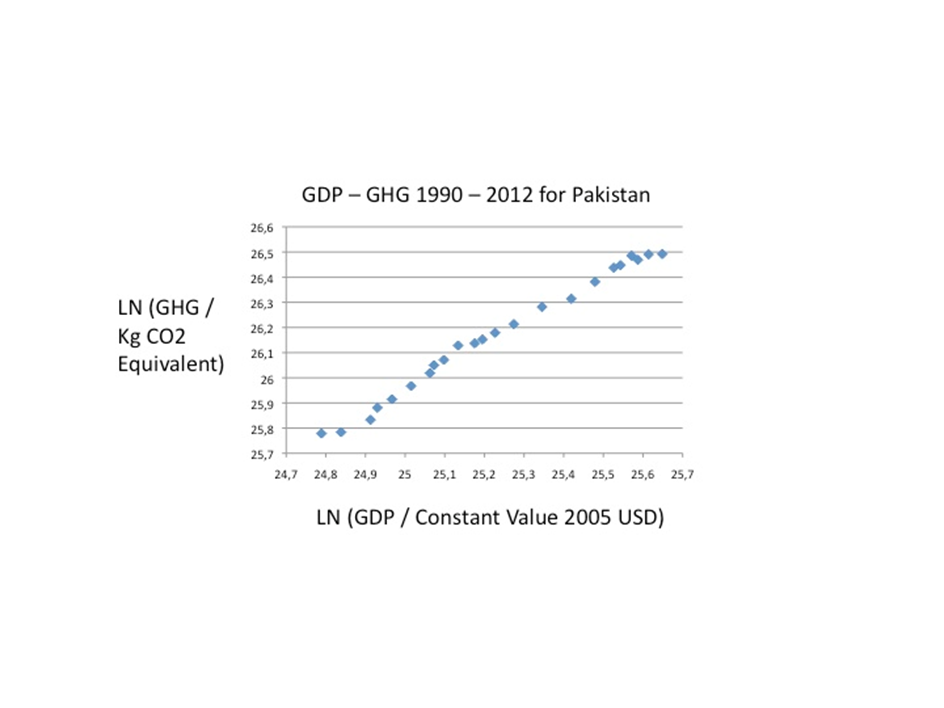 | Figure 27. PAKISTAN: LN (GHG / Kg CO2 eq and LN (GDP / Constant Value 2005 USD) |
The amount of GHG emissions is high for Pakistan, viewed as aggregate. Pakistan is mainly reliant upon fossil fuels (Figure 28).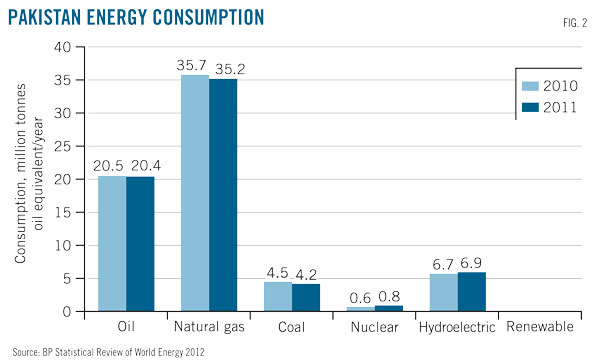 | Figure 28 |
But Pakistan employs a considerable portion of hydropower – 13 per cent – and a minor portion of nuclear power. Looking at South Africa in Figure 29, it is the same trend.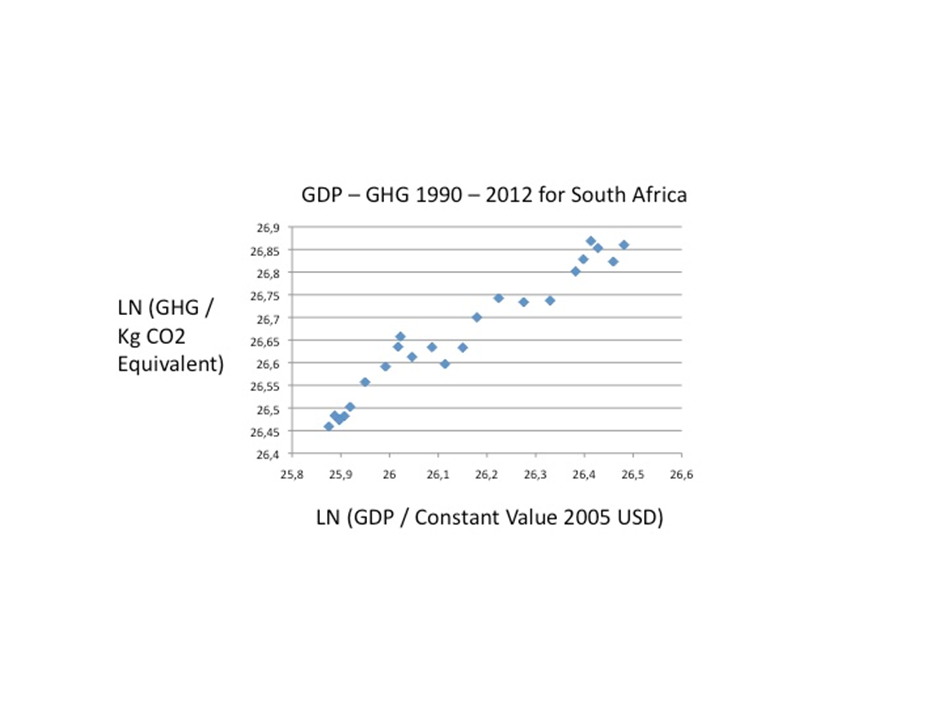 | Figure 29. SOUTH AFRICA: LN (GHG / Kg CO2 eq and LN (GDP / Constant Value 2005 USD) |
Emissions are high, because South Africa uses a lot of coal to generate electricity (Figure 29). Decarbonisation will be difficult and costly.The reliance upon coal in this large economy in Africa is stunningly high (Figure 30). No wonder that the RSA has started to look for shale oil and gas, | Figure 30. Total primary energy consumption in South Africa, 2013 |
One may guess correctly that countries that try hard to “catch-up” will have increasing emissions. This was true of China and India. Let us look at three more examples: Thailand, Malaysia and Iran – all emerging economies. Figure 31 begins with Thailand that has become a major car producer.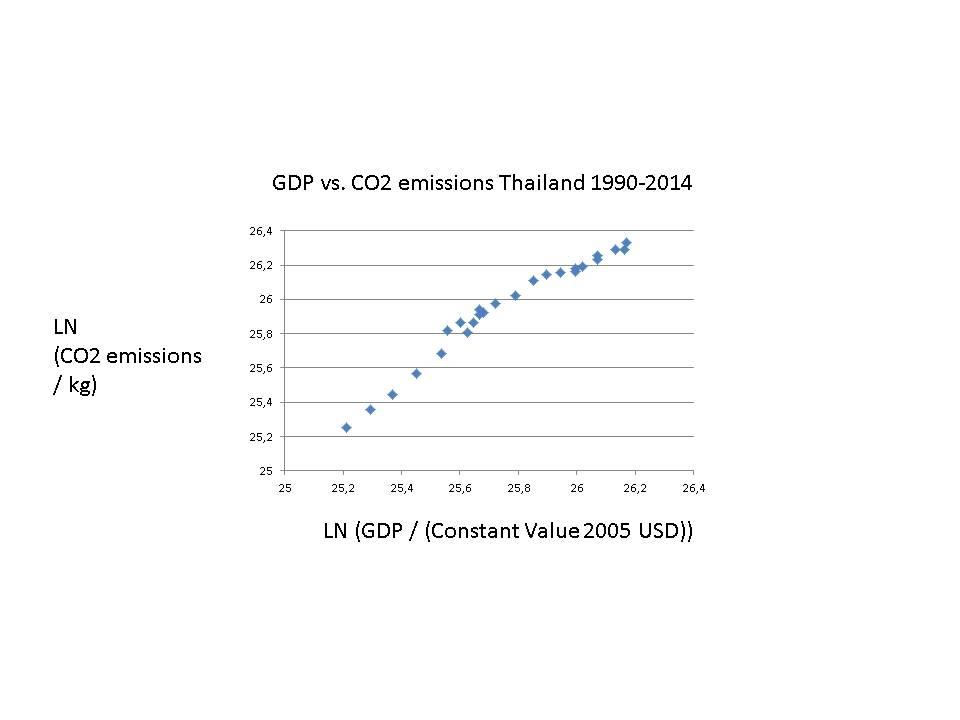 | Figure 31. Thailand (y = 1,07x, R² = 0,96) |
The CO2 emissions in Thailand are quite high, reflecting the economic advances in South East Asia. The trend is up and up. Can it be reversed without serious economic impact? Figure 32 shows the energy mix of this dynamic country, economically.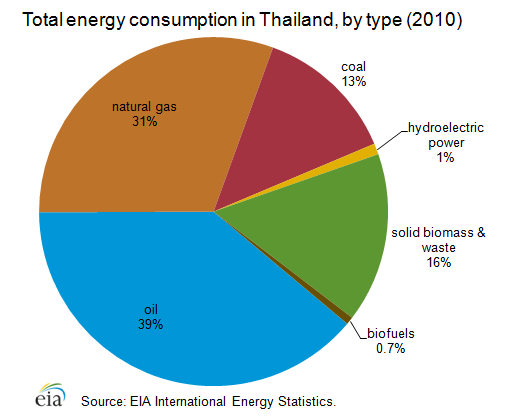 | Figure 32 |
The reliance upon fossil fuels is high, or over 80% of energy consumption coming from the burning of coal, oil and natural gas. Hydro power is marginal, but bio-energy plays a major role, but it is really not carbon neutral. Thailand needs to come up with far-reaching reforms of its energy sector in order to comply with COP21 objectives.MalaysiaThe overall situation – fossil fuels dependency – is the same for Malaysia as for Thailand. And the CO2:s are high, following the GDP trend (Figure 33).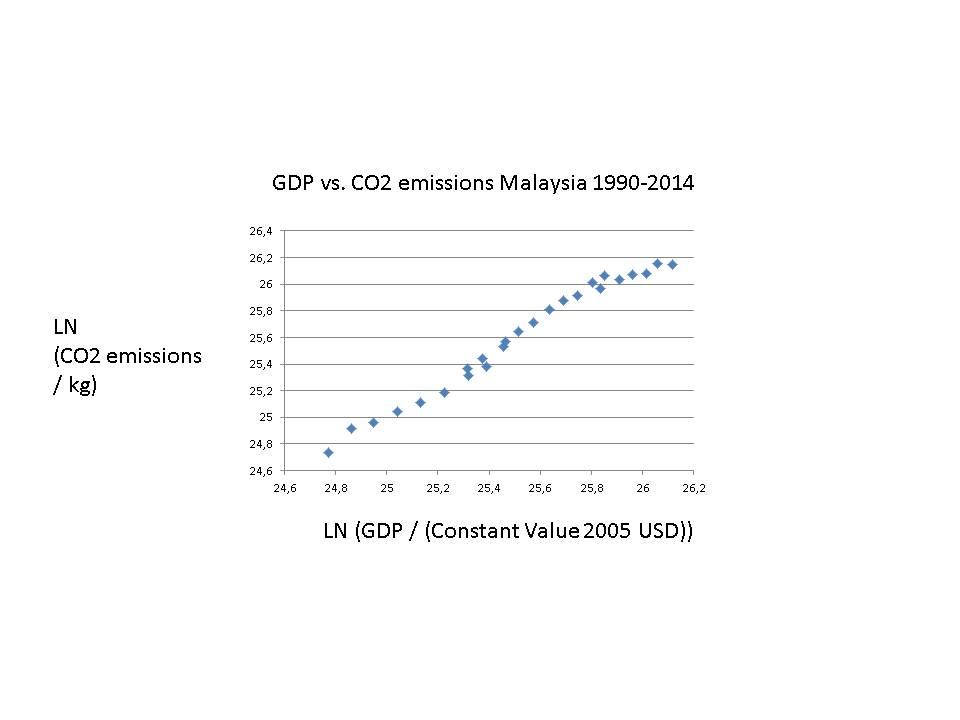 | Figure 33. Malaysia (y = 1,13x; R² = 0,98) |
Yet, Malaysia employs energy of a very mixed bag (Figure 34), but still its emissions augment in line with economic development. There may be a planning out of the growth trend in emissions recently, but Malaysia use very little of carbon neutral energy sources. There is hydro power, but the country must move to solar and wind power rapidly.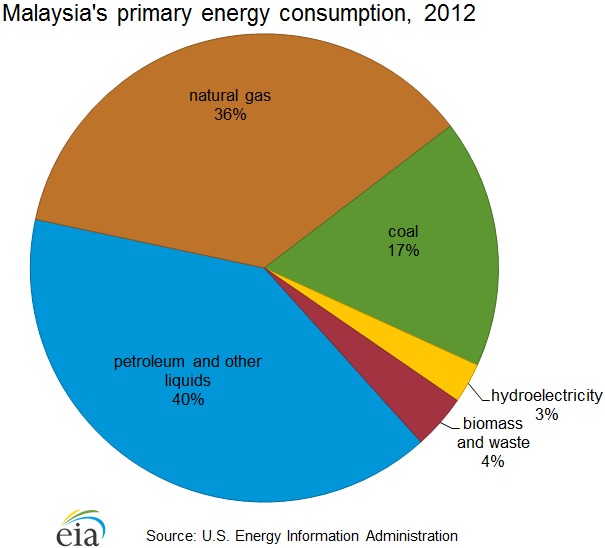 | Figure 34. Energy mix for Malaysia |
Renewables are not a major element in the energy consumption mix of Malaysia, as fossil fuels dominate, but not coal luckily. Summing Up: Here we have a set f large countries that would benefit tremendously from the Super Fund, offering financial help and transferring latest available technologies for renewable energy sources.d) PETROL AND GAS COUNTRIESCountries may rely upon petroleum and gas mainly – see Iran (Figures 35 and 36). CO2 emissions have generally followed economic development in this giant country, although there seems to be a planning out phase recently, perhaps due to the international sanctions against its economy.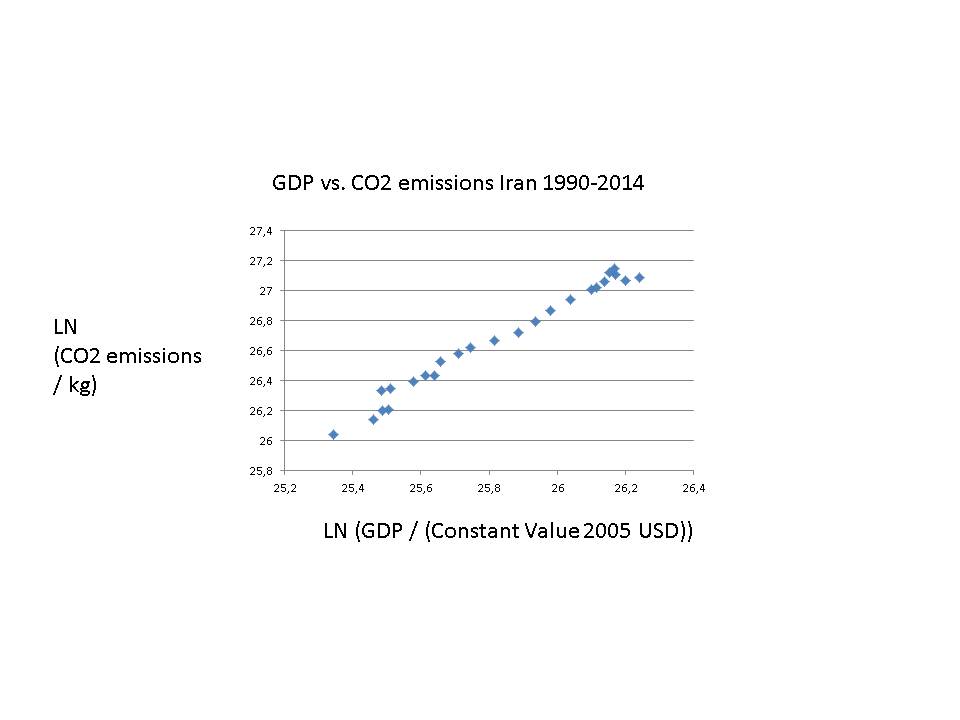 | Figure 35. Iran (y = 1,2229x - 4,91; R² = 0,98) |
Iran is together with Russia and Qatar the largest owner of natural gas deposits in the world. But despite using coal in very small amounts, its CO2 emissions are high. Natural gas pollute less than oil and coal, but if released unburned it is very dangerous as a greenhouse gas.Methane is better than oil, which is better than coal, from the point of view of decarbonisation. But when a nation burns a lot of it, like Qatar, then CO2 emissions skyrocket just the same.When countries are exclusively dependent upon either natural gas or petroleum, they are not likely to accomplish GOAL I or GOAL II. Iran could try other energy sources (Figure 36) – solar, atomic – but the first resource is costly and the second resource has proved very controversial from the point of view of international relations.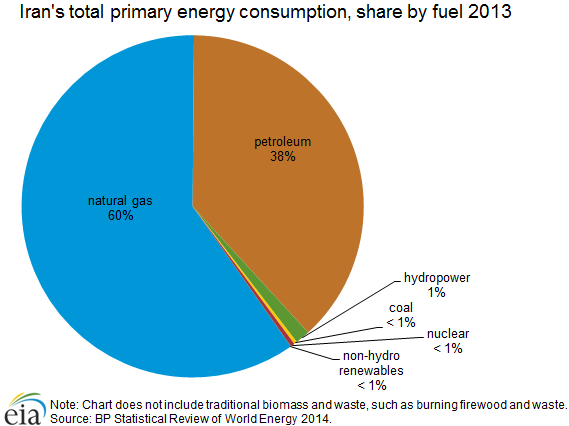 | Figure 36. Energy in Iran |
One would expect to find huge CO2 emissions in this large emerging economy with lots of oil production. Countries like the Gulf States have massive CO2:s because they drill and refine oil and natural gas. For Mexico holds the following situation (Figure 37).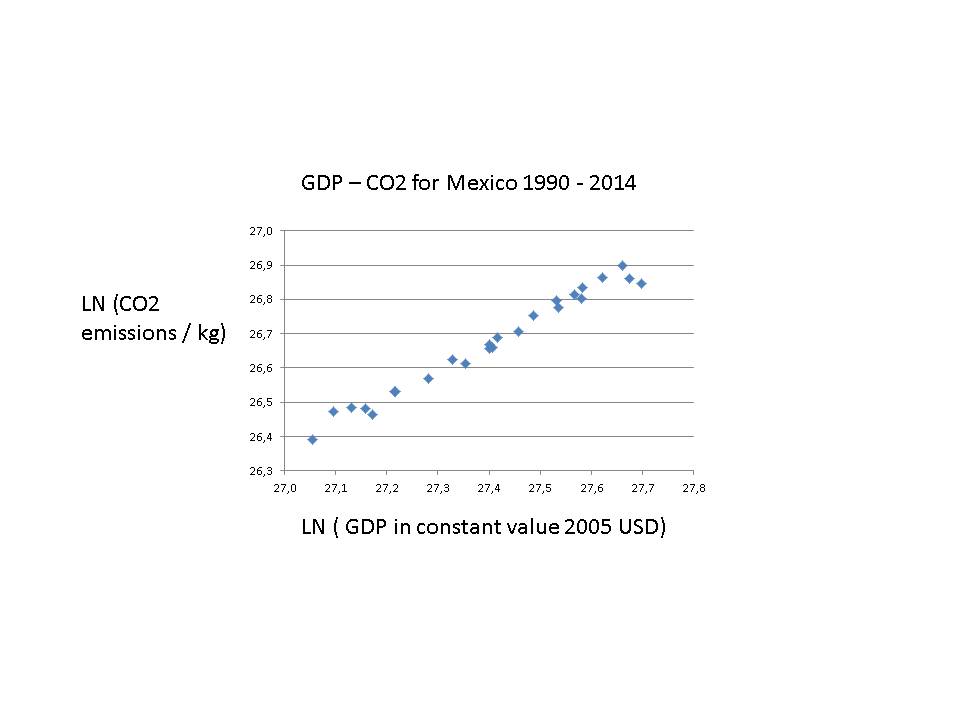 | Figure 37. GDP-CO2 in Mexico: y = 0,77x; R² = 0,98 |
The close link between economic development and CO2 is discernable in the data, but the emissions' growth seems to stagnate in the last years. This is of course a promising sign, whether it is the start of a COP21 inspired 40% reduction in CO2:s remains to be seen. I doubt so, but let us enquire into the energy mix of this huge country that is of enormous economic importance to both North and South America.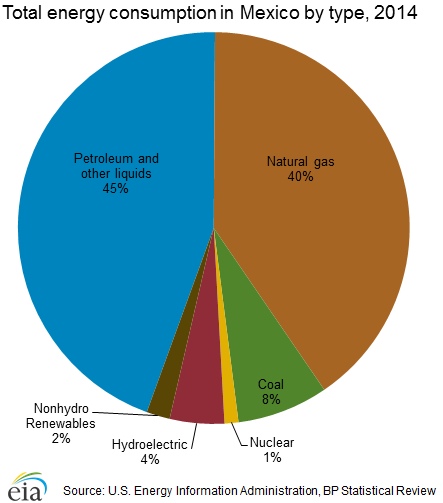 | Figure 38. Energy mix for Mexico |
Few countries are so dependent upon fossil fuels as Mexico. One find the same pattern with the Gulf States. The Mexican government must start now to reduce this dependency, by for instance eliminating coal and bringing down petroleum and natural gas, instead betting upon solar, wind and nuclear power. Mexico will face severe difficulties with the 40% reduction target in COP21 – GOAL II. It has a fast growing population with many in poverty and an expanding industry sucking electricity. Can economic growth and decarbonisation go together here? GOAL I is hardly achievable here.Consider now another GREEN state, the United Arab Emirates (Figure 39).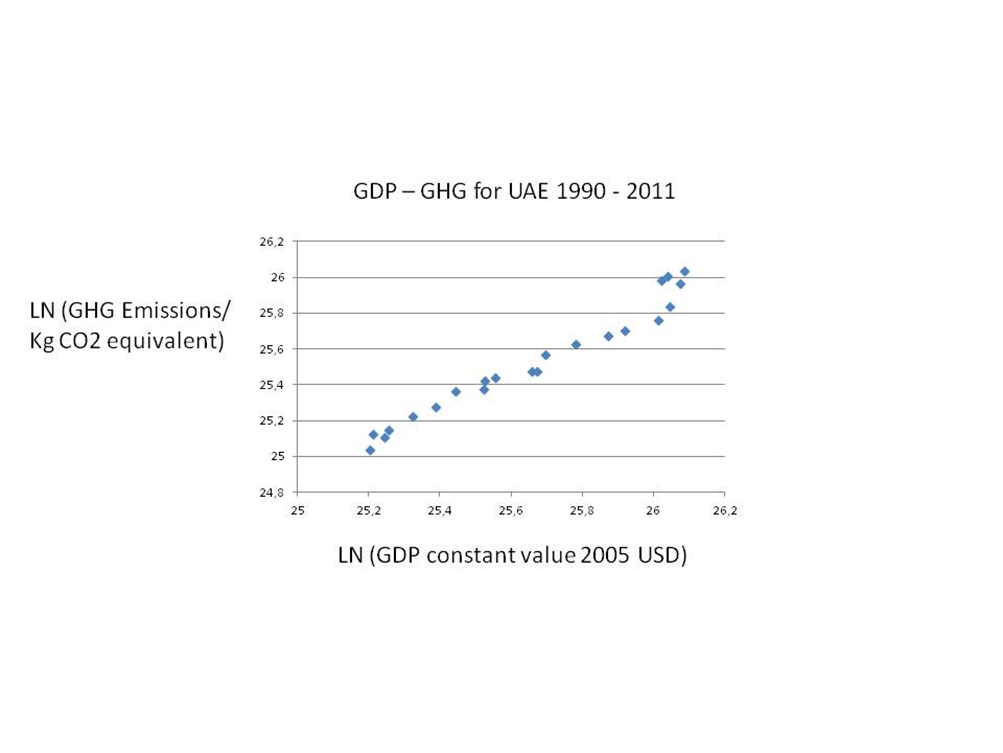 | Figure 39. UNITED ARAB EMIRATES: LN (GHG / Kg CO2 eq and LN (GDP / Constant Value 2005 USD) |
The UAE have increased their emission of GHG sharply in relation the positive economic development of these emirates. They rely upon the fossil fuels of Abu Dhabi with immense oil resources. Like other Gulf States, the UAE boosts with building entirely GREEN sites, with energy from solar power and almost no waste. But it is based upon their enormous consumption of electricity generated out of burning oil and gas (Figure 40). The Gulf countries use lots of petrol, gas and electricity to uphold a stunningly high standard of living, which also results in extremely high levels of emissions per capita.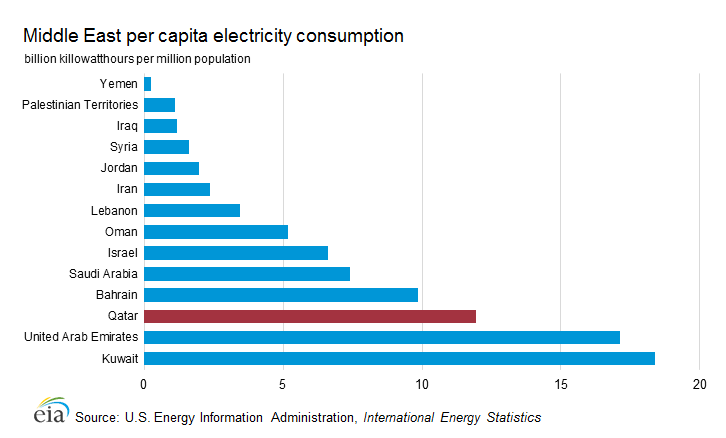 | Figure 40. Electricity consumption in the Middle East |
The standard image must be that of a close link between GDP and emissions, like for the so-called super rich GREEN states. Summing Up: The oil and gas producing countries rely almost exclusively on their natural energy sources, resulting in huge emissions, at least per capita with small countries. They must change, but should the Super Fund assist? They have own incentives t make the transformation in order to comply with Goal I and Goal II. And some of them can afford it.e) WEAK COUNTRIES IN NEED OF THE SUPER FUNDMoving on to another giant nation in South Asia, Bangladesh, we find an entirely different set of conditions for implementing COP21. Figure 41 shows that the major GHC of CO2:s follows economic development closely.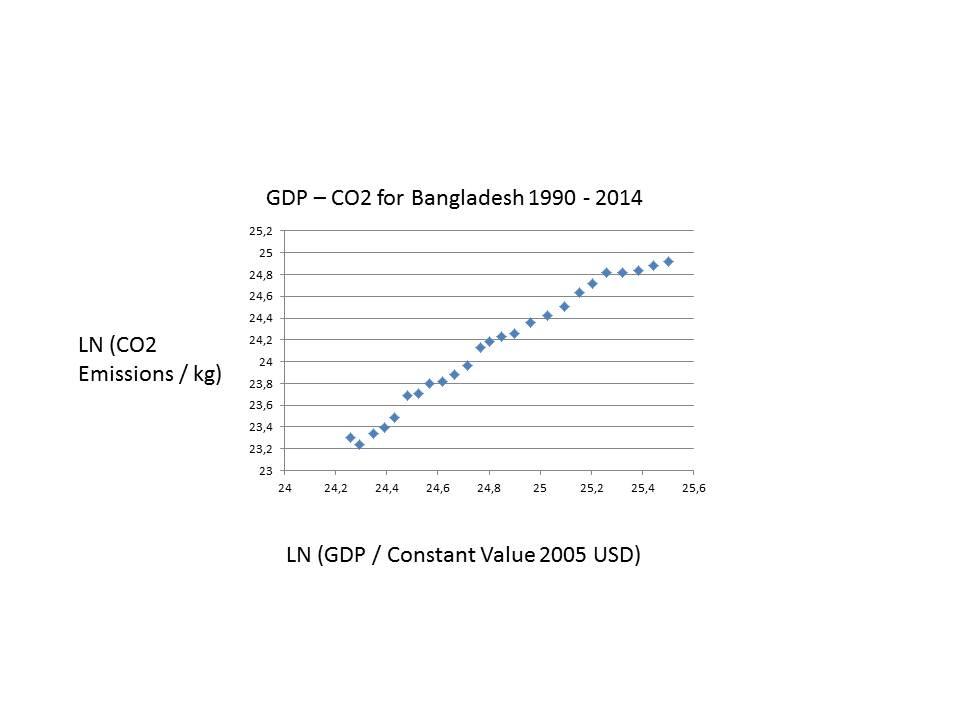 | Figure 41. Bangladesh (y = 1,43x, R² = 0,98) |
Yet energy consumption is based on a different energy mix, compared with India. Figure 42 pins down the large role of traditional renewables like wood, charcoal and dung as well as the heavy contribution of oil and gas. Bangladesh needs external support for developing modern renewables, like solar, wind and geo-thermal power sources.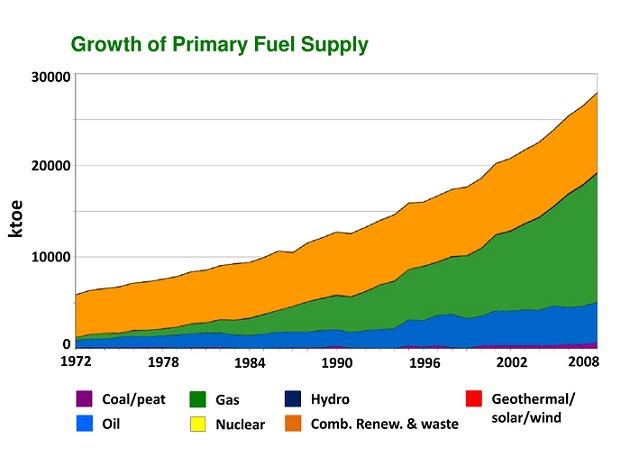 | Figure 42. Bangladesh. Source: Energy Scenario in Bangladesh from 1972-2008 (Orange: Biomass, Green: Gas, Blue: Oil) |
When examining small but populous Sri Lanka, one sees again the strong connection between GDP and CO2:s – see Figure 43. It seems that the CO2:s was halted in their expansion for some time, but now they increase again. | Figure 43. Sri Lanka (y = 1,03x, R² = 0,84) |
In this island state, the dominant energy source is traditional renewables, which leads to deforestation and CO2 emissions on a large scale (Figure 44). It has been argued that the forest will grow up again, eating the carbon emissions. But it is mainly wishful thinking, as climate change and draughts make forest rehabilitation difficult.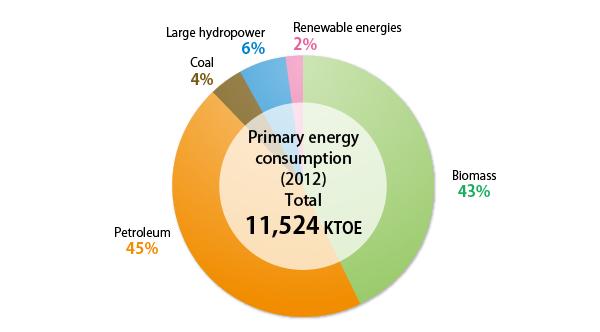 | Figure 44. Sri Lanka energy mix. Source: Primary energy consumption in Sri Lanka (2012);http://www.info.energy.gov.lk/ |
A general tenet in the climate change debate is that renewables should be preferred over non-renewables. Yet, this statement must be strictly modified, as there are two fundamentally different renewables:- Traditional renewables: wood, charcoal and dung. They are not carbon neutral. On the contrary, employing these renewables results in severe pollution, not only outside but also inside a household;- New renewables: solar, wind, geo-thermal and wave energy that are indeed carbon neutral, at least at the stage of functioning.In the poor African countries with about half the population in agriculture and small villages, traditional renewables constitute the major source of energy.One notes how little of hydro power has been turned into electricity in Kongo, but economic development and political instability, civil war and anarchy do not go together normally. At the same, one may argue that an extensive build-up of hydro power stations would pose a severe challenge to the fragile environment in the centre of Africa. Kongo can now move directly to modern renewables like solar power.This enormous reliance upon traditional renewables is to be found also in Angola and Nigeria, although both have access to both hydro power and fossil fuels. Figure 43 describes the energy mix for Angola.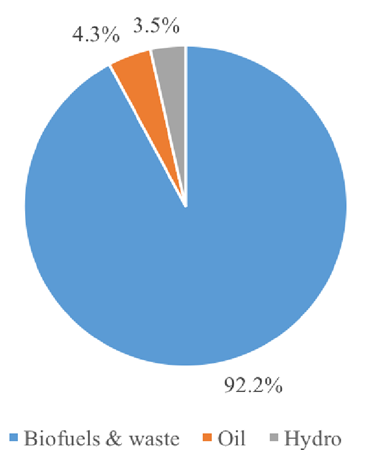 | Figure 45. DR KONGO. Source: Democratic Republic of Congo - Energy Outlook, Kungliga Tekniska Hoegskolan |
 | Figure 46. Angola |
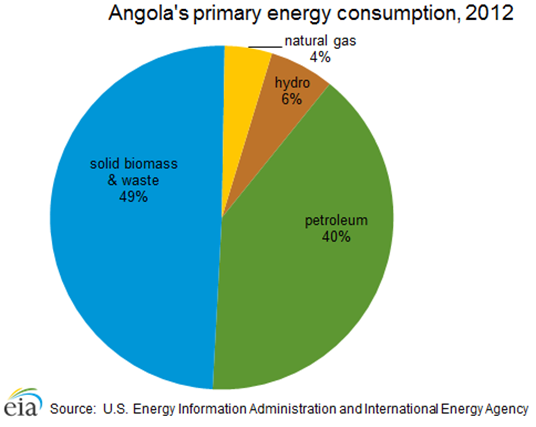
Angola like Kongo has suffered from long and terrible civil war. In the mass of poor villages, energy comes from wood, charcoal and dung – all with negative environmental consequences. Angola has immense fossil fuels – oil and gas, but the political elite family may prefer to export these resources instead of using them for electricity generation. Giant Nigeria has a resembling energy mix – see Figure 47.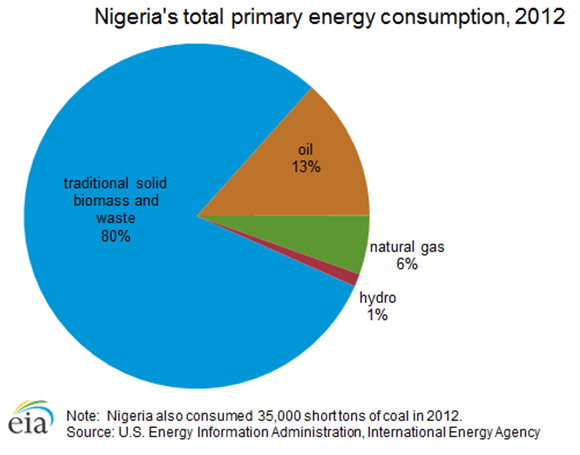 | Figure 47. Nigeria |
Nigeria would have to diminish the use of traditional renewables in order to meet the COP21 goals. The very same policy recommendation applies to two countries in the Nile valley, namely Sudan and Ethiopia – extremely poor countries relying mainly upon traditional renewables.Surely, both Ethiopia and Sudan would want to utilise the great Nile river for their electricity consumption. However, Egypt wants to have a SAY over the energy planning of these two countries up the river. Thus, far many rounds of negotiations have resulted in the construction of only a few power plants, a few in Sudan (Merowe Dam, etc) and one another huge in Ethiopia – Grand Etiopian Renaissance Dam. The problem is the common pool of the Nile, where one country, Egypt, may find that the water level has shrunk too much for its own needs, electricity or irrigation. Actually, the risk of draughts is a real one for all countries trying to exploit the Nile. Sudan is dismally poor with deep-seated internal conflicts ethnically. How to move to large solar panel plats in a country with so much political instability resulting huge numbers of death from domestic violence? The reliance upon traditional renewables is so high in neighbouring Ethiopia that electrification must be very difficult to accomplish over the large land area. Figure 48 displays a unique predicament.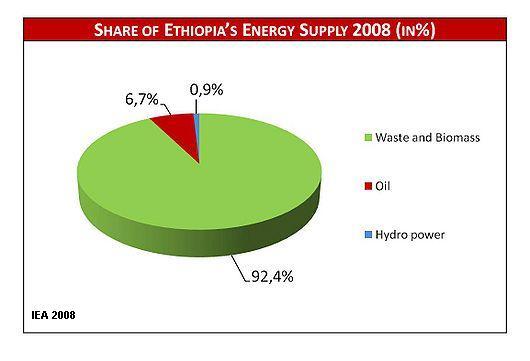 | Figure 48. ETHIOPIA: Energy mix |
Is there any advantage with such a skewed energy mix? No, because even mainly rural Ethiopia works with lots of CO2: - see Figure 49.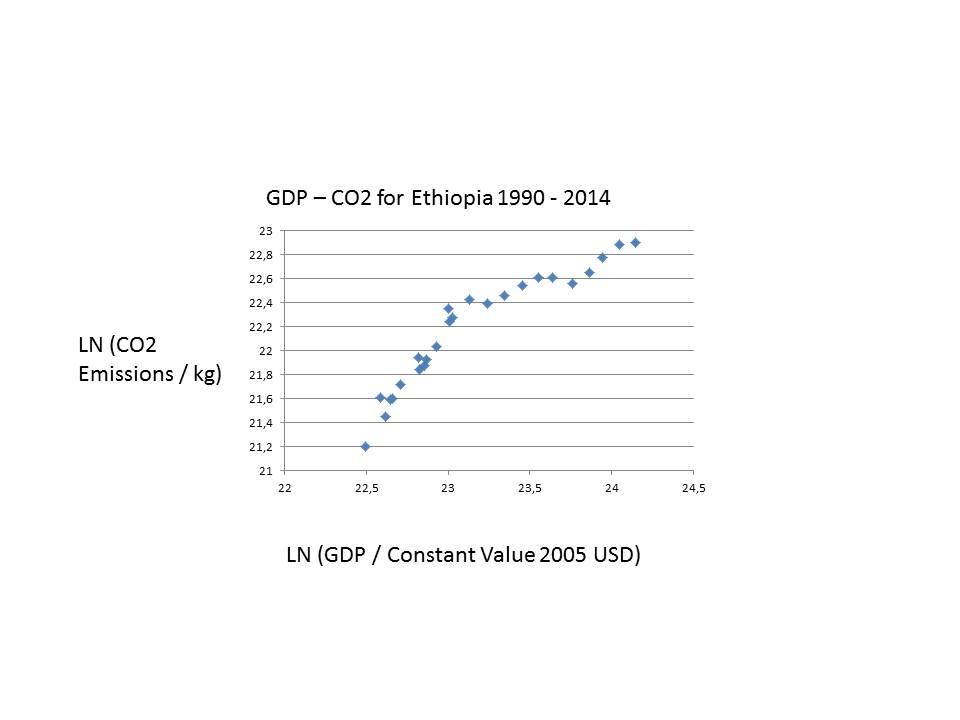 | Figure 49. Ethiopia: GDP and CO2: y = 0,90x, R² = 0,88 |
The zest with which Ethiopia is pursuing its control over water resources becomes fully understandable, when Figure 49 is consulted. What we see is the same smooth linear function plotting CO2:s upon GDP, as is obvious in countries based upon fossil fuels – see below. For Ethiopia, to comply with COP21 goals is point to pose major challenges, especially if economic development is not going to be reduced. The country needs massive help, both financially and technologically.Summing Up: Poor nations do not have huge GHG:s, but they definitely cannot meet their obligations under the COP21 project without massive assistance.
4. COP21 MANAGEMENT: Logical or Illogical?
There are signs that COP21 management is under way, both nationally and intentionally. Some governments declare that they have already or will soon reach the GOAL I, sometime correct but sometimes just make belief. Other governments can do nothing, because they do not rule states. Typical is verbal commitment to decarbonisation at the same time as the requirement of economic developments trump environmental exigencies. Just consider the expansion of the transportation sector! Moe and more air traffic is planned for. And also electricity cars have to have their energy from some power source for electricity. On the international scene, meetings continue under the auspices of the UN and a French led secretariat. COP21 management is confronted by two major difficulties, namely to undo the typical link between GDP and energy on the one hand and GDP and GHG emissions on the other hand. Otherwise, none of the chief objectives – COAL I, GOAL II and GOAL III – can be met. From what is known and experienced, these links can be undone in single micro projects, but not on the macro level, at least not on a scale required to narrow down climate change.
5. Conclusions: The Super Fund
The Third World is heavily into the use of fossil fuels. They can only change that when provided financial assistance. Here is where the super fund comes, It has been mentioned the phenomenal sum of 100 billion dollars/year. But no binding decisions have been takes about its structure and operations. What it entails is that rich countries pay for the decarbonisation of the poor countries. This fund would help COP21 management, but it may also create its own difficult problematic to handle. At this point of tine, there are many unknowns in the conditions for COP21 management: the fund, the use of plan or market means, carbon trading schemes, carbon taxation schemes, oversight techniques and correction mechanisms.The findings in this paper show that few countries are today able to fulfil GALI in the COP21 as well as that none would achieve Goal II without great changes. The COP21 has to urgently clarify the incentive mechanisms in this giant global management project, informing about the financing of the Super Fund as well as the eligibility for support from the Fund. This is all the more urgent as the stylised projections for energy in the future speak of massive increases, especially in Asia. This augmentation of energy resources must come from renewables of atomic power, but these projections by the EIA, the IEA and the BP World Outlook tell another story, where fossil fuels dominate also this century. Take a look at one of these predictions (Figure 50) about energy demand just to see that they are not in conformity with the COP21 framework and its Goal II.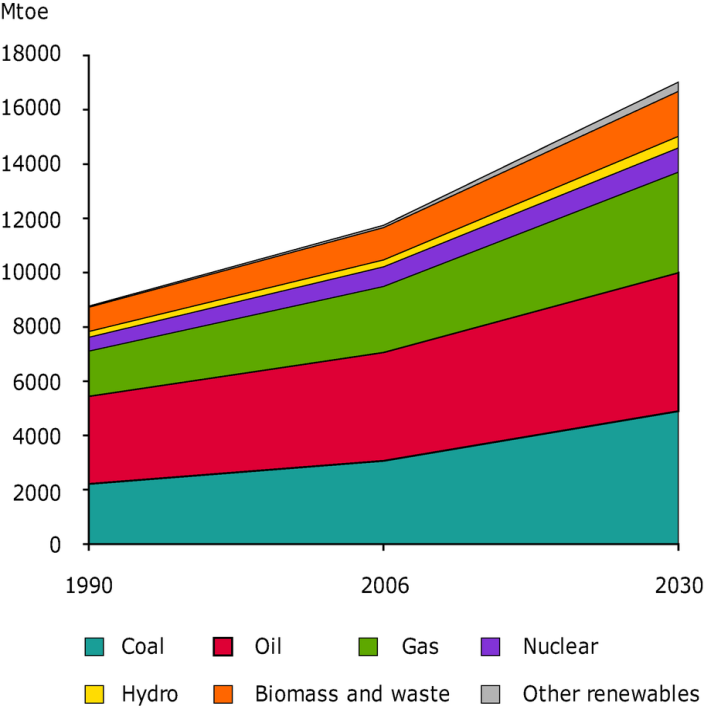 | Figure 50. Energy growth up to 2030. Source: http://www.eea.europa.eu/data-and-maps/figures/global-total-primary-energy-consumption-by-fuel-1 |
References
| [1] | World Bank national accounts data - data.worldbank.org. |
| [2] | OECD National Accounts data files. |
| [3] | World Resources Institute CAIT Climate Data Explorer - cait.wri.org. |
| [4] | EU Joint Research Centre Emission Database for Global Atmospheric. |
| [5] | Research - http://edgar.jrc.ec.europa.eu/overview.php. |
| [6] | UN Framework Convention on Climate Change - http://unfccc.int/ghg_data/ghg_data_unfccc/time_series_annex_i/items/3814.php. |
| [7] | International Energy Agency. Paris. |
| [8] | Energy Information Administration. Washington, DC. |
| [9] | BP Energy Outlook 2016. |
| [10] | Sachs, J. (August 10th, 2015) “Sustainable Development for Humanity’s Future” (http://jeffsachs.org/2015/08/sustainable-development-for-humanitys-future/). |
| [11] | Stern, N. (2007) The Economics of Climate Change. Oxford: OUP. |
| [12] | Pressman, J. and A. Wildavsky (1973, 1984) Implementation. Berkeley: University of Cal Press. |
| [13] | Wildavsky, A. (1987) Speaking Truth to Power. Piscataway: Transaction. |
| [14] | Ramesh, J. (2015) Green Signals: Ecology, Growth and Democracy in India (2015). Oxford: Oxford University Press. |
| [15] | de Bruyn, S.M. (2012) Economic Growth and the Environment: An Empirical Analysis. Berlin: Springer. |
| [16] | Eriksson, C. (2013) Economic Growth and the Environment: An Introduction to the Theory. Oxford: OUP. |
| [17] | Lomborg, B. (2007) Cool It. The Sceptical Environmentalist’s Guide to Climate Change. New York: Alfred Knopf. |
| [18] | Mazmanian, D.A. and P. A. Sabatier (1989) Implementation and Public Policy. Lanham, MD: UPA. |
| [19] | Managi, S. (2015) The Routledge Handbook of Environmental Economics in Asia. London: Routledge. |
| [20] | March, J. and J. P- Olsen (1976) Ambiguity and Choice. Oslo: Universitetsforlaget, Pressman, J. and A. Wildavsky (1973, 1984) Implementation. Berkeley: University of California Press. |
| [21] | Ramesh, J. (2015) Green Signals: Ecology, Growth and Democracy in India. Oxford: Oxford U.P. |
| [22] | Sabatier, P.A. (1988) “An advocacy coalition framework of policy change and the role of policy-oriented learning therein”, in Policy Sciences, Volume 21: 129-168. |
| [23] | Sachs, J. (August 10th, 2015) “Sustainable Development for Humanity’s Future” (http://jeffsachs.org/2015/08/sustainable-development-for-humanitys-future/). |
| [24] | Sachs, J.D. (2015) The Age of Sustainable Development. New York: Columbia University Press. |
| [25] | Simon, J.L. (2003) A Life Against the Grain. Piscataway: Transaction Publishers. |
| [26] | Stern, N. (2007) The Economics of Climate Change. Oxford: OUP. |
| [27] | Wildavsky, A. (1979, 1987) Speaking Truth to Power. Piscataway: Transaction Publishers. |
| [28] | Wildavsky, A. (1997) But Is It Really True ? Cambridge, MA : Harvard U.P. |
| [29] | Williamson, O. (1973) Hierarchies and Markets. New York : Free Press. |
| [30] | Kaya, Y. and Yokoburi, K. (1997) Environment, energy, and economy: strategies for sustainability. Tokyo: United Nations University Press. |

 Abstract
 Reference
 Full-Text PDF
 Full-text HTML