Eguaroje O. E.1, Alaga T. A.2, Ogbole J. O.2, Omolere S.2, Alwadood J.2, Kolawole I. S.2, Muibi K. H.2, Nnaemeka D.2, Popoola D. S.2, Samson S. A.2, Adewoyin J. E.2, Jesuleye I.2, Badru R. A.2, Atijosan A.2, Ajileye O. O.2
1National Centre for Remote Sensing, Jos, Nigeria
2Cooperative Information Network, National Space Research and Development Agency, Obafemi Awolowo University, Ile-Ife, Nigeria
Correspondence to: Eguaroje O. E., National Centre for Remote Sensing, Jos, Nigeria.
| Email: |  |
Copyright © 2015 Scientific & Academic Publishing. All Rights Reserved.
Abstract
Floods in Nigeria have done more harm without any notice of benefits. In the last 30 years, Nigerian cities have experienced great physical development, in terms of building, manufacturing industries and others without any appreciable infrastructures such as drainages, roads and canals to support them. These have made floods to be a very serious challenge that plague many Nigerian cities. Thus, this research investigates the causes and effect of flood in Ibadan, Oyo state Nigeria and proffer solution to avert the feature occurrences of flood in the area. The result of the research will expose Nigerian government to the strategies of mitigating any occurrence of flood, as well as enlightening the public on how to guide against the occurrence of flood. This research work covers the eleven local governments in Ibadan. Geographical Information System and Remote Sensing techniques were adopted in this work and they are in two phases in order to arrive at a flood vulnerability map. The factors responsible for the flooding were first determined and secondly, multi criteria evaluation (MCE) was carried out in a GIS environment. In the MCE, Weighted Linear Combination (WLC) approach which involves the ranking of each contributing factor was used. The datasets for this work are those whose spatial references can be determined. These datasets are satellite images (Both high and medium resolution), topographic maps, soil map and meteorological data. Different maps were generated, drainage map of the study area, mean annual rainfall map, soil map, landuse map, and flood vulnerability model map and also bar chart showing the level of flood vulnerability was generated. Seven contributing factors were examined. These include mean annual rainfall, slope, soil types, and relief, land use, drainage order level and drainage density. The impact of each of the above contributing factors was examined by introducing them one after the other in the model. The result shows a false representation of the observable pattern in reality when all other contributing factors participated in the model without mean annual rainfall and relief. After the introduction of mean annual rainfall and relief to the model, the result shows a very close representation of the reality. This is because the flood vulnerability class progression in the model coincide with the areas of observable impact as earlier visited on the field when compared with the model .The contributing percentage for the factors are Mean Annual Rainfall (20%), Slope (20%), Landuse (20%), Relief (15%), Drainage Density (10%), Drainage Order Level (10%) and Soil type (5%). Despite the fact that Mean Annual Rainfall (MAR) has the same percentage weight alongside with landuse and slope, the analysis reveals that the MAR contributed more to flooding than other factors considered in the model followed by slope, drainage and landuse.
Keywords:
Flood Vulnerability, GIS and Remote Sensing, Weighted Linear Combination, Ibadan City
Cite this paper: Eguaroje O. E., Alaga T. A., Ogbole J. O., Omolere S., Alwadood J., Kolawole I. S., Muibi K. H., Nnaemeka D., Popoola D. S., Samson S. A., Adewoyin J. E., Jesuleye I., Badru R. A., Atijosan A., Ajileye O. O., Flood Vulnerability Assessment of Ibadan City, Oyo State, Nigeria, World Environment, Vol. 5 No. 4, 2015, pp. 149-159. doi: 10.5923/j.env.20150504.03.
1. Introduction
The vulnerability of a place on the earth surface to flood is a function of the region’s exposure to the hazard (natural event) and the anthropogenic activities carried out within the catchment area, which impedes the free flow of water [10]. Flood is among the most devastating natural hazards in the world claiming lives and properties. Nigeria has lost a lot of lives and properties worth millions of naira in the last three (3) decades, directly or indirectly to flood.Based on historical account, flood disaster is not recent; and its destruction is sometimes enormous. The Johnston flood of May 31, 1889 in Johnston, Pennsylvania USA, left about two third of Johnston submerged under water, its rail and telegraph line washed out. Floods have profound impacts on population worldwide in terms of both loss of life and property. Flood risk management in the strict sense is the process of managing an existing flood risk situation. In a wider sense, it includes the planning of a system which will reduce the flood risk. Risk management takes place on three different levels of actions; the operational level, which is associated with operating an existing system; a project planning level which is used when a new or a revision of an existing project is planned, and a project design level, which is embedded into the second level and describes the process of reaching an optimal solution for the project. Risk management for the operation of an existing flood protection system is the sum of actions for a rational approach to flood disaster mitigation, this is to control flood disasters and minimize its impact.However, flood protection systems needs continuous improvement which requires a reassessment of the existing risks and an evaluation of the hazards depending on the newest information available on new boundary conditions, due to change in land use. A good risk analysis process yields hazard or vulnerability maps, which today are drawn by the means of Geographic information systems (GIS) based on extensive surveys of vulnerability combined with topographic maps and images. Such maps serve to identify weak areas or a need for action. Prioritization of flooding hazards need to take into account risks and vulnerabilities in order to determine which hazard present the greatest threat to people, property and essential services.GIS can be used to address flood losses through a number of applications. For example a flood risk map can be used by insurance agents, property owners, and floodplain managers can look at a map to determine whether a property is within a mapped floodplain, flood way, or other hazard area. By showing the extent to which a community is at risk for flooding, better planning can be done to prevent future loss of lives and property.Reducing the impact of flood can be successful only when detailed knowledge is obtained about the expected frequency, character and magnitude of hazardous events in an area as well as the vulnerability of people, buildings, infrastructures and economic activities in a potential dangerous area. Unfortunately, Ifatimehin et.al [6] reported that this detailed knowledge is always lacking in most urban centres of the developing world especially Nigeria. One way to mitigate the effects of flooding is to ensure that all areas that are vulnerable are identified and adequate precautionary measures taken to ensure either or all of adequate preparedness, effective response, quick recovery and effective prevention. Before these could be done, information is required on important indices of flood risk identification which are elevation, slope orientation, proximity of built up areas to drainages, presence of buffers, extent of inundation, cultural practices as well as attitudes and perceptions. A combined effort using data from Remote Sensing approach and spatial analysis in Geographic Information System will aid better understanding of the different level of the vulnerability and risk assessment in Ibadan. The historical date of the first flooding in Ibadan has been a subject of debate while Tomori recorded that the first flooding occurred in Ibadan in 1902, Etunovbe, 2011; Ajayi et al 2012; Akintola, 1981, recorded that flooding has been a recurrent decimal in Ibadan with recorded occurrences in 1948, 1955, 1961, 1963, 1978, 1980, 1985, 1987 and 1990 claiming over 35,000 lives and properties worth millions of Naira, with the major sources of this flooding being Ogunpa and Kudeti streams [1].Ibadan has recorded varying degrees of flooding. For instance, there were flooding in the watersheds of Ogunpa and Kudeti streams (one of the two major streams in Ibadan) in 1955, 1960, 1961, 1963, 1969, 1978 and 1980. The flooding of 1969 is unique because it resulted from a mere 25.4 mm rainfall [2]. An accurate assessment of the havoc caused by floods in Ibadan over the years is difficult to obtain [4]. However, a number of official estimations have been made at different points. For instance, the losses arising from the flood disaster of August 1980 in Ibadan were estimated at N300.0 million while the number of lives lost was put at 500 people (Akintola, 1994) [2]. Between 1995 and 1998, over 12 million Naira, were estimated to have been lost to floods in Ibadan [9]. The rain gauge at the IITA recorded an all time high of 187.5mm rainfall on August 26, 2011.Which started at 16.40 hr until 20.00 hr with intermittent drizzling until 23.00 hr accompanied by wind speed as high as 65 km/hr. IITA reported that the rainfall was most intense between 18.10 hr and 19.20 hr when 75% or 140.63 mm of the rain fell? This is an average rainfall intensity of 127.84/hr [8]. Recently, in August 2011 and July 2013 flooding in Ibadan has claimed lives and properties. A close look at this historical update shows that flooding and flood management has become one of the issues to contend with in this ancient city. This underscores the need for this study, so as to find a reasonable solution, prevention and mitigation strategy for this quagmire.Statement of ProblemsFlooding results into a lot of damages and the extent of damage varies from place to place. Nigeria has her share of flood events which has taken a toll on lives and properties. A lot of research has been carried out to ascertain the causes of flooding and different reasons have been identified, such include: dumping of refuse over the years has led to the filling up of ponds and blockages of other natural water ways or drainages; high intensity rainfall coupled with a gentle slope for water accumulation; dam failure coupled with almost bare surface; rapid rate of unplanned settlement leading to poor drainage system among many others. The spatial distribution of risks as well as the benefits of flood mitigation measures is rarely considered. Therefore, it is often unknown which area benefit most from a measure and which areas do not. In August 2011 and July 2013, flooding in Ibadan claimed many lives and properties. A close look at this historical update shows that flooding and flood management has become one of the issues to contend with in this ancient city. This underscores the need for this study so as to find a reasonable solution, prevention and mitigation strategy for this menace.The multi-criteria flood risk/vulnerability mapping approach will show the spatial distribution of the different risk criteria. However, a holistic view of the contributing factors to flood will be desirable, in as much as flood cannot be eradicated but the impact can be minimized. This is to serve as an early warning system, in order to avoid inadequate risk assessment which relates to spatial planning.Aim of the Project:The aim of the project is to carry out flood risk assessment of Ibadan city, Oyo State.Objectives of the Project:The objective of this study are to:1) examine the physical and anthropogenic factors that contributes to flood disaster2) assess the landuse and landcover pattern of Ibadan city.3) create a model for flood vulnerable areas.Study areaThe area for this study is Ibadan and its environs. It is located between latitude 7°15′00″ N, longitude 3°45′00″E, and latitude 7°34′00″N longitude 4°05′00″E, in the south-western region of Nigeria. Ibadan is 128 km inland northeast of Lagos and 530 km southwest of Abuja, the federal capital (Wikipedia, 2011) [12]. It is a prominent transit point between the coastal region and the areas to the north. Ibadan has a tropical wet and dry climate, with a lengthy wet season and relatively constant temperatures throughout the course of the year. Ibadan’s, wet season runs from March through October, though August sees somewhat of a lull in precipitation. This lull nearly divides the wet season into two different wet seasons. The remaining months forms the city’s dry season. It has total area coverage of about 1,189.2 sq mi (3,080 km2) and a population of 2559853 million (FGN official Gazette, 2009).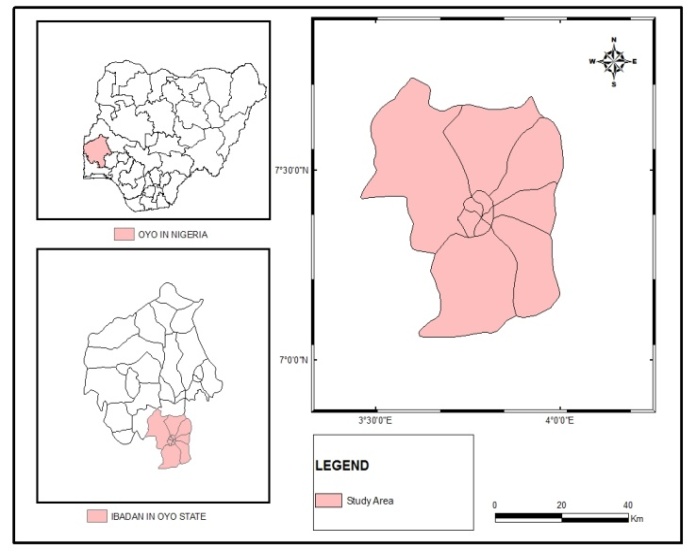 | Figure 1. The Study Area |
2. Materials and Methods
Geospatial data acquired from both primary and secondary sources were used for the study. The data used include Ground Control Point (GCP), Topographic maps at scale of 1:50,000, soil map, rainfall data and Geo-Eye satellite image. The topographic and soil maps were scanned using A0 Scanner and georeferenced to WGS 1984 UTM Zone 31 for spatial referencing compatibility with other datasets that will be used within a GIS environment. An on-screen digitizing was carried out on these maps to extract the soil types, contour and drainage layer of the study area. The drainage layer was captured with their specific stream order. The contour lines were interpolated to create Digital Elevation Model while the digitized soil type’s layer was converted to raster. The satellite images acquired for this work are Quick bird and NigSat-1 images. The quick bird was digitized to extract the settlements and infrastructures that fall within the flood plain in the study area while the NigSat-1 was classified into different land-use classes; water/riparian/wetland, built up/ bare surfaces, forest/woodland, and cultivation/ shrubland. Meteorological data (rainfall) was rasterized and assigned classes. From this raster data, Mean Annual Rainfall (MAR) was generated.The study used Weighted Linear Combination approach which involves mathematical weighing and ranking of the criteria. The study area is approximately 27,167.91 km2. It was divided into grid of equal size of 9km2 each see fig 3.1. First, the raster layer for Digital Elevation Model (DEM) was reclassified into four classes and was ranked as 1, 3, 5 and 7. The same things were done for soil, rainfall and land use raster layer. Drainage density was also calculated for each grid and was classified and ranked. In order to assign criterion value for each grid , the reclassified raster layers for DEM, soil, landuse, drainage density and rainfall with their associated ranks value were overlaid on the grid layer and each grid was assigned value based on the dominant class that fall on it. The critical index value was generated by summing the weighted value of all the criteria in the attribute table. The grid was converted to points and the critical index value field for each grid in the attribute table was therefore interpolated to generate flood vulnerability map. Data IntegrationThe layer of data extracted from the topographical map, soil map, satellite image and meteorological data above were integrated in a GIS environment and further subjected to Multi-Criteria Analysis (MCA) using the Weighted Linear Combination (WLC) approach. Spatial analysis was carried out on the derived result using the Critical Index (CRI) value. Finally, areas that are vulnerable to flooding were mapped out.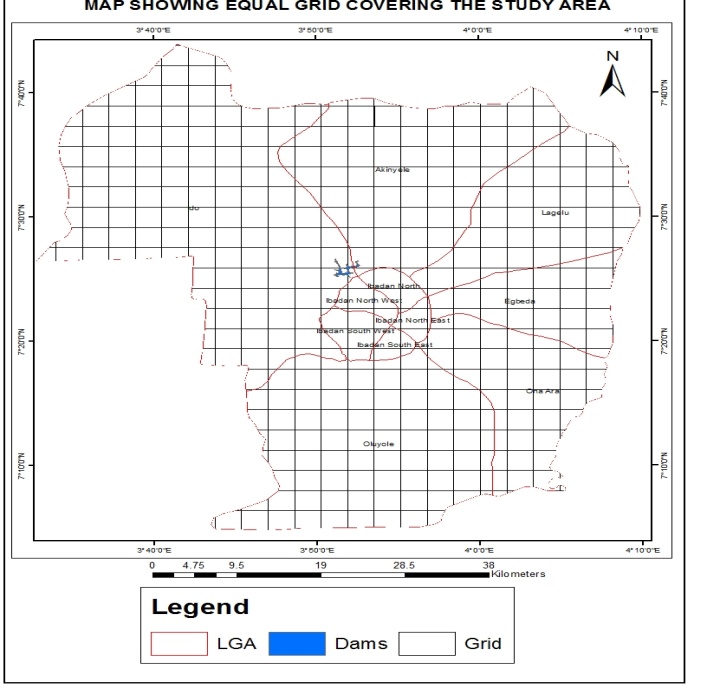 | Figure 2. Study Area Grid |
Drainage of the Study AreaDrainage is an important physical factor that greatly contributes to flood disaster. The stream order is also important in the evaluation of flood’s impact over an area occurrence. Therefore, strahlar stream ordering system was used to order the entire drainages of the study area. This stream ordering system shows five stream order for the entire study area. The lowest order is “1” while the highest order is “5”. The drainage captured from the topographical map shows 24 identifiable basins for the whole of the study area and three main basins in Ibadan Municipal which include Ona, Kudeti and Ogunpa see figure 3 and figure. 4.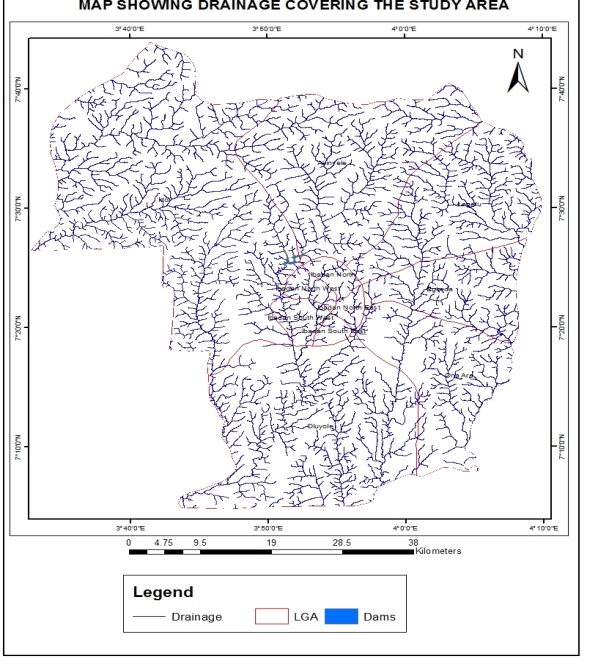 | Figure 3. Drainage of the Study Area |
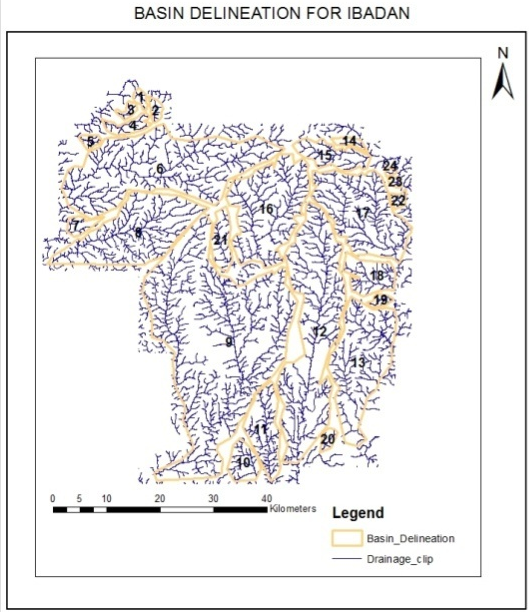 | Figure 4. Drainage Sub Basins of Ibadan City |
Effect of Relief on Flooding in IbadanThe relief of an area plays a very significant role in the occurrence of flood disaster in a particular area. Since water responds to slope, a hilly area will discharge its water to lower elevation areas. Ibadan has a combination of high, low and undulating terrain. The northern part of the area has a relatively high elevation which gradually progresses towards the southern part of the area see fig. 5. This terrain pattern justifies why a highly prone areas to flood are more pronounced in the centre and also towards the southern part of Ibadan. 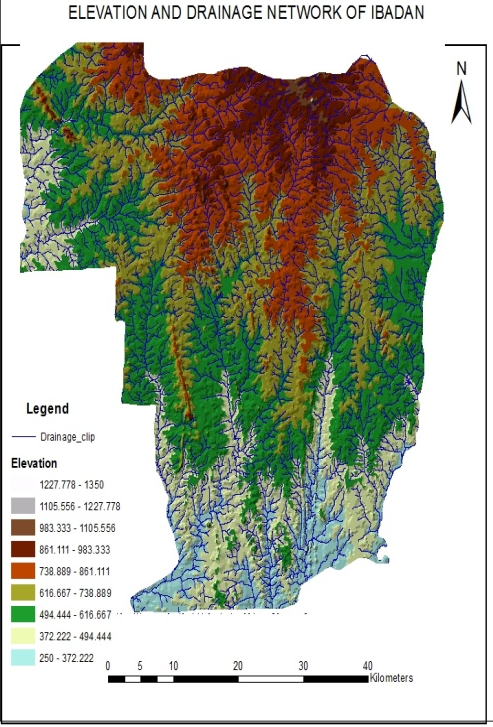 | Figure 5. Relief and drainage of the study area |
Mean Annual Rainfall for IbadanRainfall is an important hydrological parameter in flood disaster. The mean annual rainfall for the study area shows five classes. These include (a) less than 167mm, (b) between 167 and 177mm, (c) between 177 and 187mm, (d) between 187 and 198mm and (e) greater than 198mm. The southern part of the study area has the highest mean annual rainfall. These decreases progressively inward towards the northern part of the study area see fig 6. 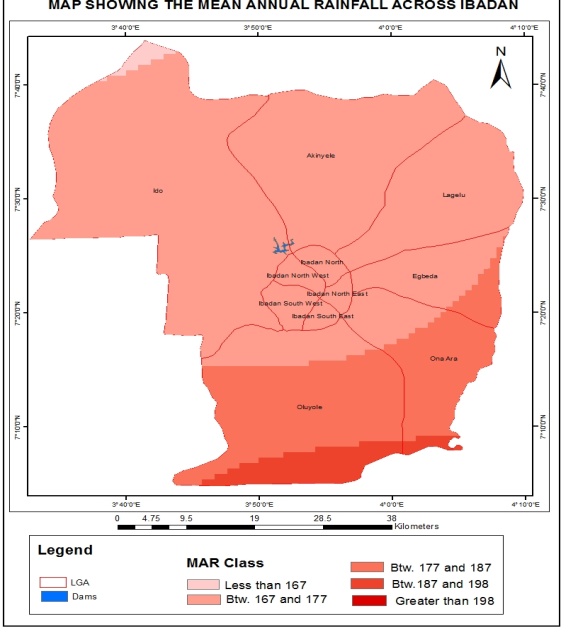 | Figure 6. Mean Annual Rainfall across Ibadan |
Soil of the Study AreaThere are five soil types for the study area. These include litixols, fluvisols, acrisols, luvisols and regosols. The dominant soil type is lixisols with an area of 1,295.4km2 followed by regosols, 1,458 km2, fluvisols 204.2 km2 , luvisols 65.8 km2 and acrisols 39.5 km2.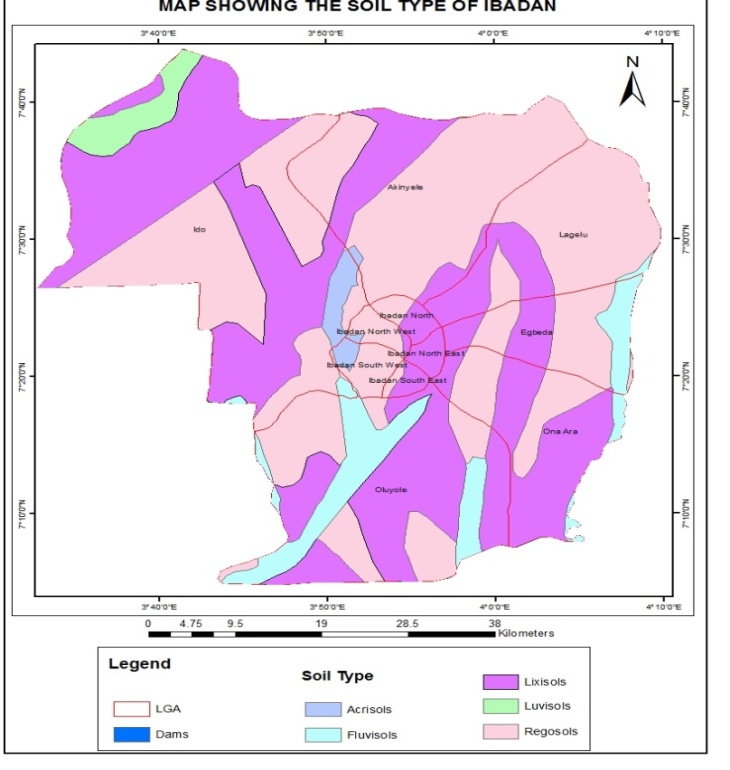 | Figure 7. Soil Types of Ibadan |
3. Result and Discussion
Seven contributing factors were examined. These include mean annual rainfall, slope, soil types, and relief, land use, drainage order level and drainage density. The impact of each of the above contributing factors was examined by introducing them one after the other in the model. The result shows a false representation of the observable pattern in reality when all other contributing factors participated in the model without mean annual rainfall and relief. After the introduction of mean annual rainfall and relief to the model, the result shows a very close representation of the reality. This is because the flood vulnerability class progression in the model coincide with the areas of observable impact as earlier visited on the field when compared with the model.The contributing percentage for the factors are Mean Annual Rainfall (20%), Slope (20%), Landuse (20%), Relief (15%), Drainage Density (10%), Drainage Order Level (10%) and Soil type (5%). Despite the fact that Mean Annual Rainfall (MAR) has the same percentage weight alongside with landuse and slope, the analysis reveals that the MAR contributed more to flooding than other factors considered in the model followed by slope, drainage and landuse.Flood Vulnerability Level in Ibadan CityIn the flood vulnerability map, the result shows four classes for the whole of Ibadan and three classes for Ibadan Municipal. These classes include slightly vulnerable, less vulnerable, moderately vulnerable and highly vulnerable see fig 8. The least vulnerable class occupied an area of 55.9%, less vulnerable area occupied 9.1%, moderately vulnerable area occupied 10% and highly vulnerable occupied 25% of the entire Ibadan City see fig. 9. Ibadan Municipal occupies a total area of 127.46km2; highly vulnerable area occupies 24.66% of the total area, moderately vulnerable occupies 44.87% and less vulnerable 30.47%. There are total of 128,182 houses in Ibadan Municipal captured from the satellite image of Ibadan. Out of this, 17,168 houses occupies a highly vulnerable area, 100,007 houses occupies moderately vulnerable area and 11,007 houses occupies less vulnerable areas of Ibadan Municipal respectively. In terms of the area extent, Ibadan Municipal occupies a total area of 127.46km2. Highly vulnerable area occupies 31.43km2, moderately vulnerable area occupies 57.19km2 and less vulnerable area occupies 38.84km2.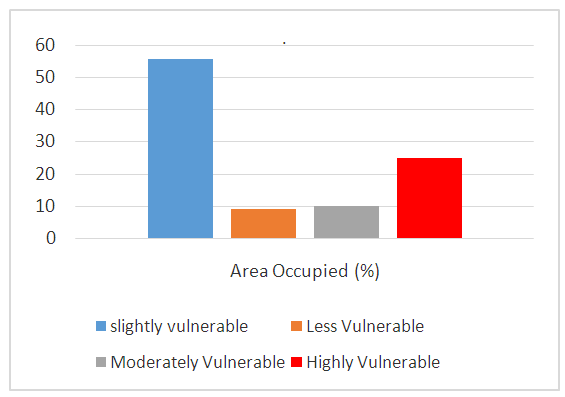 | Figure 8. Flood Vulnerability Chart |
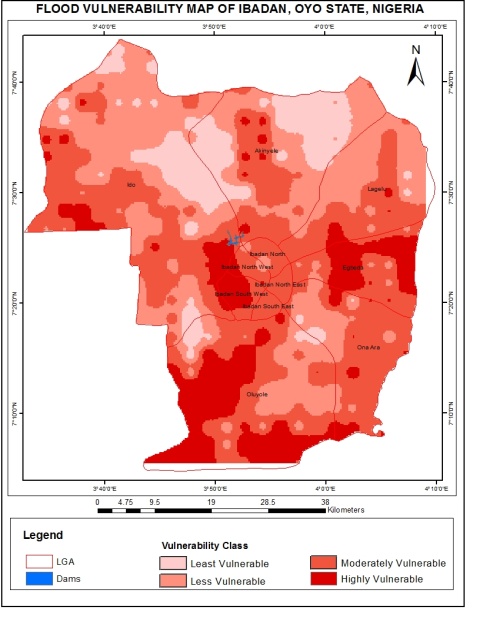 | Figure 9. Flood Vulnerability Map of Ibadan |
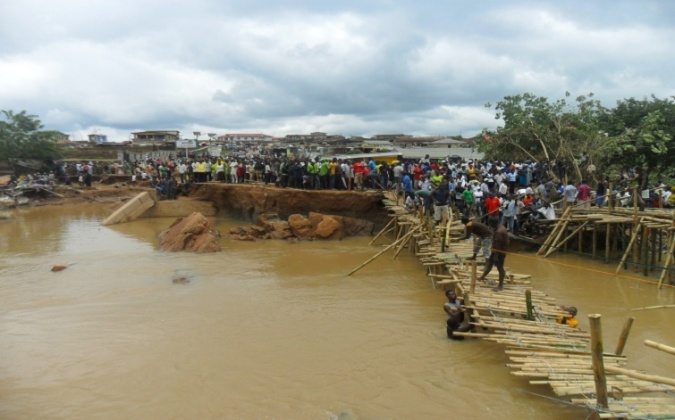 | Plate 1. Flood Inundation in Apete Area Ibadan |
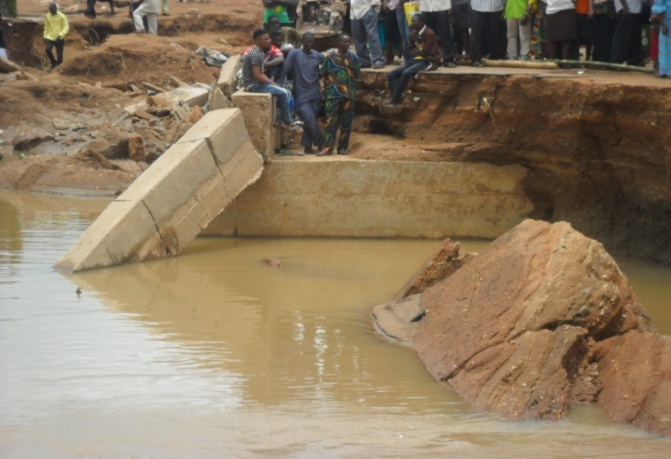 | Plate 2. Collapsed Bridge during Flood event |
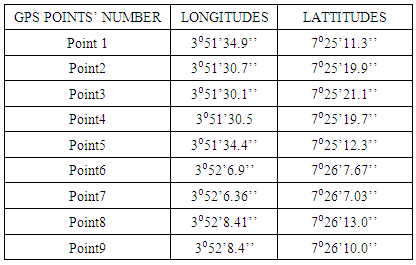
Table 1. GPS Points of Some Selected Elevation and Floodplains
 |
| |
|
References
| [1] | Ajayi, et. al., 2012, Flood Management in an Urban Setting: A Case Study of Ibadan Metropolis. A Special Publication of the Nigerian Association of Hydrological Sciences (2012). |
| [2] | Akintola E.O (1994). Flooding Phenomenon. In M. Filani, E.O Akintola and Ikporukpo (Eds), Ibadan Region,Ibadan: Department of Geography University of Ibadan. |
| [3] | Ajayi, et. al., 2012b, Establishment of Permanent Sample Plots for Continuous Forest Federal Inventory in a Teaching and Research Publication of Teak in Cross River State. Nigerian Journal of Agriculture, Food and Environment, 8(2), 9-11. |
| [4] | Central Bank of Nigeria (CBN), 2012 Annual Reports. |
| [5] | Government of Nigeria (2009), Official Gazette. |
| [6] | Ifatimehin, et. al., (2009), Managing Land Use Transformation and Land Surface Temperature Change in Anyigba Town, Kogi State, Nigeria. Journals of Geography and Geology, Vol. 3, No. 1, 2009. |
| [7] | International Institute of Tropical Agriculture (IITA), 2011 Reports. |
| [8] | National Water Resource Institute, 2011 Reports. |
| [9] | National Emergency Management Agency, NEMA (2013). A Publication of Punch Newspaper, November, 18, 2013. |
| [10] | UNESCO, (2012). Managing Water under Uncertainty and Risk. The UN World Water Development Reports 4, Vol. 1. |
| [11] | Tomori M. A. 2001. Ibadan metropolitan area and the challenges to Sustainable Development. Retrieved Dev. 29, 2011. |
| [12] | www.wikipedia.com 2011. Location and History of Ibadan City. |
 Abstract
 Reference
 Full-Text PDF
 Full-text HTML