-
Paper Information
- Paper Submission
-
Journal Information
- About This Journal
- Editorial Board
- Current Issue
- Archive
- Author Guidelines
- Contact Us
World Environment
p-ISSN: 2163-1573 e-ISSN: 2163-1581
2015; 5(4): 140-148
doi:10.5923/j.env.20150504.02
The Effect of Ozone and Aerosols on the Surface Erythemal UV Irradiance Estimated from TOMS Measurements
 Abstract
 Reference
 Full-Text PDF
 Full-text HTML
Abdel Galeil A. Hassan
Department of Physics, Faculty of Science, South Valley University, Qena, Egypt
Correspondence to: Abdel Galeil A. Hassan , Department of Physics, Faculty of Science, South Valley University, Qena, Egypt.
| Email: |  |
Copyright © 2015 Scientific & Academic Publishing. All Rights Reserved.
The main aim of this work is to assess the effect of aerosols and total column ozone (TOC) on the surface erythemal UV irradiation (UVER) using data acquired from Total Ozone Mapping Spectrometer (TOMS). The present work is carried out over the regions of Upper Egypt. The regions are classified in three sites: Western desert, river Nile and Red Sea. First, UVER, aerosol index (AI) and TOC are presented during the period Jan 1979 to December 2000 (except January 1994 - June1996). The results show that: UVER has a similar pattern at all sites with maximum values equal to 314.5, 316.5 and 316 mW/m2 in Western desert, river Nile and Red Sea, respectively. These values more fluctuate in spring. It may be attributed to the weather conditions. On other hand the TOC and AI have a maximum values in spring. Their values, for TOC, are ≈ 300.0 DU in the three regions. For AI the maximum values are 2.03, 2.20 and 1.94 in the Western desert, the river Nile and the Red Sea regions, respectively. The results show that there is no remarkable difference in UVER, TOC and AI levels between the three regions. Secondly, the Radiation Amplification Factor (RAF) is used to assess the effect of ozone and aerosols quantitatively. RAFTOC for ozone is 0.912~1.07 with solar zenith angles ≤ 50 and clear- sky conditions (reflectivity ≤ 10%). To evaluate the effect of aerosols on the surface UV radiation, only clear-sky data are used while the solar zenith angle and TOC are fixed. The results show that RAFAI for aerosols is 0.021~0.079 for the given conditions which is relatively small compared to that for ozone.
Keywords: Surface erythemal UV radiation, Total column ozone, Aerosols index, Radiation amplification factor, Egypt
Cite this paper: Abdel Galeil A. Hassan , The Effect of Ozone and Aerosols on the Surface Erythemal UV Irradiance Estimated from TOMS Measurements, World Environment, Vol. 5 No. 4, 2015, pp. 140-148. doi: 10.5923/j.env.20150504.02.
Article Outline
1. Introduction
- UV radiation can be subdivided wavelength-wide into four divisions: mainly near UV (320–400 nm), middle UV (280–320 nm), far UV (200–280 nm), vacuum and extreme UV (100–200 nm) [1-3]. Although, in the outer space, UV-A and UV-B represent about 7.5% of the total solar irradiance, at the earth's surface, these percentages typically become between 3% and 5% [1]. UV radiation affects human health, damages aquatic life, affects plants, affects conservation and durability of materials, in addition to impacting global energy balance and climate change [2]. On the other hand not all of the UV radiation effects are harmful; the synthesis of vitamin D is one of the beneficial effects of UV radiation [3, 4]. McKinlay and Diffey [5] established the erythemal action spectrum, which represents the spectral response of human skin to UV irradiation able to trigger an erythema (or sunburn). The solar radiation weighted with this spectrum is called erythemal irradiation (UVER; 280–400 nm) [6-7]. UV radiation on the surface is affected by various factors such as total column ozone, solar zenith angle, clouds, surface albedo, aerosols, and elevation. Solar zenith angle is the main factor determining the amount of UV radiation reaching the earth’s surface. The effect of solar zenith angle can be calculated considering the position of the sun in the sky. The effect of ozone and aerosols on the surface UV radiation has been studied mainly using data obtained from surface measurements which have temporal and spatial limitations [8-12]. With the development of satellite technologies, it is possible to cover the whole globe without interruption in measurements. In order to investigate the effect of ozone and aerosols on the surface UV irrradiation, the Radiation Amplification Factor (RAF) for erythemal UV irradiation is used to express the impact of ozone and aerosols on UV irradiation (it has been used widely as useful parameter during the last years by many authors [10-17].Different studies show that clouds, ozone and atmospheric aerosols are the atmospheric compounds that mainly attenuate UV reaching the earth's surface [18]. UVER solar irradiation is attenuated by stratospheric and tropospheric ozone absorption which depends on wavelength. The influence of TOC on UV irradiation is highly wavelength-dependent. Various authors have investigated the effect of TOC on UV irradiation. For example, McKenzie et al. [19] showed the relationship between UVER and ozone, and they found that an ozone reduction of 1% leads to a 1.25±0.20 % increase in UVER irradiance. Koepke et al., [20] showed that UVER dependence on TOC varies with the solar zenith angle (SZA). Adam [12] estimated the RAF for UV-B by slant total column ozone in Qena site, Egypt using ground - based measurements of UV-B. This study led to the RAF estimating for the daily and monthly mean values in cloudless sky conditions were equal to 1.0014 and 1.05, respectively. Also, aerosols effects on UV radiation have been studied by several authors: Liu et al., [21] showed the effect of anthropogenic aerosols on UVER and observed a reduction of between 5% and 18% at ground level that may have been balanced by the increase in UV irradiation due to stratospheric ozone depletion. Changes in aerosols size and absorption properties over the year cause significant effects, such that mineral aerosol load might reduce (∼25%) UVER solar irradiance at the surface when aerosols optical depth increases by one unit for SZA below 25° [22]. Kazadzis et al.; [23] reported, at Thessaloniki, Greece, a 15% reduction in UV irradiance in the 325-340 nm range for a one of aerosol optical depth. Badarinath et al.; [24] reported that tropospheric aerosols loading has a significant impact on UVER in the a tropical area of Hyderabad, India and that UVER decreases by 24% on days with high aerosols load.The main objective of this study is to evaluate the effects of aerosols index (AI) and total column ozone (TOC) on the variability of the surface erythemal ultraviolet irradiations (UVER) for SZA ≤ 5° and clear sky-conditions. The present study covers longer period than the most previous studies (January 1979 - December 2000) (except January 1994 – June 1996). The study, also, presents the variability of both AI and TOC.
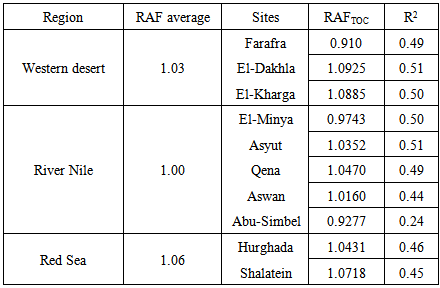
2. Description of the Studied Locations and Data
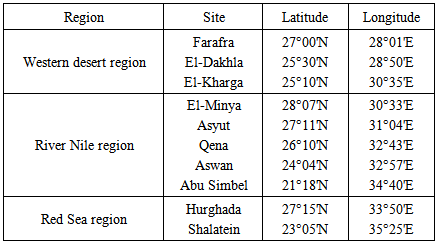
- Upper Egypt is known as southern Egypt because it is upstream, closer to the source of the Nile, it extends from the cataract boundaries of Aswan to the area south of Cairo. The present study divides Upper Egypt in three geographical regions as: (1) Western desert region (El-Farafra, El-Dakhla and El-Kharga), (2) River Nile region (El-Minya, Asut, Qena, Aswan and Abu-Simble) and (3) Red Sea region (Hurghada, and Shalatein). The regions are described in table 1.
|
3. Results and Discussion
- Firstly, the diurnal variations in UVER, TOC and AI are presented during the period of measurements from January 1979 to December 2000 (except January 1994 - June1996, where there were missing data). The TOMS Ozone Mapping Spectrometer was used in this work which is based on two satellites: Nimbus7 TOMS for 1979-1993 and Earth Probe TOMS for 1996-2000 (ftp://toms.gsfc.nasa.gov).
3.1. Erythemal UV Irradiance (UVER)
- Figure 1 shows the average daily of UVER variations in Aswan, Hurghada and EL-Farafra sites (as an example of all three study regions in Upper Egypt). The other figures related to the rest sites have a similar pattern. The results show the following points:1. At all studied regions, UVER variation presents similar patterns, reflecting high values during summer and low values during winter 2. The daily maximum average values of UVER are 314.5, 316.5 and 316 mW/m2 in the western desert region, the river Nile region and the Red Sea region, respectively. It's clear that there no a remarkable difference in UVER levels between the three regions3. The daily minimum average values of UVER are equal to 121, 128 and 125 mW/m2 in the western desert region, the river Nile region and the Red Sea region, respectively. 4. Vertical lines in the figure represent the standard deviations of UVER data, it is clear that the UVER data have high values of standard deviations during spring. The high standard deviation indicates that the UVER values are spread out over a wider range of its average value. i.e. the UVER values are more fluctuate in spring. It may be attributed to the weather conditions.
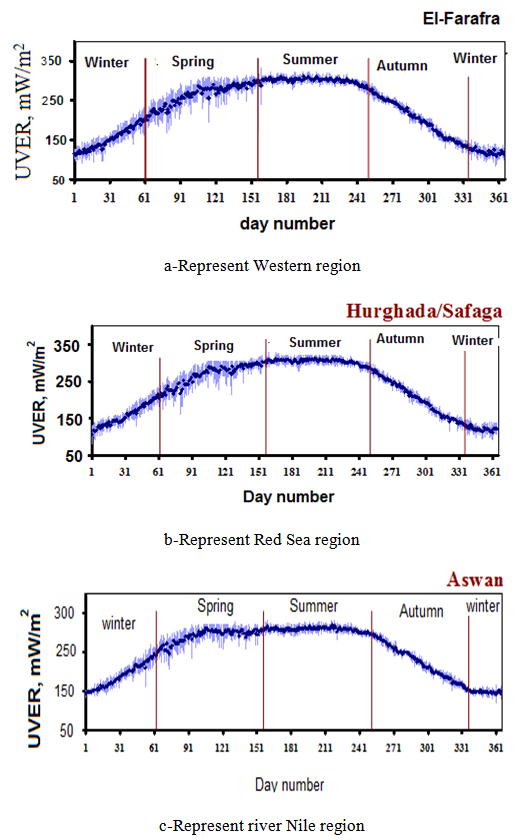 | Figure 1. Daily average of UVER based on TOMS observation covering the time period from 1979 through 2000 with 4- year gap from 1994 to 1996 |
3.2. Frequency Distributions of UVER
- The occurrence frequencies of UVER at local solar noon at all sites are illustrated in Figure 2. The diagrame shows that the most frequent UVER level is that of 300 mW/m2 with percentage of 27.7%, 26.6%, and 27.0% in the western desert region, the river Nile region and the Red Sea region, respectively.
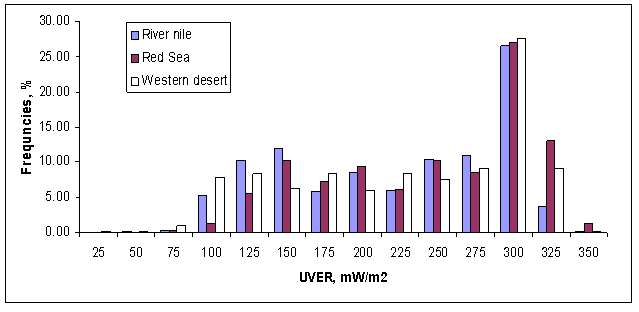 | Figure 2. Frequency distributions of UVER, in study regions, based on TOMS’ observations covering the time period from 1979 through 2000 with 4- years gap from 1994 to 1996 |
3.3. Total Ozone Column (TOC)
- Atmospheric ozone remains an important topic especially because of its global climate change importance. In this study, total ozone column (TOC) measurements by TOMS at subtropical region (Upper Egypt) are considered. Figure 3 shows the daily average of TOC in Aswan, Hurghada and El-Farafra sites to represent the TOC variability in the study three regions. The investigation for all sites leads to the following:1. The total ozone of the whole period has a maximum value in spring and reaches its minimum in late autumn and in winter. Several authors found that the TOC has a maximum value in spring and minimum in autumn [22, 17, 29, 30, 31] They supposed that the reason for these seasonal variations could be the temperature2. The daily maximum average values of TOC are 300.6 DU, 300.0 DU and 299.0 DU in the western desert region, the river Nile region and the Red Sea region, respectively.3. The daily minimum average values of TOC are 251.0 DU, 250.6 DU and 252.2 DU in the western desert regions, the river Nile regions and the Red Sea regions, respectively4. The frequency of occurrence of TOC in all regions is high for the range 281- 290 DU and low for the range of 200-250 DU; exception is observed at Abu-Simple and Shalatein sites with high value for 271-280 DU and low one for 300-400 DU.
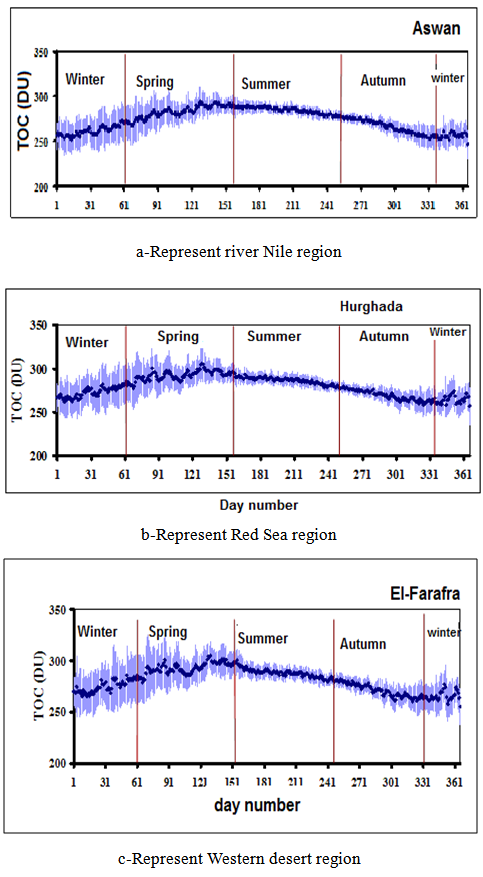 | Figure 3. Daily average of TOC based on TOMS observation covering the time period from 1979 through 2000 with 4- years gap from 1994 to 1996 |
3.4. Aerosol Index
- Figure 4 illustrates the average of daily AI at Aswan, Hurghada and El-Farafra sites to represent its variability in the three regions during the period from 1979 through 2000 with 4- year gap from 1994 to 1996. From this figure, the following points are summarized:1. There is a similar pattern of AI variations in all study sites.2. At all study sites, the AI has generally high values during spring and summer and low values during winter. The relatively high temperature in spring and summer months leads to encouragement of air convection and up-word movement of air parcels containing aerosols. Also, the effect of Khamasin wind. In Egypt, khamasin wind usually arrives in April but occasionally occur between March to May, carrying great quantities of sand and dust from the deserts, with a speed up to 140 kilometers per hour, and a rise of temperatures as much as 20°C in two hours [26].3. The daily maximum average values of AI are 2.03, 2.20 and 1.94 in the western desert region, the river Nile region and the Red Sea region respectively. 4. The daily minimum average values of aerosol index are equal to 0.54, 0.63 and 0.61 in the western desert region, the river Nile region and the Red Sea region respectively.5. Vertical lines in the figure represent the standard deviations of AI data, it is clear that the AI data have high values of standard deviations during spring and summer. i.e. the AI values are more spread out over a wider range of its main values in. It may be attributed to the weather conditions in spring and in summer.
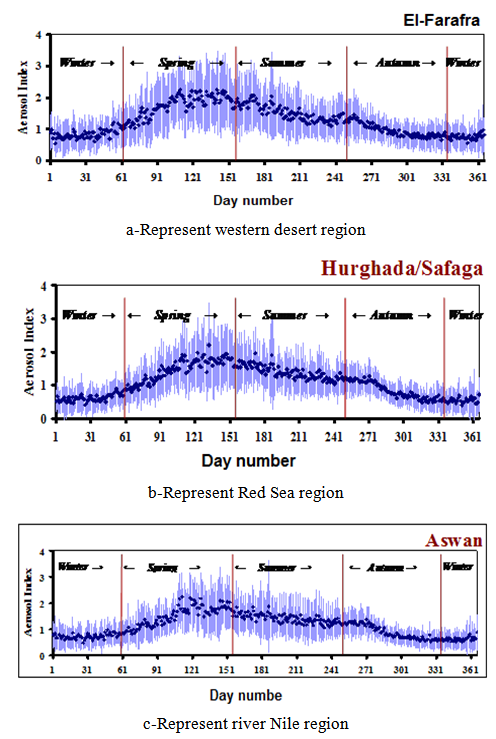 | Figure 4. Daily average AI values based on TOMS observation covering the time period from 1979 through 2000 with 4-year gap from 1994 to 1996 |
 | (1) |
 | (2) |
3.5. Dependence of Erythemal UV Irradiance on TOC
- Figure 5 shows the effect of TOC on UVER by RAF from Eq. (2). Clear-sky data from Jan 1979 to 2000 over the three regions were used for the analysis. To remove solar zenith angle effect, those data with SZA ≤ 5° (slant ozone =TOC) were chosen. On the other hand, the effect of cloud has been removed by considering the reflectivity where it chosen ≤10% [33, 34]. The effect of the albedo change can be considered insignificant; since the area around the site is surrounded by buildings or desert thus maintaining almost the same albedo throughout the year (most previous studies considered the albedo change being insignificant for example [10].
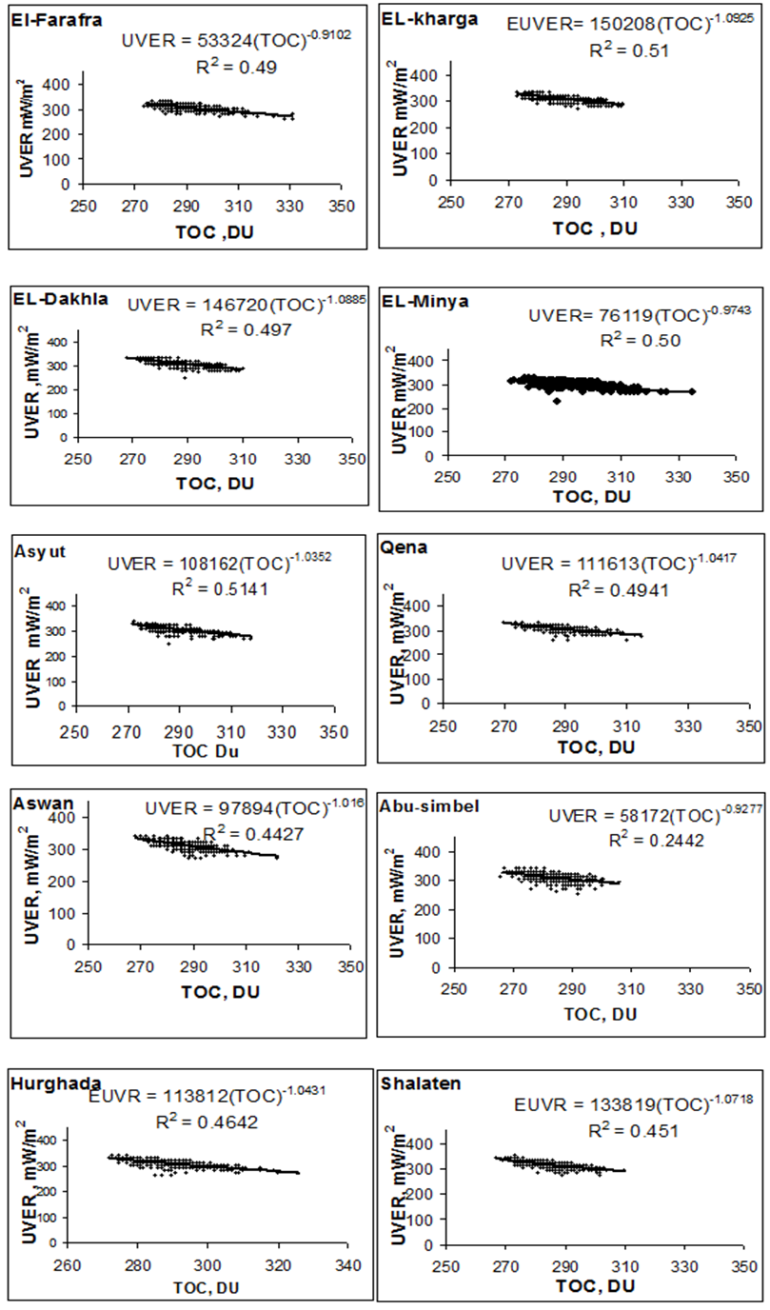 | Figure 5. The power law relationship between UVER and TOC, for clear-sky conditions and SZA≤ 50, at some Upper Egypt sites through the period Jan 1979 to December 2000 |
|
3.6. Dependence of Erythemal UV Irradiance on AI
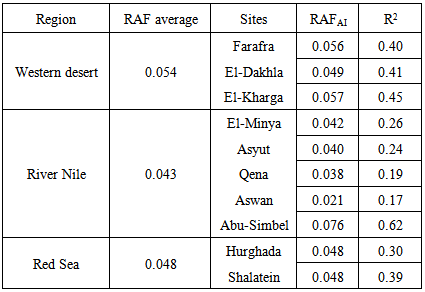
- In order to study the relationship between UVER and (AI), the following conditions are considered: Clear sky- cases (reflectively ≤ 10%), (285 ≤ TOC ≤ 290 DU) and low solar zenith angle (SZA ≤ 5º). In this direction, the relationships between UVER and AI for some Upper Egypt regions are investigated. The study covers the period from Jan 1979 to December 2000. The relationship takes the power formula (Eq 2) to calculate the RAFAI [37, 38].Figures 6 show the relationship between UVER and AI, it is obvious that, at all sites the relationship has a generally negative association. Table 3 shows the values of RAFAI in some Upper Egypt regions according to Eq. (2). RAFAI values are 0.054, 0.043 and 0.048 in the western desert, the river Nile and the Red Sea regions, respectively.
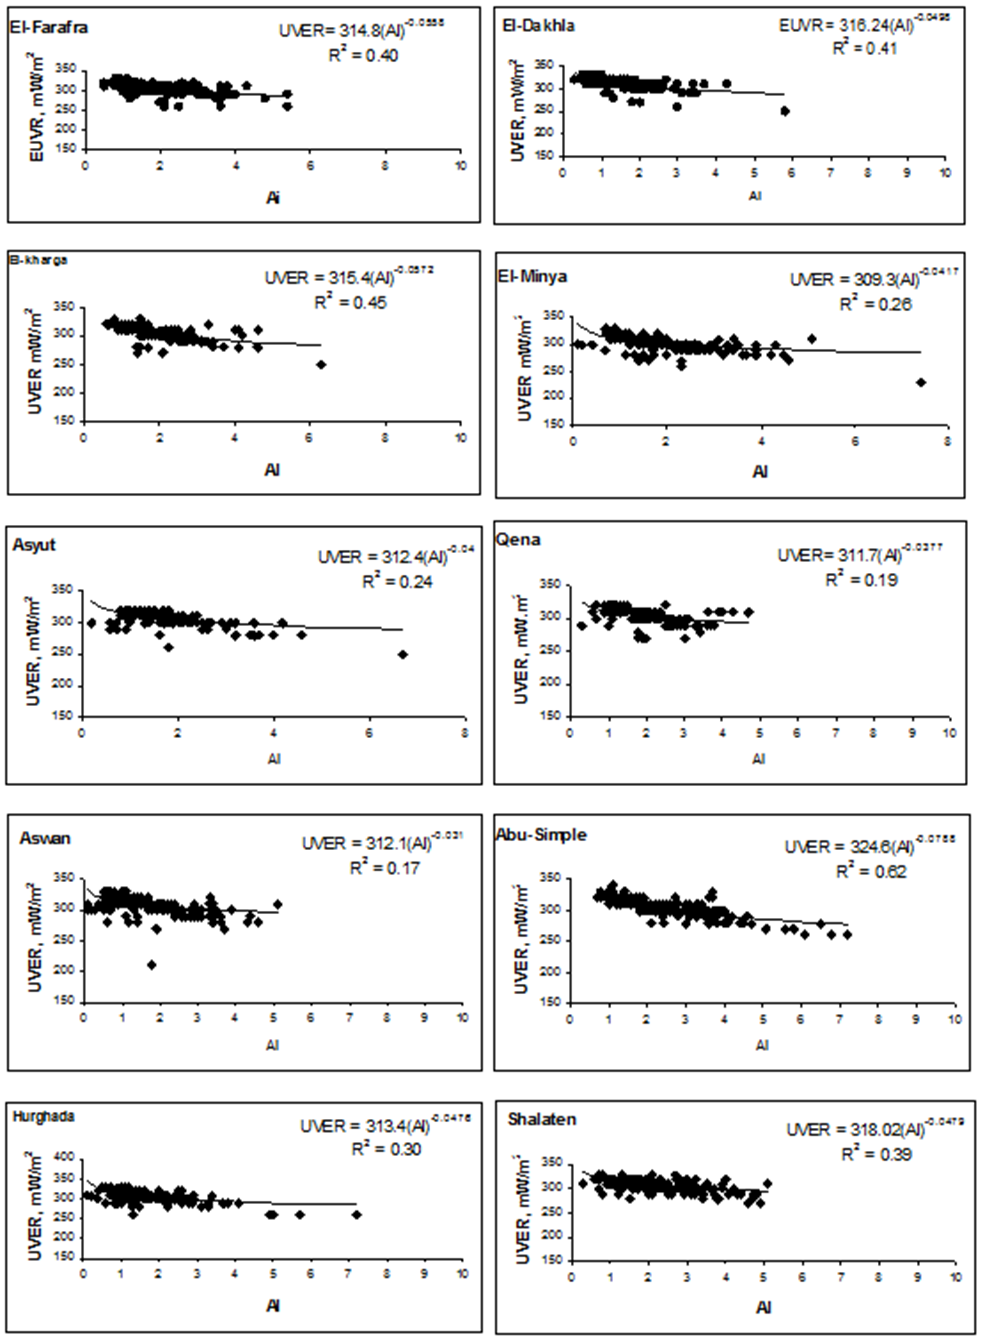 | Figure 6. The power law relationship between UVER and (AI), for clear-sky conditions and SZA ≤ 50, at some Upper Egypt sites through the period Jan 1979 to December 2000 |
|
4. Conclusions
- The study presents the variability of UVER, TOC and AI and evaluated the effects of aerosol index (AI) and total column ozone (TOC) on surface erythemal ultraviolet irradiation (UVER). The Radiation Amplification Factor (RAF) is used to assess this effect. The study covered 10 sites in Upper Egypt during period (Jan.1979 - December 2000) (except January 1994 - June1996). Total Ozone Mapping Spectrometer (TOMS) remote sensing instrument were used to acquire the data. The study leads to the following: 1. The daily maximum average values of UVER were 314.5, 316.5 and 316 mW/m2 in the western desert region, the river Nile region and the Red Sea region, respectively2. The total ozone of the whole period has a maximum value in spring (≈300 DU) and reaches its minimum in late autumn and in winter (≈250 DU).3. At all study sites, the aerosol index has generally higher values during spring and summer and lower values during winter. The maximum and minimum values are ≈ 2 and ≈ 0.6, respectively4. The Radiation Amplification Factor (RAF) for erythemal UV irradiation was 0.92-1.09 for the total column effect, and 0.021 – 0.079 for the aerosol index effect. The values show that the ozone effect is greater than that of the aerosol effect.