-
Paper Information
- Next Paper
- Paper Submission
-
Journal Information
- About This Journal
- Editorial Board
- Current Issue
- Archive
- Author Guidelines
- Contact Us
World Environment
p-ISSN: 2163-1573 e-ISSN: 2163-1581
2015; 5(3): 91-100
doi:10.5923/j.env.20150503.01
Rice Farmers’ Vulnerability to Extreme Climate: Deploying Local Adaptation Finance in Ekiti State, Nigeria
 Abstract
 Reference
 Full-Text PDF
 Full-text HTML
David O. Awolala1, Igbekele A. Ajibefun2
1West African Science Service Center on Climate Change and Adapted Land Use (WASCAL), Department of Economics, Universite Cheikh Anta Diop, Dakar, Senegal
2Department of Agricultural and Resource Economics, Federal University of Technology Akure, Nigeria
Correspondence to: David O. Awolala, West African Science Service Center on Climate Change and Adapted Land Use (WASCAL), Department of Economics, Universite Cheikh Anta Diop, Dakar, Senegal.
| Email: |  |
Copyright © 2015 Scientific & Academic Publishing. All Rights Reserved.
Given the huge requirements and very limited resources available to support adaptation to climatic impacts, adaptation funds should be deployed equitably. Vulnerability assessment is a possible criterion for efficient adaptation resource allocation. The determination of specific vulnerable locations and magnitude by which appropriate adaptation assistance should be rendered becomes matter of necessity. The present study focuses on the vulnerability of rice farmers to extreme climate events for potential adaptation finance allocation in Ekiti State, Nigeria. Descriptive results explains repeated heavy winds and erosion as major climate-induced environmental degradation which has increased exposure of rice farmers to climatic risks in the last five years. Composite Climate Change Vulnerability Index computed from the hazards, sensitivity and adaptive capacity components show that rice farmers in the tropical forest agroecology (0.11) are more vulnerable to climate variability and extreme weather events than in the derived savannah (0.03). High level of exposure index is associated with poor and inadequate adaptive capacity. Inadequate agricultural supports, geographic and lack of human capital were the major contributors to higher vulnerability of rice farmers in Ise Orun. Adaptation finance and resources should be more directed towards rice farmers in Ise Orun local government area to increase their resilience because of higher inadequate government supports and lower infrastructure unlike in Oye.
Keywords: Extreme Climate, Vulnerability Index, Adaptation Finance, Rice Farmers, Ekiti State
Cite this paper: David O. Awolala, Igbekele A. Ajibefun, Rice Farmers’ Vulnerability to Extreme Climate: Deploying Local Adaptation Finance in Ekiti State, Nigeria, World Environment, Vol. 5 No. 3, 2015, pp. 91-100. doi: 10.5923/j.env.20150503.01.
Article Outline
1. Introduction
- Impacts of extreme climate events are increasingly visible around the world, from dwindling water supplies, crop-damaging heat waves and droughts to ecological disasters. In this context, assisting vulnerable communities to adapt and protect themselves has been recognized as a continual pressing issue by the international community. Progress has been made in securing pledges for finance to assist developing countries with both mitigation and adaptation, but the current system is faulty with obstacles, complexities, and unsettled debates. At the 2009 United Nations Framework Convention on Climate Change (UNFCCC) Summit in Copenhagen and the 2010 meeting in Cancun, developed countries affirmed their commitment to assist developing nations in addressing climate change by providing an initial US$30 billion in “Fast-Start Finance” (FSF) from 2010-2012 and contributing toward a global climate finance target of US$100 billion yearly by 2020. However, there are some claims that as of the mid-2011, only about 8% of the pledged FSF had actually been disbursed [18]. Developed countries have been criticized for a lack of transparency in how they are distributing and accounting for these funds, the larger share of climate finance has thus far been spent on mitigation activities, prompting calls for an increased allocation for adaptation [26]. Many developed countries and international institutions have already begun providing climate finance to developing countries but rather than pursuing a coordinated or streamlined approach, a proliferation of climate finance mechanisms has occurred [25]. This large number of funds includes the national funds such as the National Climate Change Trust Fund, and the Environmental Sustainability Group in Nigeria, etc in addition to many bilateral programmes. This confusing web of funds puts burdens on developing countries and increases the challenges of coordinating and accessing adaptation finance [23]. The difficulty of tracking climate change finance has spawned several attempts to map many channels and mechanisms. There is no formal and transparent methodology for allocating funds between projects at the sub-national level [14]. Given that there is a great need for, and limited resources available to support adaptation to climate change impacts, it is crucial that funds be deployed equitably and efficiently. There are efforts in place to strengthen the capacity of vulnerable communities and local governments to meet their adaptation needs. While the Adaptation Fund has several innovative features and has made quick progress in starting to disburse funds, the extent to which its allocation criteria have been applied to date is unclear in countries where disbursement had taken place. A number of foundations for channeling adaptation finance through local government institutions have been put up. At the grassroots, non-governmental organizations (NGOs) are working in some sites to strengthen the capacity of vulnerable communities and local governments to meet adaptation needs. Some public and private agencies have created a process to support local plans for risk reduction through its Local Disaster Risk Reduction Fund (LDRRF). The national plan for poverty, environment and climate mainstreaming project is exploring innovative ways to better incorporate climate change finance into wider government planning and budgeting systems. Nevertheless, the difficulty of tracking climate change finance has spawned several attempts to map and follow the many channels and mechanisms [14]. This study is expected to provide a basis for further discussions around which policies can be made to ensure efficiency in disbursing local adaptation finance in Southwest Nigeria.
2. Vulnerability to Climate Change
- Within the context of vulnerability to climate change problems, several authors have emphasized that vulnerability can be used reasonably with reference to a specific vulnerable condition. [4] suggested the vulnerability of a specified system to a specified hazard or range of hazards, and to differentiate between current and future vulnerability. [21] argued that vulnerability assessments should shift away from attempting to quantify the vulnerability of a place and focus instead on assessing the vulnerability of selected variables of concern and to specific set of stressors. Fussel (2004) also described climate related vulnerability assessments based on the characteristics of the vulnerable system, the type and number of stressors and their root causes, their effects on the system, and the time horizon of the assessment. [10] present a formal nomenclature for the vulnerability of social systems that includes the threat, the region, the sector, the population group, the consequence, and the time period. This framework largely agrees with the dimensions of vulnerability which are fundamental to describe a vulnerable situation.
2.1. Vulnerability Assessment and Adaptation Planning
- Vulnerability assessment lays a good foundation for adaptation strategy. It helps a planning team understand what could happen as climate changes and helps focus attention on the specific areas or assets (people, places/buildings/ infrastructure, and natural resources) that are most vulnerable as well as the phenomena associated with impacts that could result in great losses [17]. There are numerous definitions for “vulnerability”, and often used interchangeably with, or as a part of “risk.” For simplicity, this background captures the intent of both risk and vulnerability assessments into defining vulnerability as the potential for loss of assets largely due to complex interactions among natural processes, land use decisions, and community resilience [24].The Intergovernmental Panel on Climate Change, IPCC, [17] defined vulnerability as the degree, to which a system is susceptible to, and unable to cope with, adverse effects of climate change including climate variability and extremes. Vulnerability is a function of the character, magnitude, and rate of climate change and variation to which a system is exposed, its sensitivity, and its adaptive capacity. [9] presented a multi-scaled, integrated framework for assessing vulnerabilities and adaptive capacity. Determinants of adaptive capacity including access to and distribution of wealth, technology, and information, risk perception and awareness, social capital and critical institutional frameworks to address climate change hazards. These are identified at the individual and community level, situated within larger regional, national and international settings. [20] defines vulnerability as the degree to which an exposure unit is susceptible to harm due to exposure to a perturbation or stress and the ability or lack of the exposure unit to cope, recover or fundamentally adapt to become a new system or to become extinct.[1] explains vulnerability as the extent to which a natural or social system is susceptible to damages from climate change. It is generally perceived to be a function of some components. The effect that an event may have on humans referred to as (capacity) social vulnerability and, the risk that such an event may happen referred to as (exposure). Institutional stability and strength of public infrastructure (adaptive capacity) are crucial factors which determine extent of vulnerability. A well-connected population with appropriate public infrastructure will be able to deal with a hazard effectively and reduce vulnerability. Such a society is said to have low social vulnerability. In an absence of institutional capacity in terms of knowledge about the event and ability to deal with it, then such high vulnerability is likely to ensure that biophysical risk turns into an impact on the human population.
2.2. Quantifying Vulnerability to Climate Changes
- In view of various conceptual renderings, the exposure, sensitivity and adaptive capacity of a system have been identified as the components of vulnerability. Exposure can be interpreted as the direct danger (the stressor), and the nature and extent of changes to a region’s climate variables such as temperature, rainfall, extreme weather events. It reflects factors external to the system of interest such as changes in climate variability including extreme weather events or the rate of shifts in mean climate conditions [17]. Sensitivity describes the human–environmental conditions that can worsen the hazard, ameliorate the hazard, or trigger an impact. It is given by the degree to which a system is modified or affected by an internal or external disturbance or set of disturbances [13]. Adaptive capacity represents the potential to implement adaptation measures that help avert potential impacts. [17] had noted that adaptive capacity is the ability of a system to adjust to climate change (including climate variability and extremes) to moderate potential damages, to take advantage of opportunities, or to cope with the consequences. Adaptive capacity is the ability to recover from shock, or the ability of communities and individuals to adjust to change, to take advantage of opportunities, or to cope with the consequences. The adaptive capacity of individuals or any social group is dependent upon their access to, and control over resources. The poor have particularly limited access to such resources, hence are most vulnerable to negative impacts of climate change and least able to develop viable adaptation strategies. Consequently, different socioeconomic and biophysical indicators are classified into adaptive capacity, sensitivity, and exposure based on the IPCC definition of vulnerability [16, 17]. In the other way round, given that adaptations to climate change are long-term strategies or adjustments associated with climate change, they requires efficient and sustainable use of resources which involves careful planning, combining new and old strategies and knowledge [7, 8]. Vulnerability assessment is such a possible criterion for allocating resources for adaptation funding. Vulnerability indicators have been developed to assist policy makers and relevant stakeholders evaluate the need for new innovative technologies by assessing their current livelihood vulnerability in absence of adaptation. A high vulnerability index indicates a greater susceptibility to extreme climate risk events. Vulnerability indicators also serves as simple approach to support climate protection planning processes and help identify regions where development, donor funds and support aids should be more directed [15]. This study attempts to quantify vulnerability of rice farming households to extreme local climate in Ekiti State, Southwest of Nigeria by ranking locations on vulnerability scale in order to render appropriate adaptation assistance. This is done by employing vulnerability indicators which consist of different socioeconomic and biophysical attributes in the derived savannah and tropical forest agro-ecological zones of the State.
3. Materials and Methods
3.1. Study Area
- The study was carried in the derived savannah and forest agro-ecological zones of Ekiti State, Nigeria. Ekiti State has sixteen local government areas with an approximate population of 2, 748, 441 and estimated land mass of 10,898.68 sq.km in southwest of Nigeria [11]. The State has two Agro-Ecological Zones (AEZs) namely the tropical forest in the South, and derived savannah towards the Northern peripheries. The study covered the two AEZs. Ise Orun Local Government Area (LGA) on 5o31’E, 7o34’N was selected in the southern forest zone while Oye LGA on 5°37’E, 7°76’N was selected in the derived savannah zone (Figure 1).
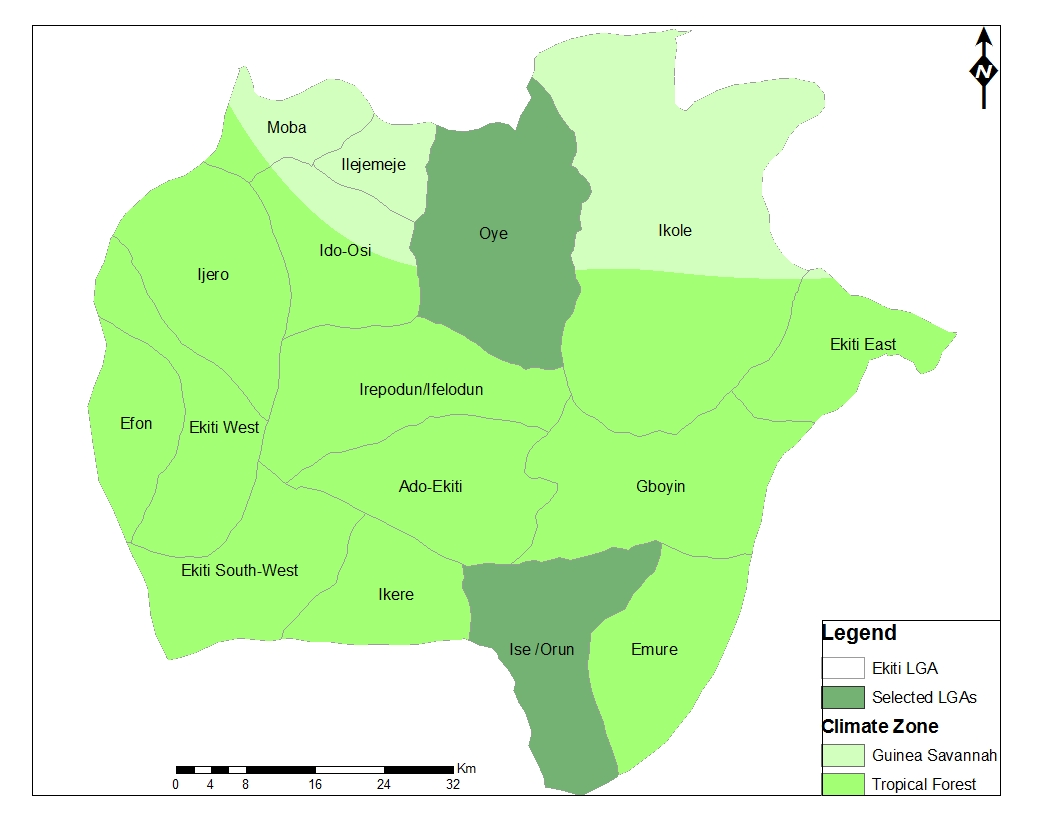 | Figure 1. Map Showing Derived Savannah and Forest Agroecology of Ekiti State |
3.2. Data, Sampling Techniques and Data Collection
- Household survey was used to obtain relevant socioeconomic data of rice producers on their sensitivity, exposure and adaptive capacity across the two agro-ecological zones (AEZs). Multi-stage sampling technique was used to purposively select Oye LGA to represent Derived savannah and Ise Orun LGA in the Tropical forest zone. Eighty-seven rice producers were randomly sampled from Oye and Ise Orun LGAs for this study. Exposure component variables were taken from daily meteorological data of the Climate Forest System Reanalysis (CFSR) downscaled at 38km resolution from the National Centre for Environmental Prediction (NCEP) over the twelve months of 2010. The daily weather data were reduced to monthly averages while standard deviations were estimated to observe the trends of variability.
3.3. Composite Climate Change Vulnerability Index
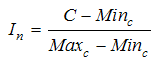
- Assessing vulnerability to climate change has several approaches and various kinds of methodologies have been applied. However, there is no standard methodology or set of indicators for measuring vulnerability [5]. Every system is unique and thus presents different conditions for any kind of approach for assessment after careful observation. A set of indicators were selected for the three components of vulnerability in the sampled communities. Dimensions of subgroup indicator were identified based on some selection criteria. The indicators were then selected based on data availability, personal judgement and literature. Implicitly, CCVI (of LGAi) is presented in equation 1:
 | (1) |
 | (2) |
 | (3) |
 = normalized index score;
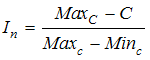
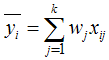
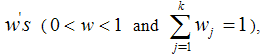
  = value of componentIf the functional relationships are ignored and variables were normalized simply by applying equation (1), the resulting index will be misleading. The standardized raw data ranges between 0 and 1, where value of 1 corresponds to that AEZ with maximum value and 0 corresponds to the AEZ with minimum value [3]. A statistical method of weighting and aggregation were applied to compute a composite vulnerability index. Weighted average technique was used to assign heavier weights to indicators that contribute the greatest amount of variance. The weights were assumed to vary inversely as the variance over a local government area in each indicators of vulnerability. The standardized score lies between 0 and 1 [19]. The weight wj was determined by:
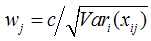 | (4) |
 | (5) |
 hence vulnerability index to be computed lies between 0 and 1. The indices are later ranked by degree of vulnerability based on linear intervals such that each interval has same probability weight of 20% which categorized the levels of rice farmers’ vulnerability in the study. Therefore, an Agro-Ecological Zone (AEZ) with the value of 1 corresponds to extreme vulnerability but 0 implies to zero or no vulnerability [3].
 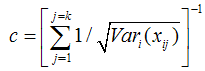 | (6) |
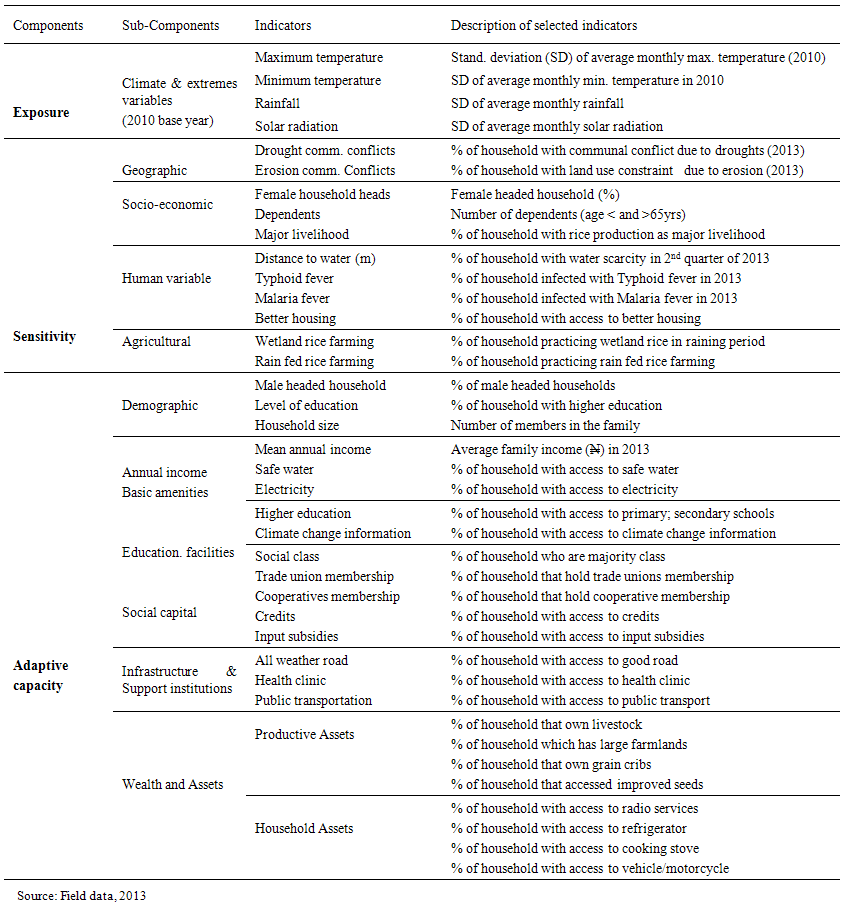 | Table 1. Indicators for Computing Vulnerability Indices |
4. Results and Discussions
4.1. Survey Area by Agro-Ecological Zones (AEZs)
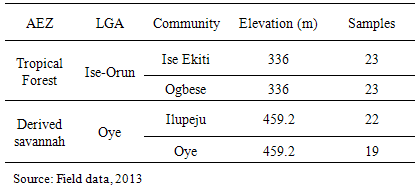
- The distribution of the respondents across sampled communities from each AEZ is presented in Table 2. The distribution shows that 52.9% of the respondents were selected from Ise Orun local government area while 47.1% were from Oye. In the southern topical forest zone, twenty three rice producers were selected from Ise Ekiti and Ogbese farming communities while forty one were sampled from Ilupeju and Oye communities in the derived savannah.
|
4.2. Frequency of Climate Risks Occurrences
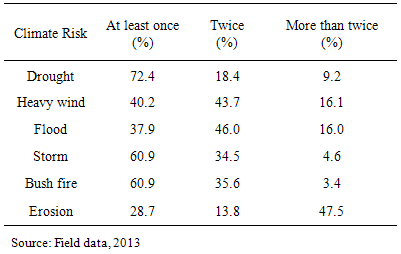
- Descriptive of climate risks in the region is shown on Table 3. In the last 5years, 72.4% of the sampled rice farmers confirmed incidence of drought at least once while 29% have experienced drought repeatedly. Heavy wind is a reoccurring environmental threat as 40.2% confirm incidence of heavy wind on their farms while about 60% experienced repeated heavy winds. Flash flood has constrained 53% at least once but 34% had been affected more than twice. About 38% of the sampled rice farmers confirm storm occurrences for once while 62% had experience repeated frequencies of storm on their rice farms in the last 5years. Fire incidence is a common environmental problem in the study area. The distribution reveals that about 61% of the respondents had witness bush fire at least once on their farmlands while again about 37% sampled rice farmers experienced fire incidence twice which confirms the menace of fire hazards in the study area.
|
4.3. Perception of Rice Farmers on Climate Impacts
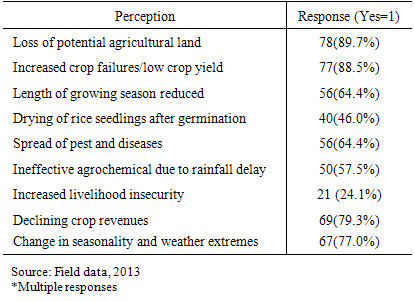
- The distribution on Table 4 reveals that 89.7% of the respondents experience loss of potential agricultural land, 88.5% witnessed increased crop failures/low crop yield while 64.4% confirmed declining length of growing season. Further responses observed that 46.0% of the sampled rice farmers experienced drying seedlings after germination, 64.4% confirms spread of pest and diseases while 57.5% experienced ineffective agrochemical due to rainfall delay in the study area. Increased livelihood insecurity was also noticed among rice farmers given that 79.3% of the respondents experienced declining crop revenues and 77.0% noticed change in seasonality and weather extremes.
|
4.4. Climate Change Vulnerability of Rice Farmers
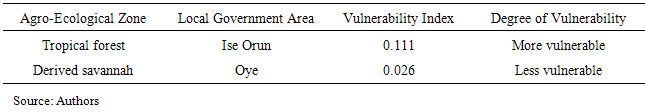
- The Climate Change Vulnerability Index (CCVI) presented in Table 5 shows that rice farming households in the tropical forest are more vulnerable to extreme climate events than in the derived savannah. On the vulnerability scale, Ise Orun local government area has a higher index of 0.11 compared with 0.03 of Oye local government area. Rice farmers in the tropical forest zone are more vulnerable to extremes of maximum temperature and maximum rainfall than their fellow farmers in the derived savannah although both groups were still on the same interval scale. The composite vulnerability indices computed reveals an overall low vulnerability. This result supports previous studies conducted by [22], and [6] that in comparison with other African countries, Nigeria ranks among the low vulnerables to climate change. Nevertheless, some agro-ecological zones are rank highly vulnerable than others, thereby exhibit different resilient capacities to severe impacts of climate change.
|
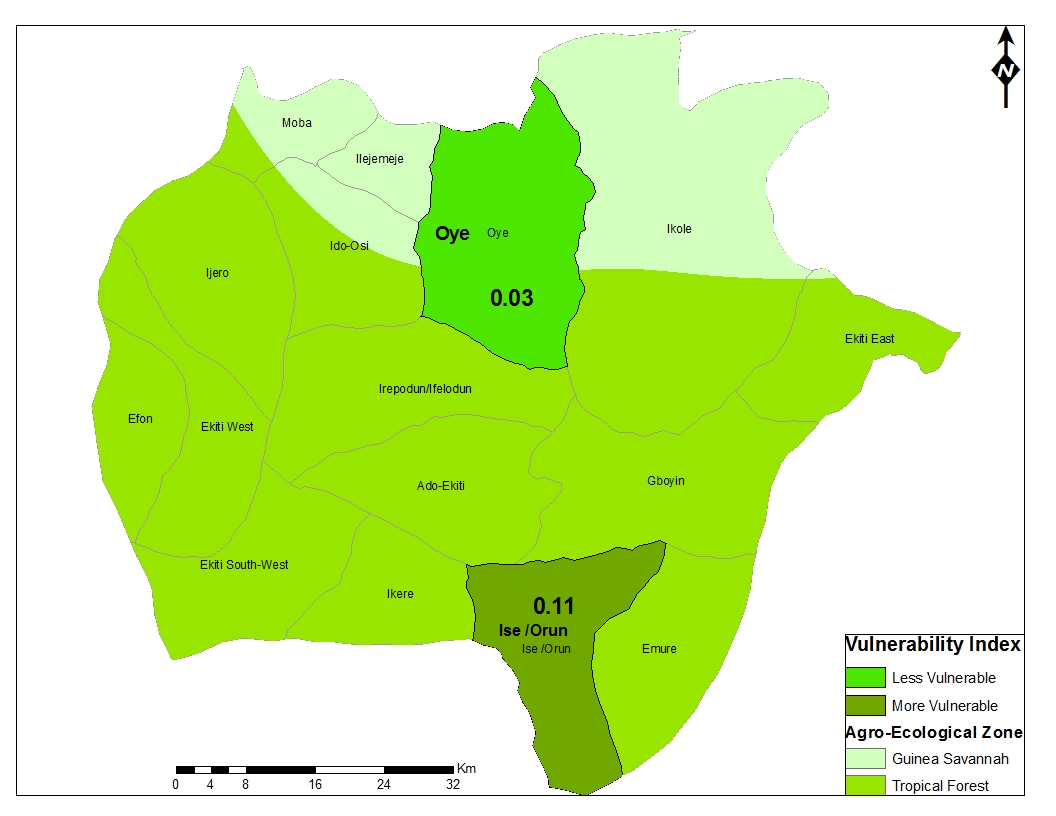 | Figure 2. Climate Change Vulnerability Map of Rice Farmers |
4.5. Sub-Component Vulnerability Indices
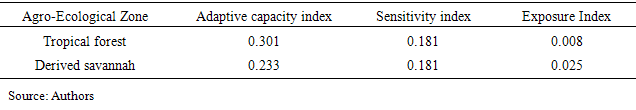
- The sub-components vulnerability indices presented in Table 6 explains that although sensitivity indices were the same in both AEZs, adaptive capacity and exposure component indices were both lower in the tropical forest zone. Despite that rice farmers in the tropical forest zone has lower exposure index, their lower adaptive capacity make them more vulnerable to extreme climates than farming households in the derived savannah of Ekiti State. Figure 3 presents the spatial vulnerability representation of the contributing factors of the rice farmers’ vulnerability index in Ekiti State, Nigeria.
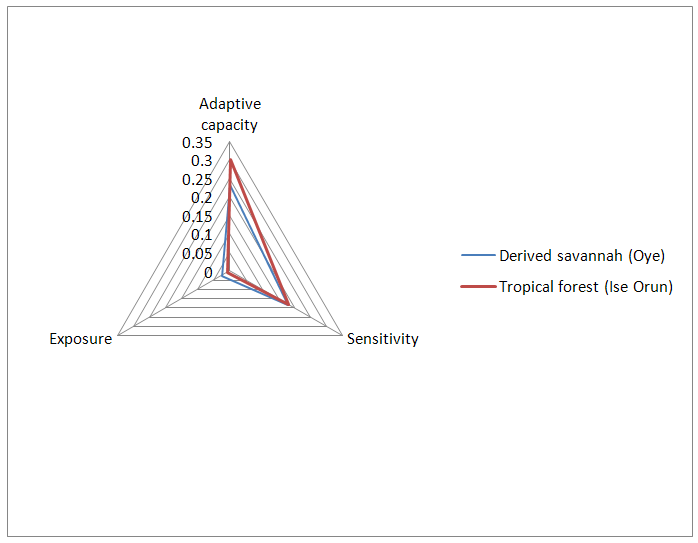 | Figure 3. Vulnerability Triangle Diagram of Determinants of Rice Farmers Vulnerability |
|
4.5.1. Sensitivity Subcomponents Indicators
- Figure 4 explains the magnitude of each sub-component of sensitivity variable contributed to the overall climate change vulnerability scores of rice farmers in Ise Orun and Oye LGAs respectively. Critical observation reveals that socioeconomic variables were the major contributors to vulnerability in the tropical forest zone while it was human capital in the derived savannah. Therefore, agricultural, geographical landscape, and human capital factors were not significant to increase in the level of farmers’ vulnerability in the forest zone.
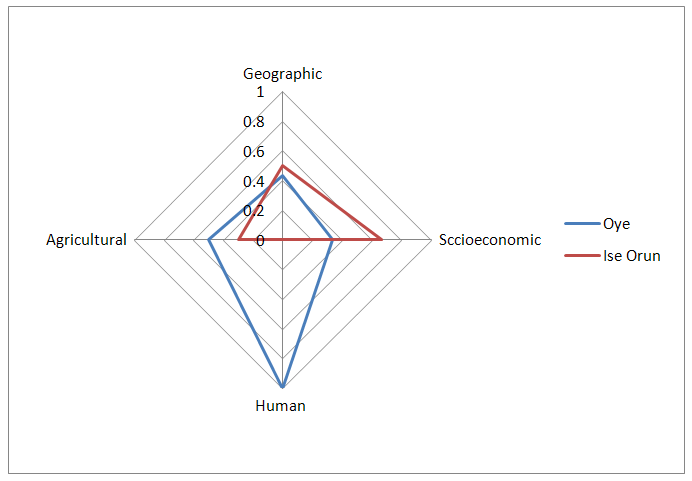 | Figure 4. Vulnerability Radar Diagram of Sensitivity Indicators to Rice Farmers’ Vulnerability |
4.5.2. Adaptive Capacity Subcomponents Indicators
- Figure 5 provides further insights that wealth and assets, education infrastructure, and basic social amenities of sampled rice producers were not important contributors to adaptive capacity in Ise Orun (tropical forest) but education infrastructure in Oye (derived Savannah) is the only significant sub-component contributor reducing farmers vulnerability. However, presence of support institutions in Ise Orun serves as a major coping strategy capable of reducing vulnerability. Outside inadequate support institutions, there were other factors responsible to higher vulnerability in Ise Orun in comparison with other components of vulnerability.
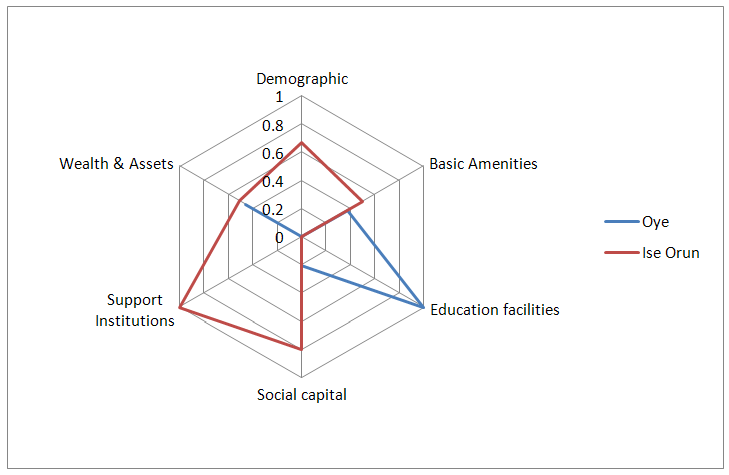 | Figure 5. Vulnerability Spider Diagram of Adaptive Capacity Indicators |
5. Conclusions and Policy Issues
- The climate change vulnerability index obtained from this study will assist decision makers, donor organizations, and government in making decisions with regard to climate-smart developments and interventions to reduce vulnerability of rural farming households in Ekiti State.The composite vulnerability index explains that rice farmers in Ise Orun (forest zone) are more vulnerable to adverse climate events than their fellows in Oye local government area (derived savannah.) of Ekiti State. The sub-components of sensitivity revealed that inadequate socioeconomic factors contributed higher quotient to the increase in farmers’ vulnerability in the forest agro-ecological zone while human capital variables are higher in derived savannah, hence have accounted for lower vulnerability. Inadequate agricultural supports, geographic and human capital variables were responsible for higher vulnerability in Ise Orun local government area unlike in derived savannah. Wealth and assets, education infrastructure, and basic amenities were not significant to increase farmers’ adaptive capacity in the forest zone. The outcomes from this study suggest that larger adaptation finance and resources should be directed towards increasing farmers’ resilience in Ise Orun in the forest agro-ecological zone because of lack of government supports and infrastructure compared with Oye in the derived savannah. Local government institutions in Ise Orun should be allocated more with adaptation interventions than Oye, in order to provide education facilities, social amenities and enabling infrastructure that will enhance farmers’ wealth and assets. More adaptation resources should be transferred directly to the stakeholders in Ise Orun due to higher vulnerability than Oye rather than re-allocation based on sentiments and politicians’ discretion. Continuous monitoring of the degree of vulnerability will serve as a pointer on the development scale and give reliable information for adaptation distributions towards a broader development planning in Ekiti State.