-
Paper Information
- Previous Paper
- Paper Submission
-
Journal Information
- About This Journal
- Editorial Board
- Current Issue
- Archive
- Author Guidelines
- Contact Us
World Environment
p-ISSN: 2163-1573 e-ISSN: 2163-1581
2015; 5(2): 77-79
doi:10.5923/j.env.20150502.05
Toxins in Newtown Creek
 Abstract
 Reference
 Full-Text PDF
 Full-text HTML
Burl Yearwood, Cho Cho Aung, Ridima Pradhan, Jennifer Vance
Natural Sciences, LaGuardia Community College, Long Island City, United States
Correspondence to: Jennifer Vance, Natural Sciences, LaGuardia Community College, Long Island City, United States.
| Email: |  |
Copyright © 2015 Scientific & Academic Publishing. All Rights Reserved.
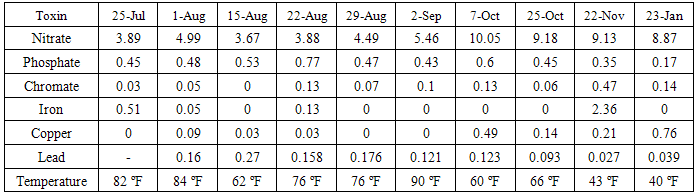
Newtown Creek is a 3.5 mile river which empties into the East River in New York, United States. The river runs the boundary between the Queens and Brooklyn Burroughs. A thriving sight of industry, this river has been the location of much pollution for over a century. Battered by oil spills and oil seepage, raw sewage, trash carried by rain water, cement, animal fat, and a 15 meter sludge on the bottom of the riverbed, Newtown Creek is one of the most polluted waterways in the United States. In this article, data for nitrate, phosphate, lead, copper, dissolved iron, and chromate were collected over 6 months. Levels of lead were 10 times higher than the drinking water limit, and then diminished greatly over the 6 months.
Keywords: Nitrate, Chromate, Phosphate, Lead, Copper, Iron, Newtown Creek
Cite this paper: Burl Yearwood, Cho Cho Aung, Ridima Pradhan, Jennifer Vance, Toxins in Newtown Creek, World Environment, Vol. 5 No. 2, 2015, pp. 77-79. doi: 10.5923/j.env.20150502.05.
Article Outline
1. Introduction
- With an extensive history of pollution, Newtown Creek has been the site of multiple oil refineries for over a century. Early articles describing the creek, include the explicit depictions of the pungent odor of oil [1]. The amount of oil estimated to have been leaked into the creek is between 17-30 million gallons [64-114 million liters], which is twice the amount of oil spilt by the infamous Exxon Valdez [2]. Dumping of cement and animal fat occurred as well. In fact the bottom of the creek is coated in 15 feet of sludge, which has been nicknamed “black mayonnaise” [3]. Since 1866, New York City has also contaminated the creek when combined sewer overflows carry raw sewage and garbage into the waterway [4]. In September, 2010 Newtown Creek was designated as a Region 2 superfund site by the Environmental Protection Agency (EPA). A superfund site is designated as a hazardous waste area, which the EPA will oversee the remediation. Either the polluting parties pay for the clean-up, or the government pays. In the case of Newtown Creek several oil companies are being held responsible for a portion of the payment [4, 5]. Since the superfund site designation, the EPA has been characterizing the toxins present in the river. The toxins included polychlorinated biphenyls (PCBs), volatile organic compounds (VOCs), pesticides, and heavy metals [4]. Our team investigated the presence of nitrate, phosphate, lead, copper, dissolved iron, and chromate in Newtown Creek over 6 months, from August to January of 2014-2015. Our aim was to quantify these pollutants and compare them to the accepted levels. Samples were taken from Whale creek, which is part of Newtown Creek (Figure 1). The Newtown Creek Wastewater plant, Allocco Recycling Corporation, and Sims Metal Management are in this immediate area.
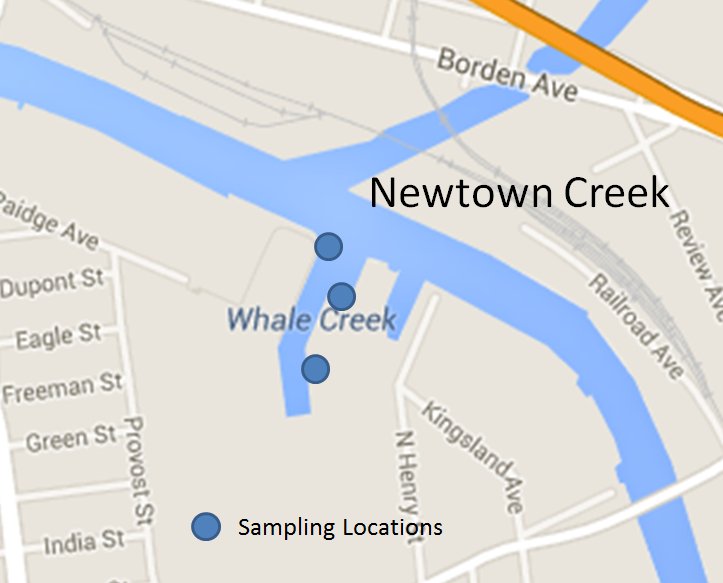 | Figure 1. Map of Newtown Creek and Whale Creek |
|
2. Materials and Methods
- For this investigation, three 1L water samples from Whale Creek, which is part of Newtown Creek, by the Newtown Creek Nature Walk were collected and analysed the same day, except for the January 23 sample (3 days later). The samples were tested for phosphate, nitrate, dissolved iron, chromate, and copper using the CHEMetrics instrumental kits and the CHEMetrics V-2000 Multi-Analyte Photometer. Lead was determined with the Lead TNTplus kit offered by HACH. The samples underwent a predigestion with the Metals Prep Set TNTplus kit. Samples were analysed using the UV-spectrophotometer, DR5000 by HACH.
3. Results and Discussion
- The U.S. EPA Maximum Contaminant Level (MCL) for drinking water for nitrate (NO3-) is 10 ppm [6]. The levels recorded from August to January were either below or about 10 ppm (Figure 2). High levels of nitrate consumed can lead to difficulties absorbing oxygen into the blood, and high levels of nitrate in a river can lead to large algae growth.
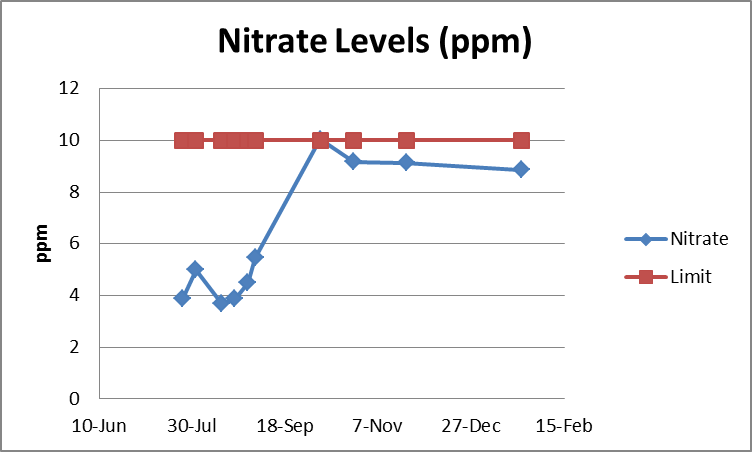 | Figure 2. Nitrate Levels |
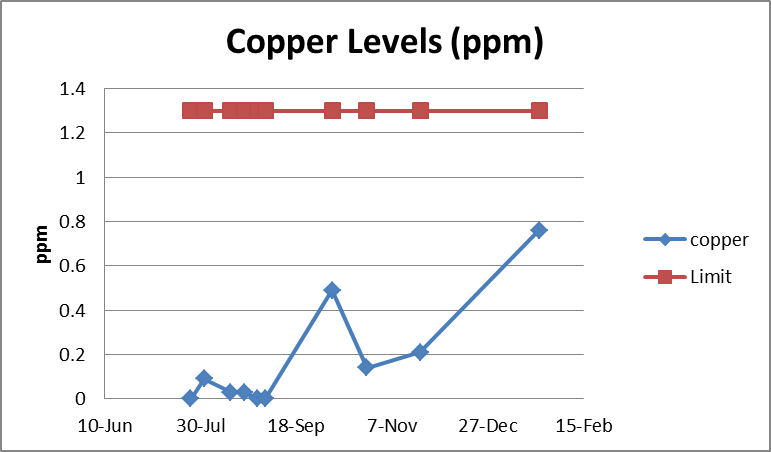 | Figure 3. Copper Levels |
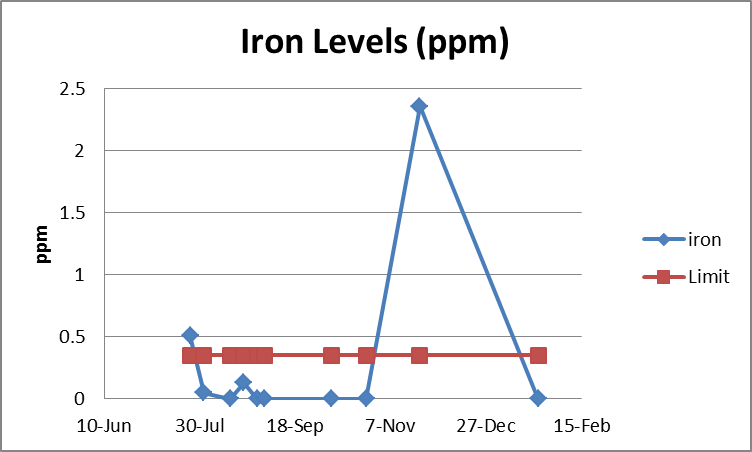 | Figure 4. Iron Levels |
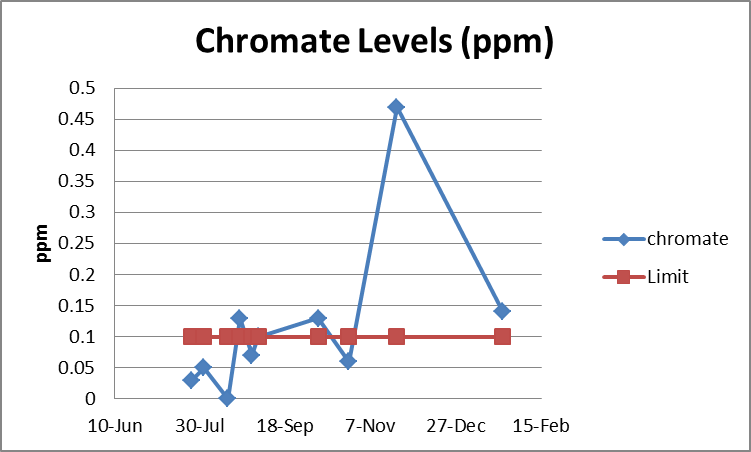 | Figure 5. Chromate Levels |
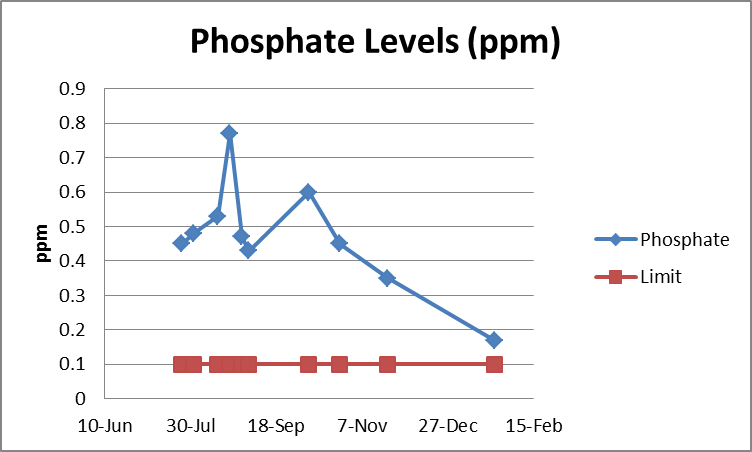 | Figure 6. Phosphate Levels |
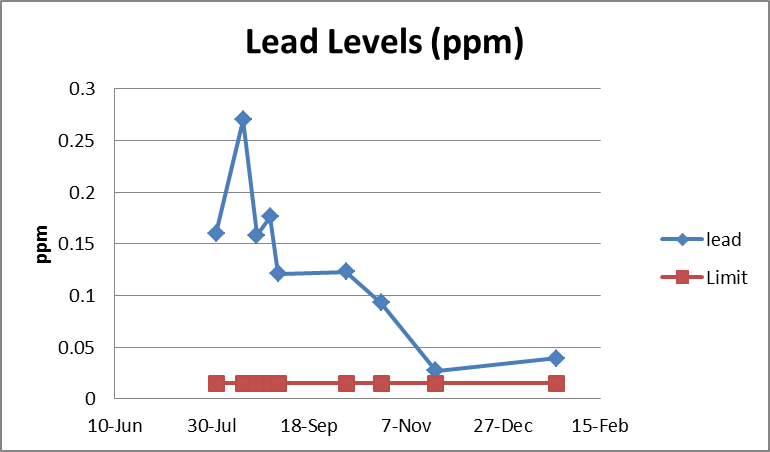 | Figure 7. Lead Levels |
4. Conclusions
- Over 6 months, nitrate, phosphate, copper, iron, chromate, and lead were measured. The lead levels were at least ten times greater than the MCL for lead, and diminished greatly in November. Perhaps the lead is being leached from pipes and the cooler temperatures mitigate this process. In addition the chromate level and iron levels spiked in November. Perhaps this was due to some form of pollution being added to the creek during that time period. We plan to continue to monitor these toxins at Newtown Creek.
ACKNOWLEDGEMENTS
- The authors gratefully acknowledge the support and funding by the City University of New York (CUNY) Research Scholars Program.
References
| [1] | Hurley, A., 1994, Creating ecological wastelands oil pollution in New York City, 1870-1900. Journal of Urban History. 20, 340-363. |
| [2] | Navarro, M. (2010) Between Queens and Brooklyn, an Oil Spills Legacy. New York Times.[Online]. Available: http://www.nytimes.com/2010/08/04/science/earth/04newtown.html?hp. |
| [3] | Smith, P. A. (2013) Liquid Cow and Black Mayo. New York Magazine. [Online]. Available: http://nymag.com/news/intelligencer/newtown-creek-2013-12/. |
| [4] | U.S. Environmental Protection Agency. (2015) Newtown Creek. Retrieved March 17, 2015, from http://www.epa.gov/region2/superfund/npl/newtowncreek/. |
| [5] | Durkin, E. (2009) Exxon Mobil, BP, National Grid and Phelps Dodge to pay for Newtown Creek cleanup phase. NY Daily News. [Online] Available: http://www.nydailynews.com/new-york/brooklyn/ |
| [6] | United States Environmental Protection Agency. (2015) Drinking Water Contaminants. Retrieved March 17, 2015, from http://water.epa.gov/drink/contaminants/. |
| [7] | Phippen, B.; Horvath, C.; Nordin, R.; Nagpal, N., 2008 Ambient Water Quality Guidelines for Iron. Recommended Guidelines. 978-0-7726-5989-7 Retrieved March 17, 2015 from http://www.env.gov.bc.ca/wat/wq/BCguidelines/iron/iron_overview.pdf. |
| [8] | Water Sheds (2015) Phosphorus. Retrieved March 17, 2015 from http://www.water.ncsu.edu/watershedss/info/phos.html. |
| [9] | Anchor QEA, LLC (2014) Final Phase 2 Remedial Investigation Work Plan – Volume 1. Retrieved April 2, 2015 from phase_2_ri_workplan_volume1_2014_05_16.pdf. |