Jan-Erik Lane
Public Policy Institute, Belgrade
Correspondence to: Jan-Erik Lane , Public Policy Institute, Belgrade.
| Email: |  |
Copyright © 2015 Scientific & Academic Publishing. All Rights Reserved.
Abstract
The preparations for the global climate summit in Paris in October-December 2015 are in full swing. They build upon a number of similar global coordination attempts for more than two decades that have failed to result in binding agreements about limiting the four greenhouse gases emissions. Mankind is slowly poisoning the atmosphere with CO2 equivalent stuff, which constitutes the gravest form of decline of ecological capital for the planet Earth. The failure of global coordination on a reduction of greenhouse gases is not a result of faulty information, but the outcome of self-interest seeking with guile, as analysed in standard game theory. As a matter of fact, we find in the UN climate change policy-making major types of pathologies in game theory. Their simultaneous occurrence reinforces the Juggernaut problematic of global warming.
Keywords:
Mankind and global warming, One person decision - making under uncertainty, Global ecology coordination = transaction costs, The Juggernaut links between emissions, Energy and GDP
Cite this paper: Jan-Erik Lane , Global Warming and Policy Coordination: Delay, Postponement and Non-Binding Declarations, World Environment, Vol. 5 No. 2, 2015, pp. 70-76. doi: 10.5923/j.env.20150502.04.
1. Introduction
When the somewhat 190 governments of the world come together under the UN climate change program or when the G20 group of nations, representing around 70 per cent of global population, meet to discuss ecological policy-making, this sets up a set of strategic interaction among people, representing the legal entity of a state. They have to overcome the inherent difficulties in collective choice, analysed in mainstream game theory. Here, I focus uponpathologies that may result, when self-interest seeking with guile prevails over the altruistic search for the Pareto-optimal solution for planet Earth.
1.1. A Game Against Nature, or Mankind Versus the Future of the Planet
First, we look upon global climate policy-making as a so-called “Game against Nature” (individual decision-making under risk). In a game against Nature, a decision-maker attempts to make a rational decision in a situation of uncertainty. In ecological policy-making, the actor is the UN or the G20, and the uncertainty they face is global warming and its consequences – good or bad.The general structure of a game against Nature (one person game theory) is as follows:1) The actor; 2) Alternatives of action (policy); 3) Outcomes: favourable or unfavourable; 4) Decision rule: avoid the worst outcome or maximize expected value.In global ecological policy-making, the actor is a collective group of states, either the 190 UN group or the G20 group. The alternatives of policy include resilience (do nothing) or precaution (take preventive actions). The outcomes range from global warming at 1 degree plus to 6 or more degrees plus, which would be the worst possible outcome for mankind. Individual decision-makers like human beings solve the game against Nature by either avoiding the worst outcome (minmax) or calculate the expected value over the alternatives and their probable outcomes (maxmin). Risk prone persons would go for the maxmax and receive the worst (minmin). When objective probabilities are lacking, the rational decision-making resorts to subjective probabilities plus successive updating with Bayes’ rule.Whether one employs the minimax rule of avoiding the worst possible outcome or the expected value rule of securing the maxmin gain, the risks involved and the evidence available now favours some global action coordination to reduce the greenhouse gases, i.e. precaution. Yet, the world slips forwards on the basis of resilience: wait and see, tale action ex post.All the difficulties in global environmental policy-making appear in this model of choice under uncertainty:a) Who decides? When many governments come together to decide upon the goals and means of global policy, then the requirement of unanimity is conducive to huge transaction costs;b) The various governments differ greatly in their estimates of probabilities and outcome costs involved in the alternatives of action, meaning resilience will be the outcome by default;c) Countries already hit by the consequences of global warming favour precaution, whereas other countries prefer to wait and see – resilience;d) When preventive measures harm the prospects of economic growth, countries differ in how they trade off the two entities. Opportunistic action strategies – preference distortion, delay reneging – come in as a major disturbance of the possibility of collective rationality.Given these hinders to a global ecology policy, it is little likely that any such endeavours will succeed in time to halt the growth in carbon equivalent emissions. There will much discussion about what to do, but little consensus upon concrete policies – resilience taking precedence over precaution. A major source of conflict is the confusion of greenhouse gases per capita and total emissions, which has bearing upon the distribution of costs with any common ecology policy.
2. Transaction Costs
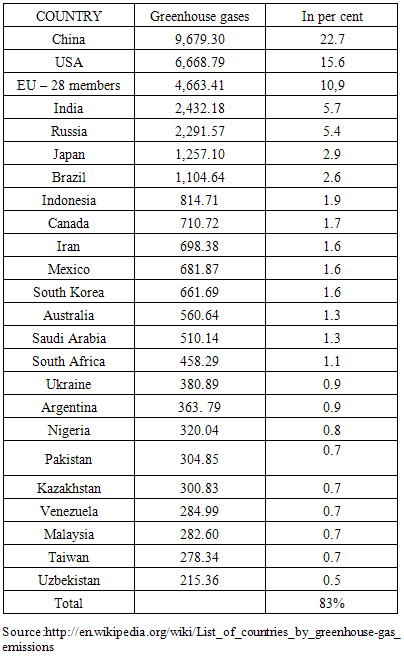
When global warming policy-making is modelled as a game against nature, then it is taken for granted that the actor is identified. But is mankind really an actor? Of course not in the meaning of individual decision-making under uncertainty. In stead, global policy-making requires the coordination of the government of the world, or some subset of them like the G20 group. The game is transformed into social choice gaming. Given the principle of the sovereignty of states, collective action by a group of government is based upon the rule of unanimity, the outcome of which is huge transaction costs that favours resilience.In the debate about greenhouse gases and CO2 emissions, one tends to mix up the basic numbers. It is vital to distinguish between total emissions and per capita emissions, when comparing countries in ecological policy-making.Let us first draw a picture of the total emissions by means of a list of the ones with most emissions, measured in millions of metric tons (Table 1).Table 1. Countries with most emissions of greenhouse gases (mt) 2010
 |
| |
|
The structure of total emissions of greenhouse gases for global policy-making entails that what a mere 20 countries, responsible for 80 per cent of them, do will decides the outcomes. Were they to reduce their emissions by 5 per cent a year, it would have a tremendous impact upon the risks of climate change. Total emissions are a function of huge economy, sizeable affluence and Soviet legacy. But instead the UN orchestrates mega reunions with all states of the world and confuses total emissions with emissions per capita.Figure 1 shows that the list of countries with very high CO2 emissions per person is very different from Figure 1. It includes a number of tiny countries that are little relevant for the global policy aim to reduce emissions significantly, sooner than later. | Figure 1. Per capita emission. Source: http://www.conferenceboard.ca/hcp/details/environment/greenhouse-gas-emissions.aspx |
It may seem fair that all countries contribute to reduce greenhouse gases like CO2 emissions, but it is not efficient to focus upon emissions per capita.JUGGERNAUT: GDP, Energy and EmissionsThe inability to halt the expansion of greenhouse gases and to stem the strong increase in yearly emissions since 1980 as well as to possibly reverse the trend depends upon very strong forces in the global market economy. The consumption of cheap energy is a key element in the steady growth in total economic output. And energy is strongly linked with emissions of greenhouse gases. Mankind needs to undo these links between GDP, energy and emissions by new technology, but it will be costly and may hurt rapid economic development in countries that aim at catching+up.a) Emissions GrowthGiven the enormous risks for mankind in relation to the probability of the worst-case scenario of climate change – 6 degrees or more, it seems negligent on the part of the world powers not to do more. The emission increase in all four types of greenhouse gases is formidable – see Figure 2. | Figure 2. Emissions of greenhouse gases |
It is the carbon dioxide emission that has kept going up to a level of almost 40 gigatons in 2013. Planet Earth can absorb less and less of these outputs, especially as global forests are decreasing and the acidification of the oceans increase. Thus, the concentration of these four gases increases year in and year out with attending rise in global temperature (Figure 3).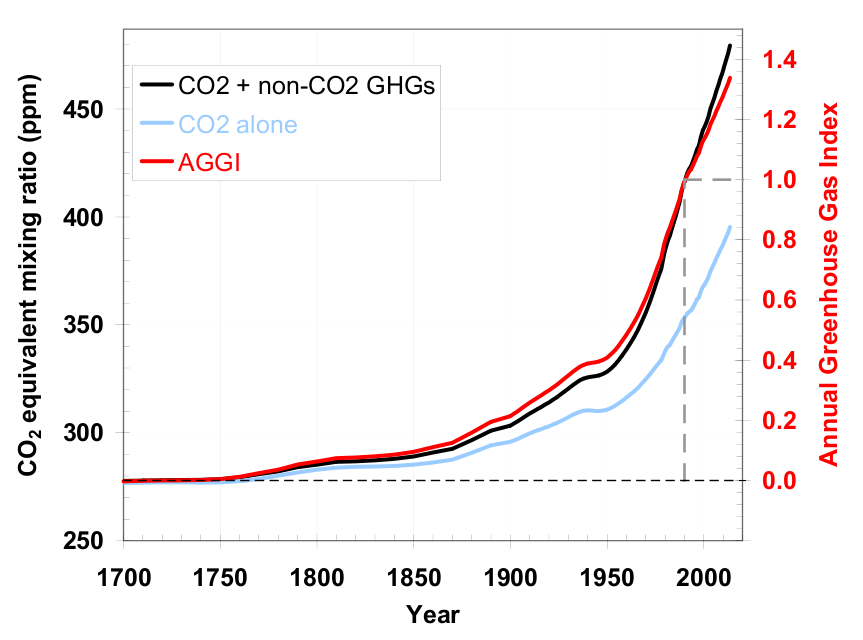 | Figure 3. Increase in the emission of greenhouse gases. (Source: http://www.esrl.noaa.gov/gmd/aggi/aggi.fig5.png) |
b) The Links: GDP- Energy – EmissionsWhat makes the process of global warming seemingly unstoppable is that it is driven by the most mundane incentive among human being, the quest for income and wealth. In order to produce decent living conditions, men and women search for economic development or the growth in GDP. Yet, Figure 4 shows that on the global macro level, the variation in economic development has strong implications for the emission of all kinds of greenhouse gases: the richer and larger a country economy, the more emissions it releases. This finding is, of course, the rationale for the argument that we need another kind of economic growth that builds upon carbon neutral technology. This is no doubt feasible in theory, but in practice we are stuck with the fossil fuel economy. And the destruction of forests and fresh water sources continue.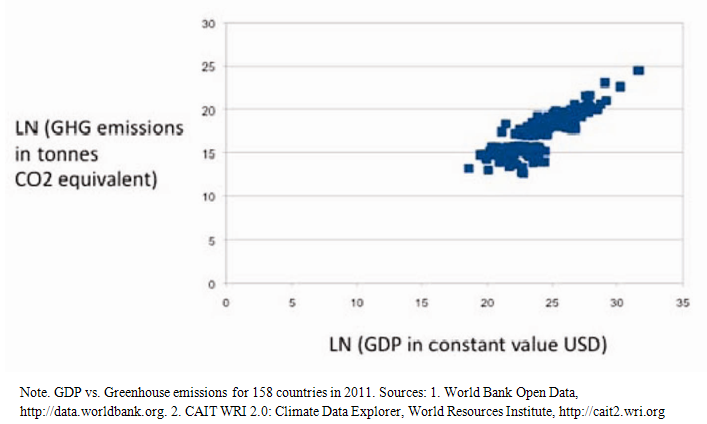 | Figure 4. Total emissions and GDP: Equation: LN GDP - LN GHG Total: y=0.81x , R2 = 0.708 |
At global reunions among the politicians and experts, there is much talk about the emissions per capita. Developing countries underline that they tend to display lower emissions per capita than advanced economies. But total emissions count for the policy aim of reducing considerably the poisoning of the atmosphere!Economic development can, I emphasize again, be environmental friendly. Many micro projects have reduced carbon emissions and yet delivered goods and services more efficiently. However, what counts at the macro level is the overall addition and subtractions. Take the example for Singapore that is well aware of the energy-environmental conundrum. Although it must be admitted that Singapore is doing many advanced projects to promote ecological sustainability, it should be pointed out that it is a big hub for air traffic and see shipping, which both result in greenhouse gases. In addition, Singapore has coal fired power stations and consumer huge amounts of electricity (water cleaning, waste treatment, air conditioning in almost all housing and public buildings). The same contradictory finding applies to the UAE where lots of investments are done in ecologically friendly projects. But the fact remains that CO2 emissions per capita here are the largest in the world, like Qatar. To understand the close link between total GDP and total emissions one needs to look at global energy consumption.Economic activity in all forms consumes directly or indirectly huge amounts of energy. This leads to the emission of greenhouse gases, directly or indirectly. To take a somewhat drastic example: the rapid increase in consumption of meat energy has resulted in an enormous growth of the number of cows in the world, which produce methane that is very conducive to climate change and global warming. It is also the case that rich countries consume more energy per person than poor countries, as higher levels of affluence require more energy – in general. Again, the situation is paradoxical, as rich countries can invest in environment friendly technology but they also consume more energy for upholding their lifestyle. Figure 5 has the finding. | Figure 5. Total greenhouse gases and total energy consumption: Equation: Energy - emissions: y = 1,223x, R2 = 0,616, N=173 |
It is evident from the Figure 5 above that efforts should be undertaken to shift towards energy from carbon neutral sources, including reducing the greenhouse gases from fossil energy sources. If Shanghai can build a coal fired power station with no carbon dioxide emissions, then so can all Chinese cities or villages.The combination of the choice of resilience in the basic game against Nature with the accumulation of massive transaction costs at global reunions leads only to the rapid decline in overall environmental capital. Ecology capital decreases, because there is no owner, mankind being just represented by some 190 governments in chaotic social choice settings at various places around the globe.
3. Overall Decline in Ecological Capital
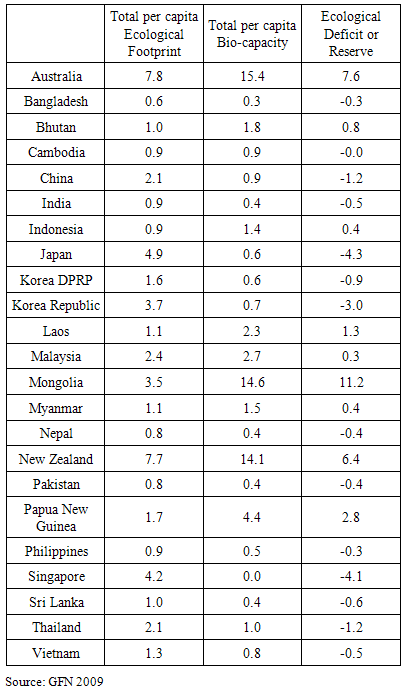
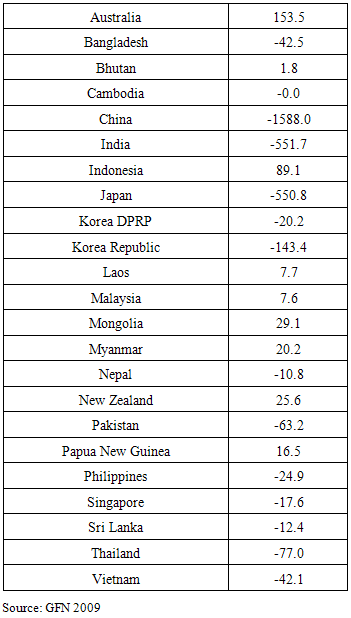
To measure the decrease in global ecological capital is far more cumbersome a task than to measure economic capital in the conventional sense. Yet, ecological capital is more tangible and easier to estimate than the recently much debated form of capital in the social sciences, viz social capital. It remains elusive and difficult to pin down in some index.Approaching the decline in global environmental capital, one may target recent evidence about various phenomena, like the following:- The decrease in the number of species, although this has been contested;- The increase in the number of endangered animals;- The overfishing of lakes, seas and oceans;- The increased pollution of the oceans;- The concentration of human population in huge urban sites without proper sanitation and access to fresh water;- The slow vanishing of the rain forests and the huge forests in Siberia;- The slow growth of desert areas;- The shrinking of large lakes;- The growing fresh water shortages;- The pollution of the atmosphere by greenhouse gases, leading to climate change and global warming.All of these phenomena and development above reduce the amount of ecological capital on Planet Earth. There is no one single indicator on this loss of environmental capital. The so-called Ecological Footprint Framework (EFF) launched an ambitious attempt to come up with a single measure on the supply of environmental resources and the demand for them by using the so-called “global hectar per capita measure (http://www.eea.europa.eu/highlights/Ann1132753060). The idea to have most general or encompassing measure on both environmental capital (supply) and human pollution (demand) is an interesting one. But it is not easy to devise or calculate such a measure. Based on an enormous input of information and effort, these environmentalists come up with what is basically an economic type model with supply and demand. The conclusion that Planet Earth and thus mankind is running a serious and increasing deficit between demand and supply, resulting in an increasing reduction of global ecological capital. This framework is no doubt ingenious, attempting to cover all aspects and dimensions of environmental capital. But there are some problems here in the EF approach.Table 2 shows such a footprint analysis for demand and supply for some Asian countries, employing per capita measures only, according to the Global Footprint Framework (2009).Table 2. EAST ASIA and OCEANIA: Total Ecological Footprint, Bio-capacity and Net Result for 2005
 |
| |
|
Matters are complex, although the ecological footprint is much bigger per capita in richer countries than in poorer ones, with country specific factors playing a large role in shaping eventual surpluses or deficits. Overall, it seems that ecological footprints vary positively with country affluence, while bio-capacity is determined by a host of other factors besides affluence. But when country size is added to the equation, the numbers in Table 2 are totally transformed and quite another picture emerges - see Table 3. What matters crucially is the size of the country in terms of the number of inhabitants.Table 3. Total Ecological Impact (Deficit/Surplus/Person X Population) 2005
 |
| |
|
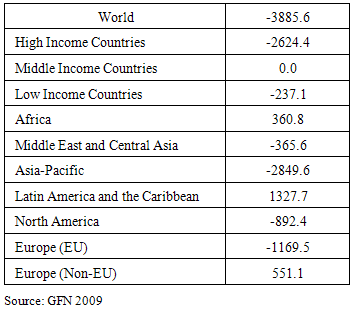
When the total ecological imprint is estimated, taking population size into account, it is no longer tenable to argue that global ecological footprint follows affluence. On the contrary, poor or medium income countries with large populations may have much more ecological impact than small super affluent countries. China and India are big polluters in the Asia-Pacific region. Interestingly, although the average person in Papua New Guinea pollutes more than the average in Bangladesh, the total outcome is much more severe in the latter country, as the number of people is crucial when it comes to ecological footprint. Not surprisingly, the bio-capacity of Papua New Guinea is larger than that of Bangladesh, which is vulnerable to flooding and hurricanes. It is possible to compare these scores for the Asia-Pacific region with comparable scores for other regions of the world. Table 4 attempts this, using the same framework of analysis.Table 4. Global Ecological Impact (Deficit/Surplus/person X population) 2005
 |
| |
|
The positive numbers for Latin America include the high bio-capacity for Brazil, Bolivia and Peru – numbers that will go down quickly in the future as the rain forest disappears. The same applies to Malaysia where the rain forest in Borneo is decimated every day.
4. Conclusions
Climate change is much talked about, but little concrete action is taken. It is not a top priority for the countries with the 20-25 largest economies in the world. However, they and only they can take measures – precaution - that halt the increase in yearly emissions and start a process towards zero emissions per year. They represent the player “mankind” in this disastrous game, where we now follow the alternative “resilience” that may give us the worst possible outcome in the future.
References
| [1] | Global Footprint Network 2009: http://www.footprintnetwork.org/en/index.php/GFN/ (last accessed 24/3 2009). |
| [2] | The European Environment Agency in coordination with Global Footprint Network: The National Ecological Footprint and Biocapacity Accounts, 2005 (Edition http://www.eea.europa.eu/highlights/Ann1132753060). |
| [3] | World Bank Open Data, http://data.worldbank.org.2. CAIT WRI 2.0: Climate Data Explorer, World Resources Institute, http://cait2.wri.org. World Bank Data indicators, http://data.worldbank.org/indicator. |
| [4] | Energy consumption data: Energy data Global Statistical Yearbook. Retrieved from http://yearbook.enerdata.net. |
| [5] | EIA: Energy Outlook for 2014. Retrieved from http://www.eia.gov/forecasts/aeo/. |
| [6] | Greenhouse gas emission data: World Resources Institute CAIT2. Retrieved from http://cait2.wri.org. |
| [7] | Climate Change: Rising concentration of atmospheric greenhouse gases. http://www.dnrec.delaware.gov/ClimateChange/Pages. |
| [8] | Butler, J.H. and S.A. Montzka THE NOAA ANNUAL GREENHOUSE GAS INDEX (AGGI): NOAA Earth System Research Laboratory, R/GMD, 325 Broadway, Boulder, CO 80305-3328, http://www.esrl.noaa.gov/gmd/aggi/aggi.html. |
| [9] | Greenhouse Gas (GHG) Emissions. The Conference Board of Canada, 2015, http://www.conferenceboard.ca/hcp/details/environment/greenhouse-gas-emissions.aspx. |
 Abstract
 Reference
 Full-Text PDF
 Full-text HTML