-
Paper Information
- Paper Submission
-
Journal Information
- About This Journal
- Editorial Board
- Current Issue
- Archive
- Author Guidelines
- Contact Us
World Environment
p-ISSN: 2163-1573 e-ISSN: 2163-1581
2015; 5(2): 47-51
doi:10.5923/j.env.20150502.01
A Comprehensive Review on the Factors Influencing the Rate of Utilizing Bike-Sharing Systems
 Abstract
 Reference
 Full-Text PDF
 Full-text HTML
Siavash Shahsavaripour
School of Civil and Environmental Engineering, University of New South Wales (UNSW), Sydney, Australia
Correspondence to: Siavash Shahsavaripour , School of Civil and Environmental Engineering, University of New South Wales (UNSW), Sydney, Australia.
| Email: |  |
Copyright © 2015 Scientific & Academic Publishing. All Rights Reserved.
A comprehensive review was performed on the factors influencing the rate of utilizing bike-sharing systems. It was found that there are various factors which were mentioned in previous studies including, but not limited to, location, time of year, time of counts, population density, employment density, ratio of workers to population and worker density. The primary factors are time of day, season, population and employment densities, mix of use, bicycle facility type, traffic volume, rain and temperature, income and age. Further, six different types of bike-sharing partnerships were described and their advantages and disadvantages were discussed, in detail. Moreover, four costs of bike-sharing systems as direct capital costs, direct operational costs, associated capital costs and associated operating costs were briefly discussed.
Keywords: Bike-Sharing Use, Temporal, Land Use, Bicycle Facility, Traffic, Weather, Topography, Demographics
Cite this paper: Siavash Shahsavaripour , A Comprehensive Review on the Factors Influencing the Rate of Utilizing Bike-Sharing Systems, World Environment, Vol. 5 No. 2, 2015, pp. 47-51. doi: 10.5923/j.env.20150502.01.
Article Outline
1. Introduction
- The morning peak hour from 6 AM to 9 AM is the best time to count bicycle users since 95% of bicycles can be observed in this period of time [1-8]. Therefore, they were recommended counting bicyclists during the morning peak hours to capture a consistent snapshot of the vast majority of activity [8-10].Various methods and tools were used by Schwartz et al. (1999) to forecast non-motorized travel demand. They also were suggested making weekday counts by assuming that the peak period represents 10% of the daily usage [9, 10].Niemeier (1996) was concluded that the variability found in bicycle volumes may be related to many factors including location, time of year and time of counts. The locations were chosen for the study shown greater variability in the PM peak period than in the AM peak period. This were suggested that the AM peak-period counts appear, generally, more useful for estimating bicycle commuter flow [11].Variability in changes of volume of bike sharing usage is depending on which month of the year is chosen for counting the bike sharing usage (Niemeier, 1996). For example, bike sharing usage in summer is higher than in winter since the weather in winter is not suitable for biking [12].Turner et al. (1997) were introduced a Bicycle Needs Index, developed by the North Texas Council of Government (NTCOG), which uses a regression equation between bicycle mode share and a series of factors within the Transportation Analysis Process (TAP) Zone [13, 14, 16, and 18]. The factors include percentage of residents under sixteen years of age, number of hours worked per week, percentage of land devoted to employment uses, population density, employment density, population density of residential land uses and ratio of workers to population. Their recent report in 2009 was suggested that they use only four factors to calculate bicycle needs index: percentage of total trips 5 miles or less, employment density, population density and median household income [13-19].Parkin et al. (2008) were concluded that an increase in population density has the effect of increasing the likelihood of cycling or the journey to work [20]. This result appears reasonable, given that cycling can be expected to be more attractive in more tightly packed and localized neighborhoods because of increased parking problems and because the finer grain will be less conducive to motorized travel [21]. This effect could stem from journey distance, but it was not highly correlated with population density [22].Pinjari et al. (2009) were pointed out the possibility that employment, residential, and travel choices are not independent of each other and those individuals and households adjust with combinations of short-term travel-related and long-term location-choice-related behavioral responses to land-use and transportation policies [23-31].McCahil et al. (2008) were concluded that the two important variables are population density and worker density; the strongest two-variable model described bicycle volumes in terms of population density and worker density within each volume count location’s census tract [32, 33]. The weighting factor of 2.5 for calculating the bicycle needs index were suggested by Turner et al. (1997) since the employment density is as important as population density [34].Pinjari et al. (2009), similar to population density, were inferred that employment, residential, and travel choices are not independent of each other and those individuals and households adjust with combinations of short-term travel-related and long-term location-choice-related behavioral responses to land-use and transportation policies [35].Population density and worker density are two important factors that describe bicycle volumes within each volume count location’s census tract [36]. Also Turner et al. (1997) were concluded that the employment density is one of the necessary factors to estimate bicycle trip generation [37]. The width of bicycle lane is not as important as the number of effective bicycle lanes. Also, each additional bicycle lane will increase the number of bicycle users, dramatically [38].Three different categories of bike sharing facilities were introduced by Hunt et al. (2007) as:(1) mixed traffic, where cyclists share the full roadway with other traffic without any longitudinal separation;(2) bicycle lane, where cyclists use the roadway with other traffic but have a separate lane that is longitudinally separated from the other traffic lanes and is exclusively for cyclists, and;(3) bicycle path, a separate facility that is typically much narrower than a roadway exclusively used by cyclists or share with other non-motorized traffic (Bicycle planning, best practices and count methodology university of Washington, 2010).In order to attract commuters to use bicycle, design standards for bicycle facilities and networks are primarily generated from the American Association of State Highway and Transportation Official’s (AASHTO) Guide for the Development of Bicycle Facilities and the Federal Highway Administration’s Manual on Uniform Traffic Control Devices [37, 38].Bicycle traffic volume is depending on the quality of bicycle facilities. Specific information about the safety and comfort of cyclist, such as the speed and volume of motor vehicle traffic, is necessary to measure the quality [39].Jones et al. (2008) were concluded that several factors, such as measurable characteristics of a link in a road or path network (e.g., traffic volume, lane width, or pavement quality) should be considered when developing a non-motorized transportation model, or when incorporating non-motorized transportation into a traditional four-step model [40]. The use of bike sharing will be decreased by 15-20% on rainy days [41].Vancouver (2009) was used one automatic bicycle counter to analyze monthly variation in average daily bicycle volume [42]. Typically, bicycle volumes reach their peak at mid-week and fall significantly at the weekend [43]. The total number of cyclists on a rainy September day, mid-week, is closely comparable to the average daily volume of cyclists for November. Vancouver was speculated that those cyclists committed to riding on a rainy day in summer or early fall may be those who remain committed even when the weather turns cold and rainy, later in the year [44]. Temperature below 55°F (12℃) decrease bicycle volume by 27 % [45].Environmental Design and Management (2002) was used National Survey on Active Transportation in 1998, which revealed that 27% of the respondents considered weather as one of the important barriers to cycling [46].Parkin et al. (2008) were found socio-economic variables relevant to the use of bicycles, including age, sex, car ownership, income, extent of higher or further education, ethnicity, household size and marital status, type of employment and experience of cycling and engagement in other physical activities and exercises [47]. Cycling is an important means of transport for student under 16 [46, 47].People with low income will use bike sharing system more than other groups [46, 47]. The weighting factor of 1.5 to median household income is given for calculating bike sharing needs [46, 47].On the other hand, Pinjari et al. (2009) were used an activity-based approach to travel-demand analysis, in order to determine self-selection effects of bicycle use [46, 47]. Their result suggests that high-income households have a preference for out-of-home recreational activities/travel [46, 47]. They were concluded that ignoring income effects can lead to a spuriously estimated negative effect of employment density and street block density on out-of-home recreational activities/travel [46, 47].
2. Public or Private Partnership
- As illustrated in Figure 1, six models of bike sharing are introduced as governments, quasi governmental transport agencies, universities, non-profits, advertising companies and for profits. This section discusses the benefits and detriments of each model.
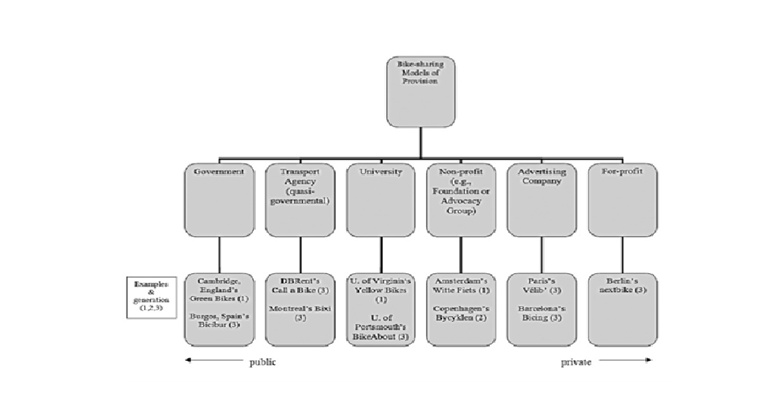 | Figure 1. Private and public partnership (Journal of Public Transportation, Vol. 12, No. 4, 2009) |
2.1. Government Model
- In this model, the local government operates bike sharing system similar to as it operate other transport systems. For example, the government of Burgos, Spain, purchased and operates a bike-sharing system called Bicibur (Civitas, 2009). With this model, the government as operator has greater control over the program.
2.2. Transport Agency Model
- The transport agency model is look like the model which mentioned in 2.1. Transport agencies, such as Deutsche Bahn of Germany and Stationnement de Montréal, are first examples. Deutsche Bahn is the national railway provider of Germany and operates a car-sharing and Call a Bike bike-sharing service. Stationnement de Montréal, the parking authority of Montréal, provides “management of municipal paid on-street and off-street parking” and the Bixi bike-sharing service. Both organizations have gotten into bike-sharing as an extension of their other transport offerings to be a well-rounded mobility provider (Deutsche Bahn, 2009; Stationnement de Montréal, 2009; DeMaio, 2009).The benefit of the quasi-government transport agency model is that the authority benefits from the experience and modernism of the bike-sharing service provider, especially in the case of national Deutsche Bahn, without needing to develop the capabilities internally. Also, both the authority and transport agency’s top priority is to provide a useful transit service, rather than earning money (DeMaio, 2009).
2.3. Universities Model
- The educational institution providing the service is called Universities model, most likely in a campus setting. Examples are the former program at the University of Portsmouth, England, and newer version such as that of St. Xavier University in Chicago (Black and Potter, undated; DeMaio, 2008b). The benefit of this model is the ability of university to expand its intra-campus transit service without relying on the authority to offer sufficient bike-sharing service on campus.
2.4. Non-Profit Model
- The non-profit model has an association which was not only created for the operation of the service but also one that enter the bike-sharing service into its existing interests. Examples of non-profit programs include the City Bike Foundation of Copenhagen, which operates Bycyklen, and the Nice Ride Minnesota program in Minneapolis (DeMaio, 2010).
2.5. Advertising Company Model
- Companies such as JCDecaux, Clear Channel Outdoor, and Cemusa, operate a bike-sharing program to an authority, usually in exchange for the right to use public space to display revenue-generating advertisements on billboards, bus shelters, and kiosks. The most important advantage of this model is that it is suitable for the governments which don’t afford to create such a system. It is one of the most famous models all around the world.
2.6. For-Profit Model
- In the for-profit model, the government is omitted since a private company operates such a system. Next bike is a prime example of this model, with a local business provides the service in a locality with flexible station system. While it is similar to the advertising company model in one hand, it differs as there is no on-street advertising contract with the locality and the for-profit keeps all revenues generated. A benefit of this model is that the private sector can start it by itself without waiting for public sector to create such a system. A loss is that the for-profit may not receive funding assistance for the service as do programs offered under other models (DeMaio, 2009).
3. Conclusions
- Costs which related to bike sharing system are categorized into four groups:● Direct capital costs (e.g., bikes and terminals);● Direct operating costs (e.g., administration, maintenance, and electricity to power terminals);● Associated capital costs (e.g., construction of the system for building the necessary infrastructure and streetscape improvements), and;● Associated operating costs (e.g., maintenance of docking infrastructure and the existing bikeway network, insurance costs).Fabrication of the bikes and stations, license or purchase of the back-end system used to operate the equipment, member access cards (if necessary), and purchase or rental of maintenance and distribution vehicles and installation are the capital cost of developing bike sharing system. Clear Channel Outdoor’s SmartBike system is estimated to have capital costs of around $3,600 per bicycle; JCDecaux’s Cyclocity system is estimated at $4,400 per bicycle; and Bixi is estimated to be $3,000 per bicycle (New York City Department of City Planning, 2009). Nice Ride Minnesota is planning to launch in 2010 using Bixi and estimates $3,200 per bike (Twin Cities Bike Share, 2008).Also, maintenance, distribution, staff, insurance, office space, storage facilities, website hosting and maintenance, and electricity (if necessary) are operating cost of such a system. New York City’s analysis of several systems concludes an average operating cost of about $1,600 per bicycle (New York City Department of City Planning, 2009).