-
Paper Information
- Previous Paper
- Paper Submission
-
Journal Information
- About This Journal
- Editorial Board
- Current Issue
- Archive
- Author Guidelines
- Contact Us
World Environment
p-ISSN: 2163-1573 e-ISSN: 2163-1581
2015; 5(1): 17-27
doi:10.5923/j.env.20150501.03
Comparison of UV Index from EP/TOMS with Ground-Based Measurements at Subtropical Location
 Abstract
 Reference
 Full-Text PDF
 Full-text HTML
Abdel Galeil. A. Hassan
Physics Department, Faculty of Science, South Valley University, Qena, Egypt
Correspondence to: Abdel Galeil. A. Hassan, Physics Department, Faculty of Science, South Valley University, Qena, Egypt.
| Email: |  |
Copyright © 2015 Scientific & Academic Publishing. All Rights Reserved.
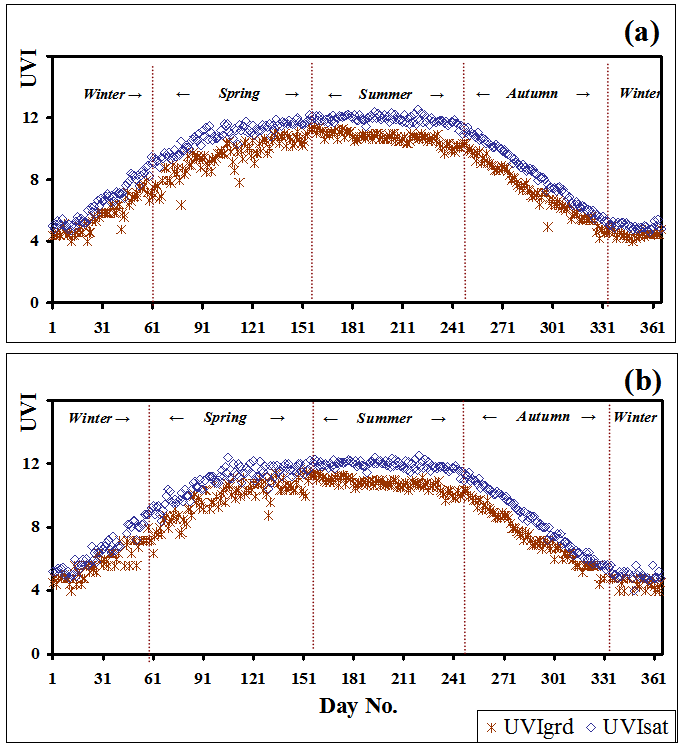
The purpose of the UV Index estimation is to help people effectively protect themselves from UV radiation, of which excessive exposure causes sunburn. UV index (UVI) has been estimated in Qena, Upper Egypt (26°17' N, 32°43' E, 97 m asl) at noon during the period (Apr. 2000 - Dec. 2005) using EP/TOMS satellite (UVIsat) and ground-based measurements (UVIgrd). Temporal variations of UVIsat and UVIgrd, also, comparison between them have been investigated. In addition, the effect of atmospheric conditions, in the form of cloud cover and aerosol index, on this comparison has been analyzed. The study revealed that, in all sky conditions, average value of UVIsat and UVIgrd were 9.39±2.60 and 8.1±2.4, respectively. While, in cloudless conditions (cloud cover CC = 0 oct.), their values became 9.98±2.39 and 8.53±2.10, respectively. In addition, the value that has more occurrence for UVIsat and UVIgrd, in both conditions (all sky and cloudless conditions), was 12 and 10, respectively. Regarding the comparison between UVIsat and UVIgrd, effects of clouds and aerosols were taken into consideration. So that, four data subsets were analyzed, subset 1: all sky conditions, subset 2: all cloudless cases, subset 3: cloudless cases with low aerosol index and subset 4: cloudy cases with low aerosol index. The study showed that UVIsat values were higher than the UVIgrd during all studied period under all studied conditions. The largest biases were found on heavy overcast days (positive biases reached to 42%).
Keywords: UV index, EP/TOMS, UVB-1 pyranometer, Clouds, Aerosol index, Qena, Egypt
Cite this paper: Abdel Galeil. A. Hassan, Comparison of UV Index from EP/TOMS with Ground-Based Measurements at Subtropical Location, World Environment, Vol. 5 No. 1, 2015, pp. 17-27. doi: 10.5923/j.env.20150501.03.
Article Outline
1. Introduction
- UV radiation can be subdivided physically according to wavelength into four divisions, mainly near UV (320–400 nm), middle UV (280–320 nm), far UV (200–280 nm), vacuum and extreme UV (100–200 nm) [1-3] Although, in the outer space, UV-A and UV-B represent about 7.5% of the total solar irradiance, at the earth's surface typically make up between 3% and 5% of the solar total irradiance [4].In the last years, the erythema has received most attention. Thus, this effect is commonly quantified weighting the solar UV radiation with the erythemal spectral response, resulting in the so called erythemal ultraviolet irradiance (EUV). In 1987 Commission Internationale de l'Eclairage (CIE), adopted curve relating UV irradiance and erythemal action spectrum currently recommended as the standard erythemal action spectrum. Therefore, the variable EUV is recognized internationally as a standard for determining the risk associated to UV radiation [5, 6]. The UV Index (UVI) has been recommended by several international organizations such as: World Meteorological Organization (WMO), World Health Organization (WHO), United Nations Environment Program (UNEP) and International Commission on Non-Ionizing Radiation (ICNIRP) as a useful tool to inform the public about the magnitude of the EUV at the earth’s surface in order to protect themselves against the potentially harmful effects of the UV radiation. The UVI is determined by multiplying EUV (expressed in W/m2) by 40 according to the joint recommendation of the WMO, WHO, UNEP and ICNIRP meeting on UV-B radiation and UV forecast in July 1997. For the general public it is usually given as an integer number, i.e. without decimals. UV intensity is described in terms of ranges running from low values (less than 2), moderate (3–5), high (6–7), very high (8–10) and extreme (11+). The clear sky value at sea level in the tropics is normally in the range 10–12 and 10 is an exceptionally high value for northern mid-latitudes. The continuous validation of satellite EUV data with ground-based measurements from well-calibrated and well-maintained instruments is an essential task for assessing the quality and accuracy of satellite data and to identify local to regional specific sources of uncertainty [7, 8]. Comparison between EUV at noon in mW/m2 from Total Ozone Mapping Spectrometer (TOMS) instruments with ground measurements has been studied by many authors [9-18] Most of these works revealed that the satellite UV data overestimate the ground-based measurements in many locations.Anton et al., 2007 [19] found that the TOMS retrievals of noon EUV irradiance compared with Brewer ground-based measurements under different sky conditions showed that TOMS overestimates the EUV data by 12% during cloud-free days, and the bias increases with the aerosol load. The comparison of EUV intensities on a normal day and on a day with high aerosol loading suggests about 24% decrease in EUV amounts on the day with high aerosol loading [19] Palancar and Toselli, (2002) [20] implied that cloud cover (CC) and aerosol loads are major factors in the UV depletion. Clouds can significantly reduce UV-B radiation if cloud cover is greater than 50% [21]. Also, Frederick and Snell, (1990) were found that the erythemal irradiance annual mean is reduced between 22% and 38% relative to the clear sky value by clouds [22].It has been shown by ground-based measurements that large reductions of UV-B occur under absorbing aerosols such as smoke from biomass burning [23-24], forest fires [25] or desert dust [26]. Kazadzis et al., (2009) found that compared UV irradiance products from OMI against ground-based Brewer measurements, showing that OMI overestimates UV spectral irradiances by 30%, 17% and 13% for 305 nm, 324 nm, and 380 nm, respectively [27]. Also, Ialongo et al., (2008) [12] showed that OMI UV data overestimate ground-based EUV values measured from both Brewer spectrophotometer and YES broadband radiometer (biases about 20%) [36] at Rome (Italy). Weihs et al., (2008) showed that OMI-Brewer differences can reach +50% under overcast conditions [18] during a validation campaign in the region of Vienna (Austria). In upper Egypt, El-Shazly et al., (2012) studied UVI in 10 locations, including Qena, and created an empirical model for estimation UVI in all sky conditions using solar declination, solar zenith angle, total ozone column, reflectivity and aerosol index as independent variables [28]. This paper aims at compare the derived UV index from EP/TOMS (UVIsat) with the derived UV index by UVB-1 Ultraviolet Pyranometer (UVIgrd) at Qena, Upper Egypt (26°17' N, 32°43' E, 97 m asl), see Figure (1). The period of study extended from April 2000 to December 2005. The effects of clouds and aerosols on these comparisons will be analyzed using four atmospheric conditions used by Anton et al., (2010) [38]. For studying the effect of aerosols we used the data of aerosol index (AI) instead of aerosol optical depth used by them.
2. Location Description
- Qena City (26°17' N, 32°43' E, 97 m asl) is located in Upper Egypt, about 600 Km south of Cairo and 60 Km north of Luxor (Figure 1). It located mainly within the narrow Nile valley which separates Egypt to two unequal dessert parts, the western and the eastern deserts. The climate of Qena is characterized by very hot and dry summer season with average daily maximum temperature T = 40℃ and average daily minimum RH = 17%, cold winter with average daily maximum temperature T = 25 and average daily minimum RH = 26% [30]. It rarely rains. It receives large quantity of solar radiation, especially in summer [29].
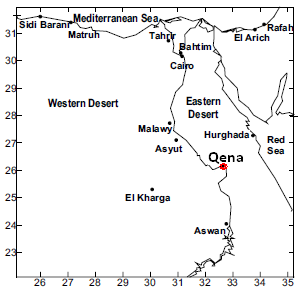 | Figure 1. The studied area, Qena, Egypt |
3. Description of Satellite and Ground Based Measurements
3.1. Satellite Observations
- The Total Ozone Mapping Spectrometer (TOMS) instrument developed by National Aeronautics and Space Administration (NASA) Goddard Space Flight Center (GSFC) was designed to enable long-term daily mapping of global distribution of the earth’s atmospheric ozone. TOMS makes 35 measurements every 8 seconds each covering a width of 30 to 125 miles (50-200 km) on the ground, strung along a line perpendicular to the satellite path motion. TOMS uses the ratio of back scattered earth radiance to solar irradiance at specific wavelength to infer total ozone [31]. Earth Probe/Total Ozone Mapping Spectrometer (EP/TOMS) was launched July 2, 1996 and the first full day of data file generation began on July 25, 1996. It provided continuous data from that time until December 2005, with the exception of a few days in Dec 1997 during which the satellite orbit was boosted from 500km to 750km, and a period in late 1998 when the instrument was in Safe hold [32].
3.1.1. Erythemal Noontime Irradiance
- Data used for determination of UVIsat is the erythemal noontime irradiance measured by (EP/TOMS) in a 1x1.25 degree grid in units of milli-watts/m2/nm which is available in ftp://toms.gsfc.nasa.gov/pub/.The weighting function used to approximate the wavelength-dependent sensitivity of Caucasian skin to erythema-causing radiation is the model proposed by McKinlay and Diffey [33]. The UVIsat is calculated using the erythemal (CIE) action spectrum. It is non-dimensional, obtained by dividing the CIE-weighted integral by 25 mWm-2 [34].
3.1.2. Reflectivity (reflc.) in % and Effective Cloud Fraction
- The solar irradiance reflected up to a spacecraft from the surface of the Earth can be used to calculate reflectivity. Reflected radiation can come from two surfaces, the ground, and the tops of clouds. Reflectivity is determined from the measurements at 360 nm in the case of Earth Probe. For a given TOMS measurement, the first step is to determine calculated radiance at 360 nm for reflection off the ground and reflection from cloud, based on the tables of calculated 360-nm radiance. For reflection from the ground, the terrain height pressure is used, and the reflectivity is assumed to be 0.08. For cloud radiance, a pressure corresponding to the cloud height from the International Satellite Cloud Climatology Project (ISCCP) based climatology is used, and the reflectivity is assumed to be 0.80 [32]. The ground radiance (Iground) and cloud radiance (Icloud) are then compared with the measured radiance Imeasured. If Iground ≤ Imeasured ≤ Icloud, and snow/ice is assumed not to be present, an effective cloud fraction f is derived using
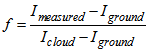 | (1) |
3.1.3. Aerosol Index (AI)
- The TOMS technique of aerosol detection and characterization is based on spectral contrast in the UV that results from the interaction between the processes of Rayleigh scattering, particle scattering and absorption. This interaction produces spectral variations of the back scattered radiance at the top of the atmosphere that can be used to separate aerosol absorption from scattering effects. Torres et al. (1998) discuss in detail the physical basis of the near UV technique of aerosol sensing [35]. The TOMS aerosol index is a measure of how much the wavelength (λ) dependence of back scattered UV radiation from an atmosphere containing aerosols (Mie scattering, Rayleigh scattering, and absorption) differs from that of a pure molecular atmosphere (pure Rayleigh scattering). AI for EP/TOMS is defined as (Hsu et al., 1999) [43].
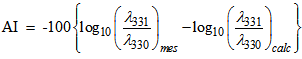 | (2) |
3.2. Ground-based Measurements and Calculation of UVIgrd
- Cloud cover in Oktas and noon time total irradiance from 280 to 320 nm (UV-B) are measured in South Valley University (SVU)-meteorological research station in Qena/Upper Egypt, during the period (Apr. 2000- Dec.2005). UV-B irradiance is measured by a precision radiometer UVB-1. The instrument's innovative measurement technique uses colored glass filters and a UV-B phosphor to convert incoming UV-B radiation to green light, which is then measured by a calibrated solid state photo detector (YES, 2008) [36]. Hourly values measurements of UV-B at the horizontal surface at noon time were carried out. The Model UVB-1 Ultraviolet Pyranometer ‘‘No. 960842, Yankee Environmental Systems Inc. (YES) was used to measure the total irradiance from 280 to 320 nm (UV-B), its cosine response is ±5% for 0 – 60 degrees solar zenith angle and its sensitivity is 1.97 (watt/m2)/volt of total UV-B irradiance. The hourly values of UV-B were recorded by Compilog Data logger (No. 1020, TH. Friedrichs & CO. ‘‘Germany’’).The UVB-1 instrument output voltage is converted to the CIE-defined erythemal irradiance in effective mW/m2 through multiplying the signal voltage by the conversion factor corresponding to the appropriate solar zenith angle (YES, (1997) [37, 33]. UVIgrd, can then be calculated by dividing the resulted erythemal values by 25.
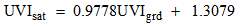
4. Methodology
- To select cloud-free conditions, the EP/TOMS Reflectivity (reflc.) was used. Thus, a day is considered cloud-free during (reflc.) is lower than 10% [13]. The percentage of such cloud-free days was about 64% of the total amount of days at Qena/Upper Egypt during the study period. Aerosol events were identified according to the aerosol index (AI), obtain from EP/TOMS data (NASA, 2011b) [39]. To investigate the effect of clouds and aerosols on the EP/TOMS bias, the following four datasets were analyzed:Dataset 1: all sky conditions. Dataset 2: all cloudless cases (reflc. <10%). Dataset 3: cloudless cases with low aerosol index (reflc. <10% and AI<1). Dataset 4: cloudy cases with low aerosol index (reflc. >10% and AI<1). Regression analysis was performed separately for each dataset and statistics analysis have been done to calculate the mean bias error (MBE), the mean absolute bias error (MABE) and root mean square error (RMSE). These statistics are obtained by the following expressions:
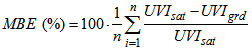 | (3) |
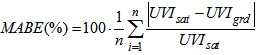 | (4) |
 | (5) |
 | (6) |
5. Results and Discussion
5.1. Daily Variation of UVIsat and UVIgrd
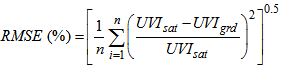
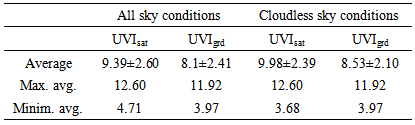
- The calculated daily average variation of UVIsat and UVIgrd at noon time during the period (Apr. 2000- Dec. 2005) in both all sky conditions and cloudless conditions (CC= 0 Oct) is depicted in Figure (2). Generally, the same behavior is found for the two variables. It attained low values at winter months, and increased to high values at summer months, after that it decreased to record low values at autumn months.
 | Figure 2. Daily average variation of UVIsat and UVIgrd at Qena/Upper Egypt (Apr.2000-Dec.2005) in (a) all sky conditions and (b) cloudless sky condition |
|
5.2. Frequency of Daily UVI Values
- The frequency of UVIsat and UVIgrd values are discussed in all sky conditions and cloudless conditions for determining which value of UVI has more occurrences in our area. The frequency distribution showed that the UVIsat with value of 12, which is considered as extreme, had more occurrences in both conditions, Figure (3), where their frequencies were 30.1% and 37.2% in all sky conditions and cloudless conditions, respectively. According to the EPA general guidelines UV levels are dangerous; one must be extra careful outdoors, where, unprotected skin can burn in minutes.
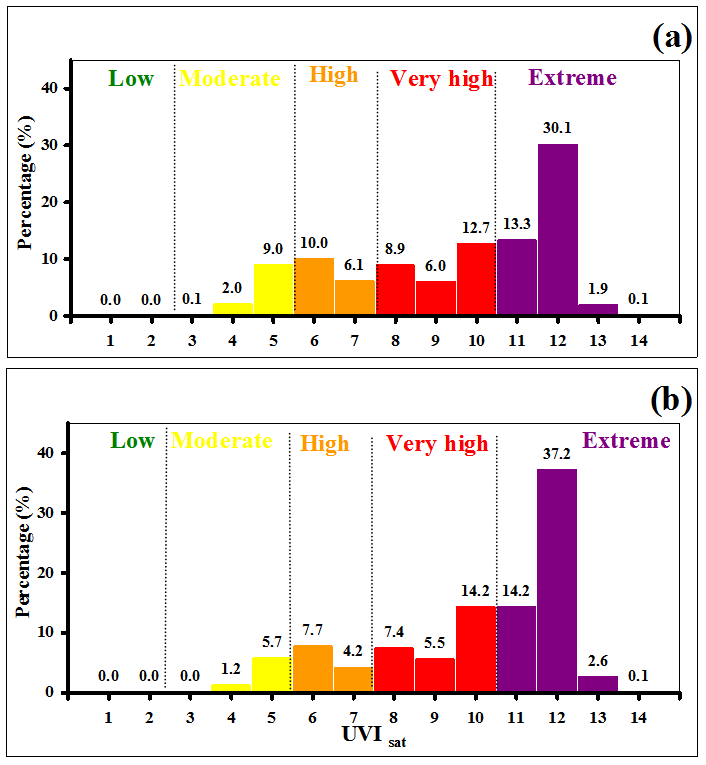 | Figure 3. Frequency of UVIsat at Qena/Upper Egypt (Apr.2000-Dec.2005) in (a) all sky conditions and (b) cloudless condition |
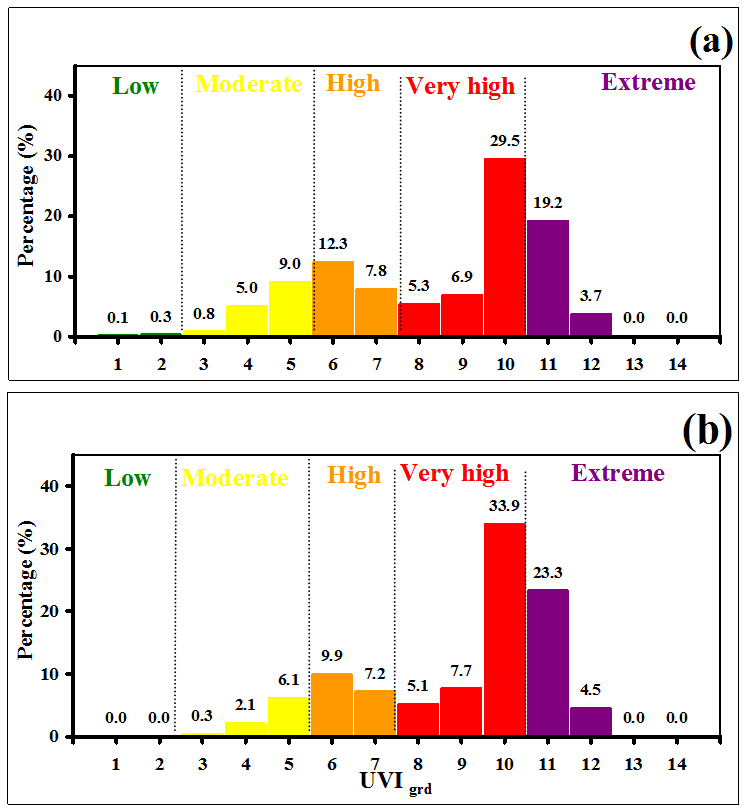 | Figure 4. Frequency of UVIgrd at Qena/Upper Egypt (Apr.2000-Dec.2005) in (a) all sky conditions and (b) cloudless condition |
5.3. Comparison between UVIsat and UVIgrd
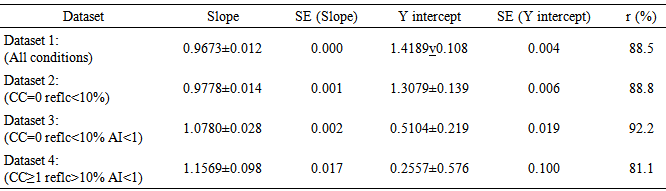
- Figure (5) shows the scatter plot between UVIsat and UVIgrd in all the aforementioned data sets during the period of study (April 2000–December 2005). The results of linear regression analysis between UVIsat and UVIgrd for all datasets, including, the slope of the regression, the standard error (SE) of the slope, the Y intercept, the SE of the Y intercept and the correlation coefficients (r) are presented in Table (2).
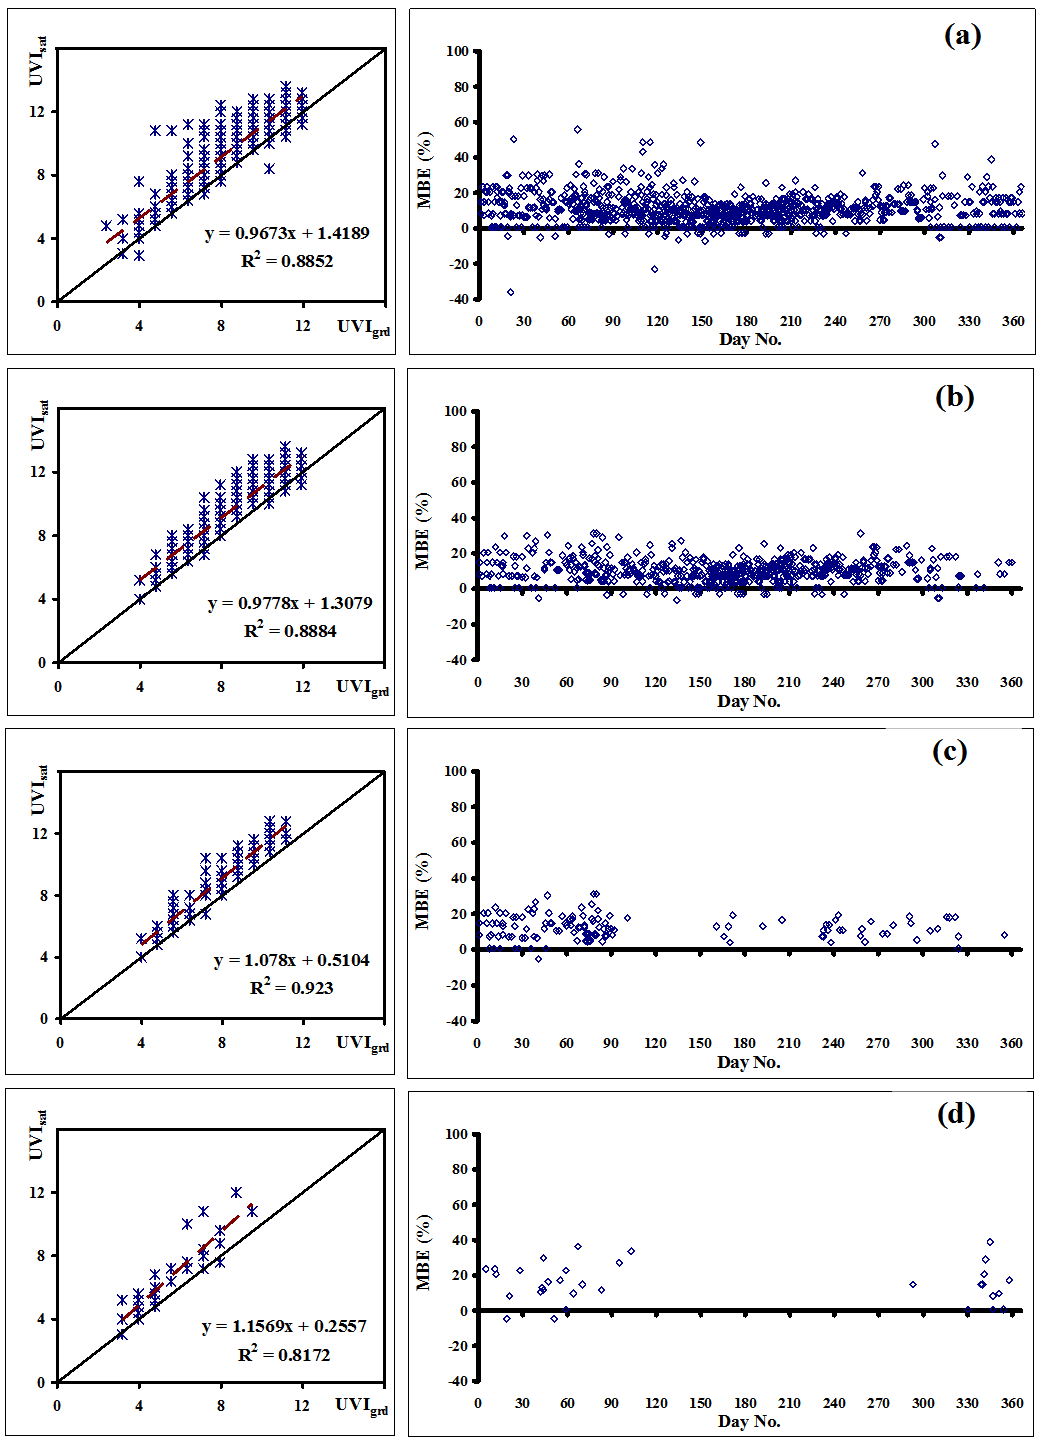 | Figure 5. In the left side, scatter plot between UVIsat and UVIgrd for each dataset. In the right side, scatter plot between MBE% and day number for each dataset: (a) for dataset 1; (b) for dataset 2; (c) for dataset 3 and (d) for dataset 4. The dashed line is the least square linear regression line, and the solid line symbolizes the ideal correlation of unit slope |
|
5.3.1. Data Set 1: All Sky Conditions
- The data set1 are characterized with all sky conditions. UVIsat were compared with UVIgrd in 950 days during the study period. The comparison is shown in Table (2) as well as Figure (5a). Regression analysis between UVIsat and UVIgrd showed positive linear relationship characterized by regression slope of 0.967±0.01 and intercept equals to 1.4189. The RMSE and correlation coefficient were 34.77±0.05 and 0.941, respectively. The regression formula was:
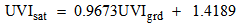 | (7) |
|
5.3.2. Data Set 2: Cloud-free Conditions
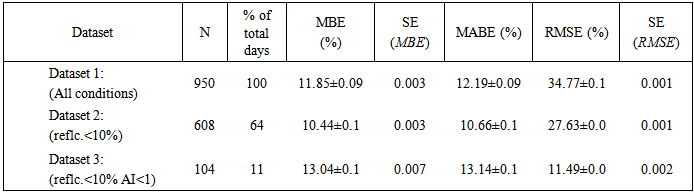
- For studying the effect of aerosols, data set 2 are characterized with reflc <10%, including all values of AI. The calculated UVIsat were compared with UVIgrd in 608 days representing the 64% of all days within the analyzed period. The result of the comparison is shown in Table (2) as will as Figure (5b). The regression analysis showed positive relationship between UVIsat and UVIgrd which characterized by regression slope of 0.9778±0.01 and intercept of 1.3079 with correlation coefficient 0.943. i.e. in the form:
 | (8) |
 | (9) |
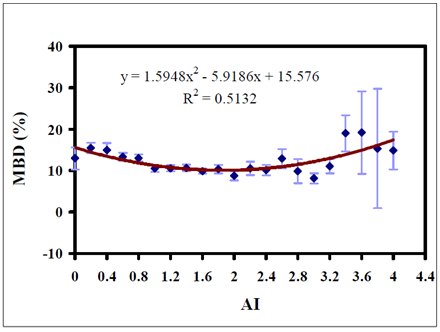 | Figure 6. The effects of AI on MBE (%) between UVIsat and UVIgrd (Apr.2000-Dec.2005) respect to dataset 2 (vertical lines shows SE) |
5.3.3. Data Set 3: Cloud-free Conditions with Low Aerosol Index
- The data set 3 are characterized by (reflc. <10%) and low aerosol index (AI<1). This case covered 104 days, representing the 10.95% of all days within the analyzed period. The regression analysis parameters between the calculated UVIsat and the calculated UVIgrd are tabulated in Table (2) and illustrated in Figure (5c). The regression analysis showed positive relation between UVIsat and UVIgrd with slope of 1.078±0.03 and intercept of 0.5104. The correlation coefficient between UVIsat and UVIgrd is 0.961. The relation between them is in the form:
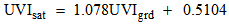 | (10) |
5.3.4. Data Set 4: Cloudy Conditions with Low Aerosol Index
- For studying the effect of clouds, the dataset 4 is characterized with reflc. > 10% and AI <1. The number of selected days of this data set is 53 days, representing 5.58% of all days within the analyzed period. The results of regression analysis are shown in Table (1) and illustrated in Figure (5d). The regression analysis shows positive relationship between UVIsat and UVIgrd. The relation is characterized by regression slope of 1.1569±0.098 with correlation coefficients 0.904, i.e.
 | (11) |
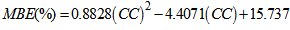 | (12) |
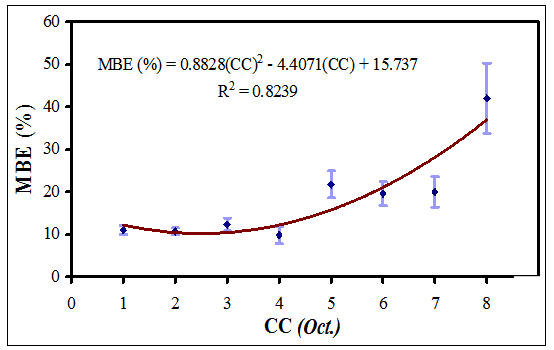 | Figure 7. The effects of cloud cover (Oktas) on MBE (%) between UVIsat and UVIgrd (Apr.2000-Dec.2005) respect to dataset 4 (vertical lines shows SE) |
6. Conclusions
- The main aim of this work is the study of the derived UV index from EP/TOMS (UVIsat) and the ground UV index (UVIgrd) obtained from UVB-1 Ultraviolet Pyranometer at Qena, Upper Egypt during the period (April 2000 to December 2005). Daily average variation of both UVIsat and UVIgrd at noon for all days during the studied period in all sky and cloudless conditions (cloud cover CC = 0 oct.) was presented. Also, frequency distribution of UVIsat and UVIgrd values was investigated. The effects of clouds and aerosols on comparisons between UVIsat and UVIgrd are considered. The study leads to the following:• Daily average value of UVIsat attained the value 9.39±2.60 with maximum value of 12.60 in all sky conditions. While its average value increased to 9.98±2.39, its maximum value remained at 12.60 in cloudless conditions.• Daily average value of UVIgrd attained the value 8.10±2.41 in all sky conditions and increased to 8.53±2.10 in cloudless condition, however, its maximum value was 11.92 in all sky conditions and cloudless condition.• The UVIsat with value of 12, which is considered as extreme, had more occurrence in both conditions, with frequencies 30.1% and 37.2% in all sky conditions and cloudless conditions, respectively. • The UVIgrd with value of 10, which is considered as very high, has more occurrence in all sky conditions and cloudless conditions, with frequencies 29.5% and 33.9%, respectively. • The comparison between UVIsat and UVIgrd in all datasets showed overestimation of UVIsat on UVIgrd. The overestimation increased with increasing cloud cover where the results show that The MBE and MABE have relatively large values on heavy overcast days.