-
Paper Information
- Next Paper
- Previous Paper
- Paper Submission
-
Journal Information
- About This Journal
- Editorial Board
- Current Issue
- Archive
- Author Guidelines
- Contact Us
World Environment
p-ISSN: 2163-1573 e-ISSN: 2163-1581
2014; 4(3): 143-150
doi:10.5923/j.env.20140403.05
Statistical Analysis of Hourly Surface Ozone Concentrations in Cairo and Aswan / Egypt
 Abstract
 Reference
 Full-Text PDF
 Full-text HTML
Kassem Kh. O.
Physics Department, Faculty of Science, South Valley University, Qena, Egypt
Correspondence to: Kassem Kh. O., Physics Department, Faculty of Science, South Valley University, Qena, Egypt.
| Email: |  |
Copyright © 2014 Scientific & Academic Publishing. All Rights Reserved.
Rescaled range analysis based on Hurst exponent is used to analyze persistence in data series of hourly surface ozone concentrations observed during 2001-2003 at two cities in Egypt. Analysis is accomplished for whole data series and monthly data series to examine the seasonal effects on the results of the analysis. Results show that breaks in the scaling behaviour after persistence up to 24 hours (1 day) in the original ozone concentration series and the differenced series are found. In the monthly time series, persistence is observed up to 30 hours (almost 1 day). In addition, differencing resulted in low persistence compared to original one during all the months at the two cities. Kurtosis analysis revealed higher intermittence in the original ozone concentrations at Aswan city and in the differenced ozone concentration at the both cities. It is found that ozone characteristics in the observed period are governed by the temporal dependence on the previous ozone levels and meteorological factors, moreover; differencing has significant effect on the persistence property of the time series.
Keywords: Hurst exponent, Kurtosis, Persistence, Ozone
Cite this paper: Kassem Kh. O., Statistical Analysis of Hourly Surface Ozone Concentrations in Cairo and Aswan / Egypt, World Environment, Vol. 4 No. 3, 2014, pp. 143-150. doi: 10.5923/j.env.20140403.05.
Article Outline
1. Introduction
- Air pollution resulted from high concentration of surface ozone is becoming a matter of concern as a result of its adverse effects on human health [1-5], vegetation and buildings [6-7]. Generally, ozone pollution was only thought to be a photochemical problem related to meteorological and diffusive process. For this purpose, models with reasonable accuracy have to consider physical and chemical relations among ozone and its precursors under various meteorological conditions [8]. However, these models were tied with an uncertainty problem that can never be expressed analytically by simplified processes [9].Nonlinear dynamics and complex system analysis were first developed in the empirical framework of the nature in science, and were rapidly applied into different research fields in recent decades. Reference [10] was the first person who found chaotic characteristics, i.e., Lorenz attractor, for the atmospheric system, which was the well-known ‘‘Butterfly Effect’’, and started the era of chaos research. [11] then gave a definite word ‘‘chaos’’ to describe the behavior that seems intuitively disorder but is of deterministic rule; by their simulation, many irregular phenomena seem to obey a hidden rule in the nature. Many previous trend studies of surface ozone concentration have been conducted, for instance, [12] have studied trends in ozone using both modelling and monitoring data. Reference [13] applied linear regression to assess trends in ground level ozone in Switzerland. [14] and [15] have applied the Kolmorgorv–Zurbenko (KZ) filter to ozone data to assess trends. Persistence is an indicator to the ‘‘memory’’ or internal correlation within a time or spatial series. A series is said to be persistent if its adjacent values are positively correlated, i.e. high values are followed by high values and low values are followed by low values, whereas a series is anti-persistent if its adjacent values are inversely correlated i. e. high values are followed by low ones and vice versa. Therefore, long-range persistence (LRP) is considered as one of the characteristics of evolutionary complex system. Numerous temporal or spatial series seen in natural and social phenomena exhibit LRP. Such as series of river flows [16], rainfall [17-19], DNA sequences [20] and heart beats [21].In the process of observation of the Nile River’s overflows, [16] developed the rescaled range (R/S) analysis to examine data that may not have an underlying Gaussian distribution. With a statistic, Hurst exponent H; R/S analysis quantifies the degree of persistence of a series. Reference [21] developed a new method named detrended fluctuation analysis (DFA) to reveal the existence of Long-range persistence in a series. It has been proven that DFA, presenting some advantages compared to R/S method and some traditional tools like the autocorrelation function or power spectrum. DFA is very useful for the identification LRP in non-stationary series [20, 22, 18]. Both R/S and DFA are now widely used in various fields [23]. Reference [24] applied R/S analysis and kurtosis analysis to average hourly ozone, PM10, and PM2.5 series in UK and got mean Hurst exponent estimator of 0.77, 0.80, 0.77, respectively. Their study proved the long-memory effect of ozone series with persistent duration up to 400 days.Most of the last studies of ground level ozone in Egypt searched its diurnal and seasonal variations and the effect of the meteorological parameters and chemical precursors on these variations. For instance, [25] studied O3 formation and seasonal variation of ozone at Cairo. They found sinusoidal shape in the diurnal variation of O3 with peak value of 120 ppbv and daily mean of 50 ppbv throughout the year. Reference [26] studied diurnal and seasonal variation of O3 in Cairo, Sidi Branni and Hurghada. They found that photochemical reactions are the effective source of O3 in Cairo and mainly at Hurghada, whereas the upper troposphere is the effective source at Sidi-Branny. Reference [27] studied the dependence of PM10 and gaseous molecules CO, NO2, SO2 and O3 on meteorological parameters in Cairo during the year 2002. He stated that pollutants associated with traffic were at highest concentration when wind speed was low. Also, O3 attains its higher values in June and lower values in December. Reference [28] investigated O3, NO and NO2 diurnal and seasonal variations; moreover, he studied O3 transportation using cluster analysis of backward air mass trajectories in addition to simulation of O3, NO, NO2 and some meteorological parameters using Weather Research & Chemistry model (WRF/Chem model) in four cities in Egypt (Cairo, Alexandria, Qena and Aswan). He found that Cairo is characterized by pronounced photochemical production of O3 at day hours and dominant titration of O3 during night hours due to increased values of NO. Transported O3 values to Cairo may have relatively large effect on measured O3 levels in comparison with that in Aswan. O3 impacts on radish and turnip growth under the Egyptian field has been studied by [29]. They found markedly higher decrease in the growth of radish than that in turnip.Given the fundamental role played by ozone and due to the lake of statistical treatment of its behavior, the aim of this study is characterizing hourly surface ozone behavior in Cairo and Aswan throughout analyzing persistence property by using rescaled range analysis. Intermittency of ozone pollution over time is studied by using kurtosis. In addition, the effect of using original and deseasonalized time series on the results of rescaled range analysis on persistence property is studied.
2. Methodology and Data Used
2.1. Study Area and Data
- Cairo (30.10° N, 31.29° E) is the capital of Egypt. Its area is about 214Km2, located north of Egypt, about 120 km south of the Mediterranean Sea coast, between two hills of about 200 m height forming a valley through which the Nile River flows. The valley may affect the prevailing northerly wind by channeling it along the north south axis [25]. It characterized with high population density (5,156/Km2). The climate of Cairo is hot in summer and cold in winter. Daily average temperature ranges from 21° to 37° in mid-summer and from 6° to 17° in mid-winter. It sometimes exposed to gusts sirocco (Khamassen winds) during the period from March to June; consequently, average temperature may be raised suddenly by about 14℃ and relative humidity decreased by 10%. About 52% of the industries and about 40% of electrical power stations in Egypt are found in Cairo: consequently, it is considered as one of the most polluted mega cities in the world [30]. It characterized with narrow streets and high buildings, cars with the industrial regions represent the main sources of air pollution.South of Egypt, Aswan city (24.12o N, 32.90o E) is also located in the Nile valley which affects the direction of the prevailing wind. It is very small in population in comparison with Cairo, with population density 31.78/km2. It is very hot in summer and moderate in winter with daily average temperature varies from 28℃ to 40℃ and from 14℃ to 26℃ in summer and winter, respectively. While, RH% varies from 22% to 38% in summer and from 29% to 59% in winter. More insight to the climate of Egypt as a whole can be found in [31].In Cairo and Aswan, ground level ozone data have been monitored by Egyptian Environmental Affairs Agency, Environmental Information & Monitoring Program EEAA-EIMP during the period 2001-2003. O3 was measured by UV-Photometric Absorption instrument model TEL M 49 C. In Cairo we used hourly data of O3 measured in El Abbassyia station; the station was located at one of the buildings of the Meteorological Authority near Abbassyia. The area was considered as regional residential area. In Aswan, the monitoring station was located in a shelter on the roof of the building of the Industrial training center. The area can be considered as an Urban/Residential area. Traffic and general activities of people (burning of waste) represent the main sources of air pollution. So, the site is representative for the randomly built area of Aswan city.
2.2. Methodology
- Rescaled range analysis is a statistical methodology used to identify the persistence or anti-persistence in the time series. It is carried out by computing the Hurst exponent (H) of the time series, which is used to determine the underlying distribution of a particular time series. Following [16], the deviation of the time series
 from its mean
  can be calculated as,
  where τ, is the time lag and k is the discrete time. The produced new time series ‘z’ maintains the properties such as variability of original one. The range R is calculated as the difference of maximum and minimum of the cumulative sum of deviations of time series from its mean, it can be given as;
 Where
Where  The range R depends on τ and mostly increases with increasing τ. The scaling properties of the time series is described by the ratio R/S, where S is the standard deviation calculated as,
 According to [16] if a series of random variables has finite standard deviation and the variables are independent, then the R/S statistic increases in proportion
  for large values of τ. Then we have,
 Hurst exponent, H is the slope of the curve relating log R/S against log τ.
Three cases can be found for the value of H. For the time series characterized with 0.5
3. Results and Discussion
3.1. Hourly and Diurnal Variations of Surface Ozone
- Although the aim of the study focuses on the statistical analysis of surface ozone, this section introduces brief description of hourly and diurnal surface ozone in Cairo and Aswan during the period 2001-2003. Hourly variation of surface ozone in Cairo and Aswan is shown in fig. 1. It is obvious that the time series of ozone has both diurnal and seasonal patterns in the two cities. High concentrations during spring and summer seasons are due to photochemical production resulted from abundance of solar radiation and chemical precursors as stated by [26] and [28].
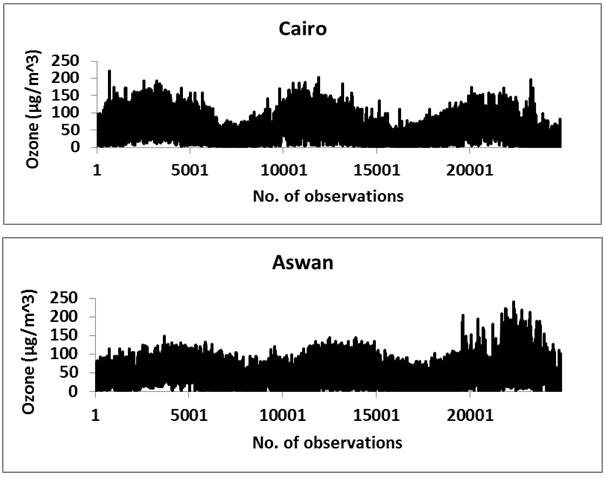 | Figure 1. Hourly surface ozone variation during the period 2001-2003 in Cairo and Aswan |
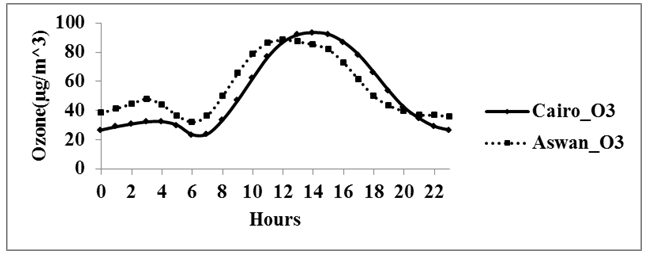 | Figure 2. Diurnal variation of surface ozone concentration during the period 2001-2003 in Cairo and Aswan |
3.2. Statistical Analysis of Surface Ozone
- Table (1) summarizes the statistical characteristics of hourly ozone concentrations in the two cities. Skewness is an indicator used in distribution analysis as a sign of asymmetry and deviation from normal distribution. From Table 1, Skewness > 0 is an indicator of right skewed distribution of surface ozone in the two cities - most values are concentrated on left of the mean, with extreme values to the right. Kurtosis characterizes the relative peakedness or flatness of a distribution compared with the normal distribution. Positive kurtosis indicates a relatively peaked distribution. Negative kurtosis indicates a relatively flat distribution, flatter than a normal distribution with a wider peak. In this case, the probability for extreme values is less than for a normal distribution. Kurtosis is positive in Aswan and negative in Cairo, indicating more intermittency in ozone levels in Aswan. The deseasonalysid series become more intermittence, where the Kurtosis values became 2.46 and 3 in Caro and Aswan, respectively. These results are inconsistent with those obtained by [24], where Gaussian behavior is observed for deseasonalized time series of O3. Meanwhile, consistent with the results found by [33] where, for the differenced time series, higher kurtosis (5.07) is observed at Sirifort/Indea. He stated that although linear trend and other significant oscillatory factors can be removed using detrending, but the nonlinear fluctuations get more pronounced after removing linear ones as stated also by [34]. This profound nonlinearity may be the reason of intermittency of deseasonalized ozone levels as shown by kurtosis.
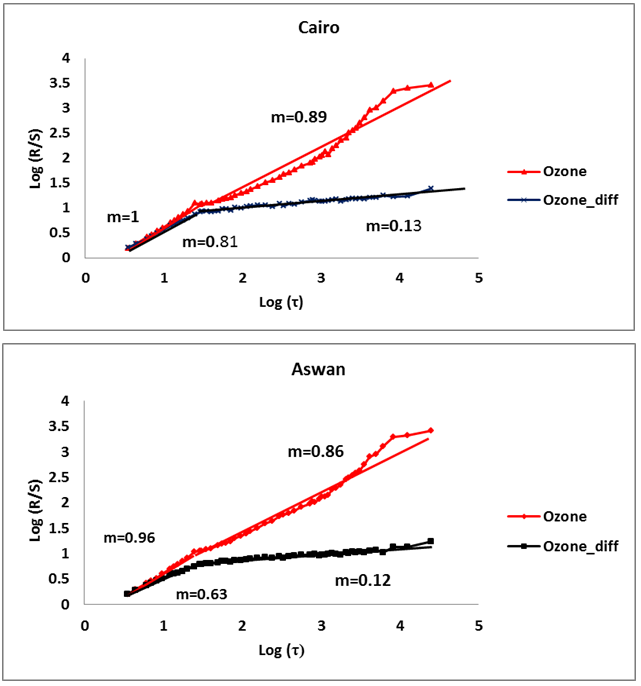 | Figure 3. Rescaled range analysis for ozone concentrations observed during 2001-2003 at Cairo and Aswan, Ozone_diff indicates the differenced ozone time series; m is the slope of the fitted straight line |
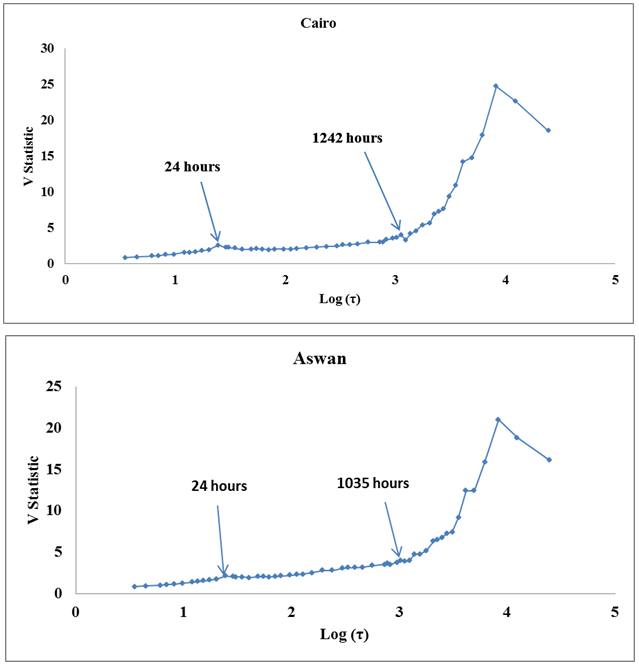 | Figure 4. V statistic plot for ozone concentrations observed during the period 2001-2003 in Cairo and Aswan |
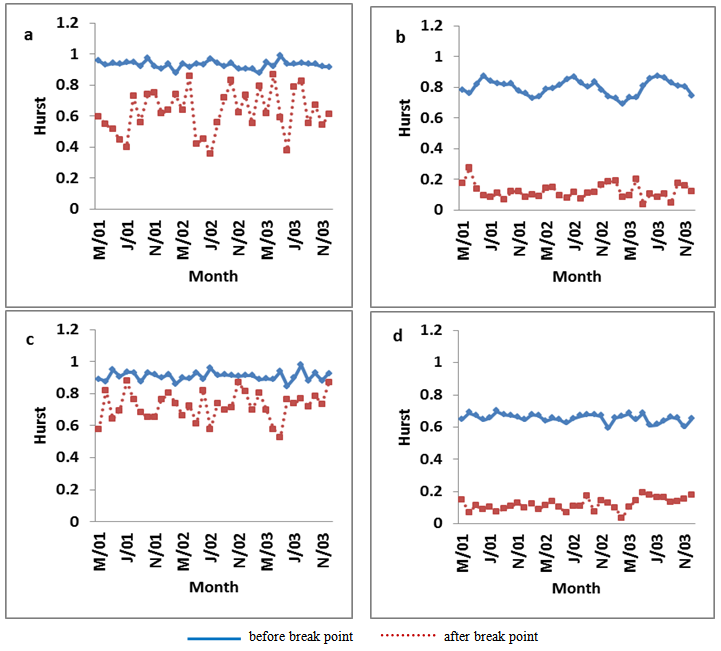 | Figure 5. Hurst exponent for monthly ozone time series at Cairo and Aswan, a and b for original and differenced time series at Cairo, respectively, c and d for original and differenced time series at Aswan, respectively |
4. Summary
- Persistence in surface ozone concentrations in Cairo and Aswan is studied using rescaled range analysis. For studying the effect of seasonality on persistence property separate analysis is carried out for the hourly time series observed over 2001-2003 and the hourly time series observed in different months. Higher intermittency is observed at Aswan than at Cairo, which got more pronounced by taking first order differencing of ozone concentrations at two sites. The effect of change in season, in addition to solar radiation on the amplitude of the diurnal ozone concentration plots is observed. In the original time series for 2001-2003, persistence is observed up to 24 h which corresponds to day cycles, indicating the significance of traffic activities in controlling the correlations in the ozone time series. The differencing also resulted in the similar persistence behavior but after breakpoint the persistence property is vanished. If the breakpoints are not considered, persistence is observed only in the original time series and differencing resulted in anti-persistence. In the monthly time series, persistence is observed up to 30 h. It is also observed that change in meteorological conditions has effect on persistence property of the ozone time series.
References
| [1] | Lippmann M., 1989. Effects of ozone on respiratory function and structure. Annu Rev Public Health, 10, 49 – 67. |
| [2] | HEI (Health Effect Institute), 1988. Air Pollution, the automobile and public health. National Academic Press7 Washington DC. |
| [3] | McDonnell, W.F., Chapman, R.S., Leigh, M.W., 1985. Respiratory responses of vigorously exercising children to 0.12 ppm ozone exposure. Am Rev Respir Dis 132(4):875– 9. |
| [4] | Avol, E.L., Linn, W.S., Venet, T.G., Shamoo, D.A., Hackney, J.D., 1984. Comparative respiratory effects of ozone and ambient oxidant pollution exposure during heavy exercise. J Air Pollut Control Assoc 31:666–8. |
| [5] | Linn, W.S., Avol, E.L., Shamoo, D.A., Spier, C.E., 1986. A dose–response study of healthy, heavily exercising men exposed to ozone at concentrations near the ambient air quality standard. Toxicol Ind Health 2:99– 112. |
| [6] | Goldsmith, J.R., Nadel, J.A., 1969. Experimental exposure of human subjects to zone. J. Air Pollut. Contr. Assoc. 19, 329–330. |
| [7] | Krupa, S.V., Manning, W.J., 1988. Atmospheric ozone: formation and effects on vegetation. Environ. Pollut. 50, 101–137. |
| [8] | Stefano, M.L., 1996. Simplified kinetics of tropospheric ozone. Ecological Modelling 84, 233–244. |
| [9] | Weng, Yu-Chi, Chang, Ni-Bin, Lee, T.Y., 2008. Nonlinear time series analysis of ground-level ozone dynamics in Southern Taiwan. J. Environ. Manage. 87, 405–414. |
| [10] | Lorenz, E.N., 1963. Deterministic non-periodic flow. Atmospheric Sciences 20, 130–141. |
| [11] | Li, T.-Y., Yorke, J., 1975. Period three implies chaos. American Mathematics Monthly 82, 985–992. |
| [12] | Solberg, S., Jonson, J.E., Horalek, J., Larssen, S., de Leeuw, F., 2009. Assessment of ground-level ozone within the EEA Member Countries, with a focus on long-term trends; 2009. EEA report. Technical No 7/2009. |
| [13] | Bronnimann, S., Buchmann, B., Wanner, H., 2002. Trends in near-surface ozone concentrations in Switzerland: the 1990 s. Atmos Environ, 36, 2841–52. |
| [14] | Ibarra-Berastegi, G., Madariagab, I., Elíasb, A., Agirrec, E., Uriad, J., 2001. Long-term changes in ozone and traffic in Bilbao. Atmos Environ, 35, 5581–92. |
| [15] | Rao, T.S., Zurbenko, I.G., 1994. Detecting and tracking changes in ozone air quality. J Air Waste Manage Assoc, 44, 1089–92. |
| [16] | Hurst, H.E., 1951. Long-term storage capacity of reservoirs. Transactions of the American Society of Civil Engineering 116, 770–799. |
| [17] | Peters, O., Hertlein, C., Christensen, K., 2002. A complex view of rainfall. Physical Review Letters 88, 018701. |
| [18] | Matsoukas, C., Islam, S., Rodriguez-Iturbe, I., 2000. Detrended fluctuation analysis of rainfall and streamflow time series. Journal of Geophysical Research 105, 29165–29172. |
| [19] | D’Odorico, P., Rodriguez-Iturbe, I., 2000. Space-time self organization of mesoscale rainfall and soil moisture. Advances in Water Resources 23, 349–357. |
| [20] | Mantegna, R.N., Buldyrev, S.V., Goldberger, A.L., Havlin, S., Peng, C-K., Simons, M., Stanley, H.E., 1994. On long-range power law correlations in DNA. Physics Review Letters 73, 3169–3172. |
| [21] | Peng, C.-K., Havlin, S., Stanley, H.E., Goldberger, A.L., 1995. Quantification of scaling exponents and crossover phenomena in nonstationary heartbeat time series. Chaos 5, 82–87. |
| [22] | Beben, M., Orlowski, A., 2001. Correlations in financial time series: established versus emerging markets. The European Physical Journal B 20, 527–530. |
| [23] | Jianlin Zhu, Zhiguo Liu, 2003. Long-range persistence of acid deposition. Atmospheric Environment 37, 2605–2613. |
| [24] | Windsor, H.L., Toumi, R., 2001. Scaling and persistence of UK pollution. Atmospheric Environment 35, 4545–4556. |
| [25] | Gusten, H., Heinrich, G., Weppner, J., Abdel-Aal, M.M., Abdel-Hay, F. A., Ramadan, A.B., Tawfik, F.S., Ahmed, D.M., Hassan, G.K.Y., Cvitas, T., Jeftic, J., Klasinc, L., 1994. Ozone formation in the greater Cairo area. The Science of the Total Environment 155, 285-295. |
| [26] | El-Hussainy, F.M., Sharobiem, W.M., Ahmed, M.D., 2003. Surface ozone observations over Egypt. IDŐJÁRÁS, Vol. 107, No. 2, April-June 2003, 133-152. |
| [27] | Hamdy, K.E., 2005. Dependence of urban air pollutants on meteorology. Science of the total Environment 350, 225 – 237. |
| [28] | Kassem, Kh.O., 2009. Variability of surface ozone in some regions in Egypt. Ph.D. Thesis, South Valley University, Egypt. |
| [29] | Hassan, I.A., Ashmore, M.R., Bell, J.N.B. 1995. Effect of ozone on Radish and Turnip under Egyptian field conditions. Environmental pollution 89, 107-114. |
| [30] | Khoder, M.I., 2007. Ambient levels of volatile organic compounds in the atmosphere of Greater Cairo. Atmospheric Environment 41, 554-566. |
| [31] | Danuta Martyn, 1992. Climates of the World. ELSEVIER, Amsterdam-London-New York-Tokyo, PWN-POLISH SCIENTIFIC PUBLISHERS, Warszawa. PP 199-225. |
| [32] | Lu, W.Z., Wang, X.K., 2006. Evolving trend and self-similarity of ozone pollution in central Hong Kong ambient during 1984–2002. Sci. Tot. Environ. 357, 160–168. |
| [33] | Asha B. Chelani, 2009. Statistical persistence analysis of hourly ground level ozone concentrations in Delhi. Atmospheric Research 92, 244–250. |
| [34] | Varotsos, C.A., Ondov, J., Efstathiou, M., 2005. Scaling properties of air pollution in Athens, Greece and Baltimore, Maryland. Atmos. Environ. 39, 4041–4047. |
| [35] | Varotsos, C.A., Kirk-Davidoff, D., 2006. Long-memory processes in ozone and temperature variations at the region 60 degrees S-60 degrees N. Atmos. Chem. Phys. 6, 4093–4100. |