Caleb Michael Akers, Nathaniel John Smith, Naima Shifa
DePauw University, Greencastle, IN, 46135, USA
Correspondence to: Naima Shifa, DePauw University, Greencastle, IN, 46135, USA.
| Email: |  |
Copyright © 2014 Scientific & Academic Publishing. All Rights Reserved.
Abstract
Among many variables that determine the strength of a tornado, reported path length and width of a tornado are highly associated with its intensity. The relationship of the length and width of tornadoes to the intensity of their damage has been modeled using other methods, but we choose to use multinomial logistic models for different Fujita (F) scale measurements. Currently, very few systems have the ability to accurately predict the intensity of tornadoes. Being able to predict the intensity of a tornado would allow for more effective forecasting and increased weather safety in extreme storms. We derived a multinomial logistic expression to calculate the odds that a particular tornado has a certain intensity, F1 through F5.
Keywords:
Fujita scale, Least square model, Multinomial logistic model, Ordinal scale
Cite this paper: Caleb Michael Akers, Nathaniel John Smith, Naima Shifa, Multinomial Logistic Regression Model for Predicting Tornado Intensity Based on Path Length and Width, World Environment, Vol. 4 No. 2, 2014, pp. 61-66. doi: 10.5923/j.env.20140402.02.
1. Introduction
The most noted research into tornadoes and their intensity was done by T. Theodore Fujita around 1970 [3]. Fujita analyzed the damage done to structures on the ground while he surveyed the paths of over 300 tornadoes from the air. The Fujita Scale is correlated to estimated wind speed based on the visible damage caused by a tornado.A similar research study relevant to the comparison of tornado width, path length, and intensity was performed by Harold E. Brooks in 2004 [2]. Brooks modeled the NOAA’s dataset of tornadoes since 1950 with a Weibull distribution, trying to find a relationship of path length and width to intensity for tornadoes because of its relevance to forecasting. Brooks found that symmetric tornadoes move more slowly, causing more damage to individual points along the ground; thus, some tornadoes can cause more damage even if their wind speeds are not greater than other (higher-speed) tornadoes. As a final note, Brooks indicated that an error in the data was that the width was not necessarily static—a tornado’s size can change as it travels, as can its intensity on the Fujita scale. This means that at the time of measurement, a tornado can be stronger or weaker than at other times.Donald Burgess, Michael Magsig, Joshua Wurman, David Dowell, and Yvette Richardson [6] analyzed a single long and violent tornado that struck Oklahoma City on May 3, 1999, and the researchers used multiple Doppler radar systems to track the tornado. The experiment was designed to test the accuracy and consistency of the Doppler machines, and it concluded that despite certain errors, the Doppler systems are still very accurate. Stationary Doppler systems slightly overestimate the size of tornadoes because of debris interference, and Mobile Doppler systems are inaccurate when the beam is blocked or when the antenna is crooked, but overall the trend is that although there are minor inconsistencies, the systems are still very accurate and coincide in their measurements.In this article, we model the intensity of the tornado with path length and width. We use multinomial logistic regression to analyze data provided by the National Oceanographic and Atmospheric Administration (NOAA) database of tornadoes in the United States from 1950- 2012 [5]. We use graphical approaches to see the yearly distribution of tornadoes. We also use matrix scatterplots to observe the relationship between length, width and other variables, we develop boxplots for comparisons, and we use advanced 3-dimensional graphs to analyze the nature of tornadoes.
2. Data and Analysis
For this research, we create two subsets of the NOAA’s data in order to account for improvements in weather instruments and techniques over time. We notice that there is a large increase in the number of recorded tornadoes around 1990 (Fig.1), which we assume is a result of more accurate measurement and detection, not a physical increase in tornadoes. We also create a second subset of data spanning the last five years in order to analyze more recent tornado trends. We find that with these datasets, the number of tornadoes is more stable over time, following a more natural random distribution.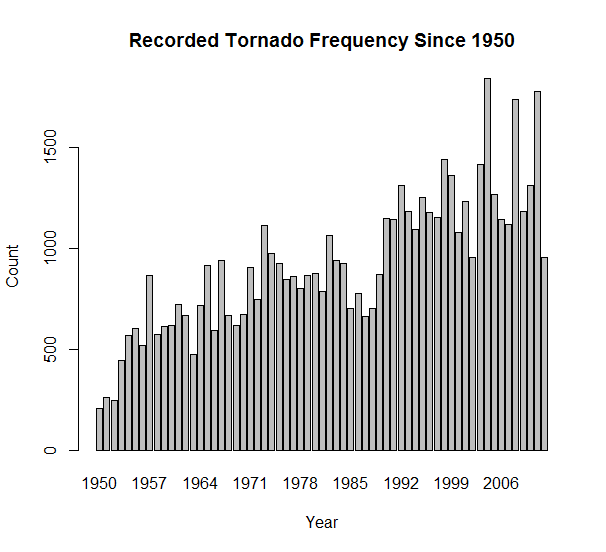 | Figure 1. The number of tornadoes reported in the United States from 1950-2012 |
A striking feature is that while the number of tornadoes reported each year is stable since 2007, the yearly number of violent, powerful tornadoes are relatively stable as well (Fig 2). We do not see notable variance in the distribution of each Fujita Scale intensity over time, and this is shown in Figure 2.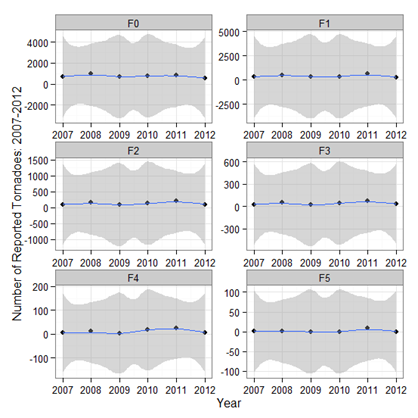 | Figure 2. The distribution of intensities (measured by the Fujita Scale) for 2007-2012 |
As we move from a general view of the frequency of tornadoes to a more specific analysis of the factors that affect intensity, we decide to use a matrix scatterplot to compare the relationships of many variables (Fig. 3).For the dataset of tornadoes since 1990, for the matrix scatterplot which contained intensity, width, path length, number of injuries, and number of fatalities from each tornado since 1990 (Fig. 3), we see that as length and width increase, the intensity is generally greater, but there are numerous outliers in every case. For example, the widest and longest tornadoes recorded are not F5 tornadoes, they are F4 and F3 tornadoes, respectively. However, as the length and width increase, we can observe that the central tendency of intensity does shift. We also look to see if an increase in intensity accompanies an increase in the number of injuries and fatalities. However, there appears to be no strong positive correlation between width or path length and the number of injuries or fatalities.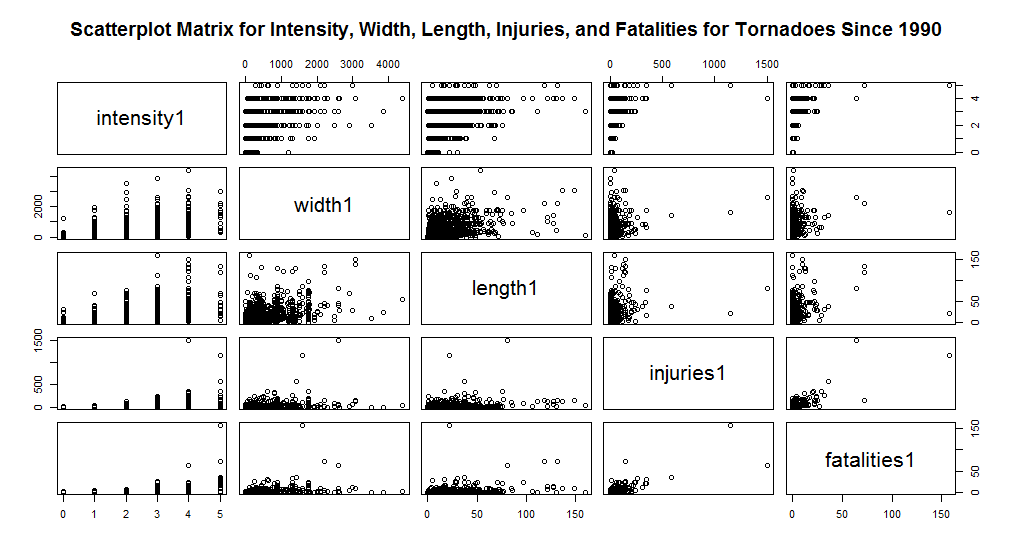 | Figure 3. Scatter plots for intensity, width, path length, number of injuries, and number of fatalities 1990-2012 |
We performed the same analysis on the dataset of Tornadoes since 2007, and we found similar results (Fig. 4). There are outliers, but in general the central tendency of intensity increases as the width and path length increase.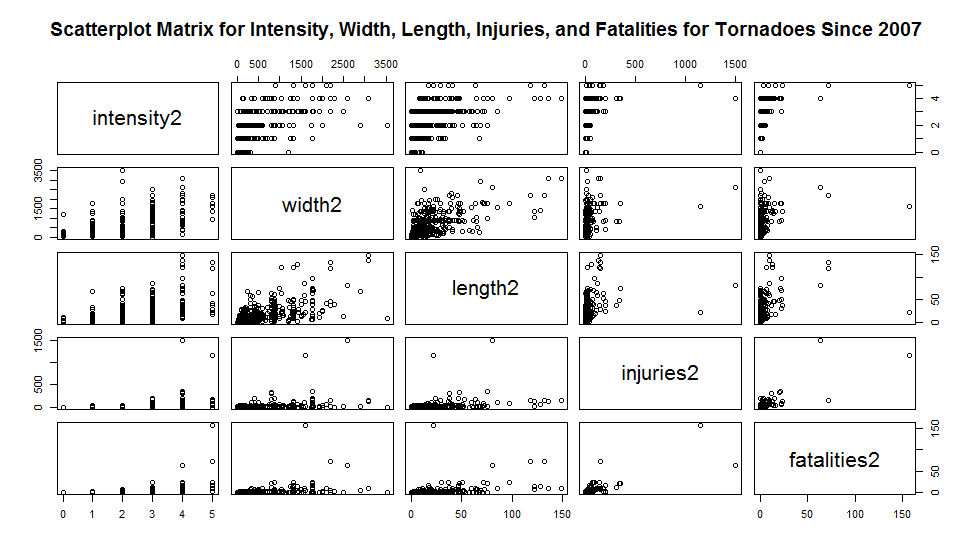 | Figure 4. Scatter plots for intensity, width, path length, number of injuries, and number of fatalities 2007-2012 |
In the boxplots, length is plotted as a function of Fujita scale; all tornadoes were split into 6 groups, F0-F5 (Fig.5 and Fig.6). For each group, the rectangle-like box represents the middle half of the length distribution lying between the first and third quartiles. The horizontal line near the middle of each box represents the median length for each intensity level. The full range of the observed length in each intensity scale is represented by the last dot at the end of each whisker. 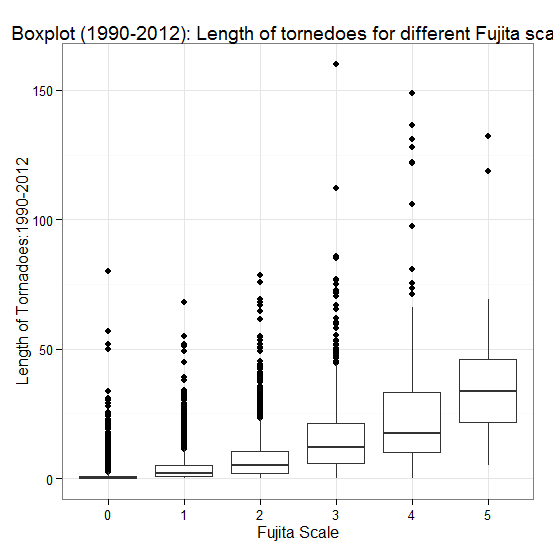 | Figure 5. Comparison of length and intensity of tornadoes, 1990-2012 |
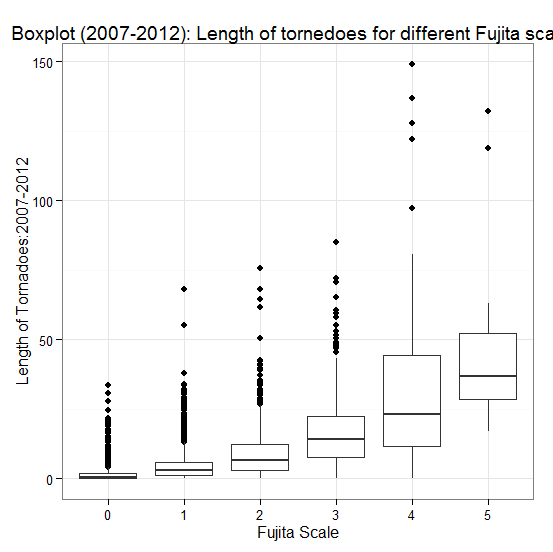 | Figure 6. Comparison of length and intensity of tornadoes, 2007-2012 |
There is a clear tendency for intensity of tornadoes to rise with length in two intervals, but one can also discern several other features from the plots. From these graphs, one can see that the median length does increase in a curved shape as Fujita Scale increases, so that there is some sort of relationship between intensity and path length for tornadoes. There is also a tendency for dispersion, as measured by the interquartile range of intensity, to increase with length. This effect is accentuated if we consider the upper and lower tails of the length distribution. By characterizing the entire distribution of length for each intensity scale, the plot provides a much more complete picture than would be offered by simply plotting the group means or medians. Here we have the luxury of a large sample size in each group, so we are able to take standard statistical (parametric) to analyze the data.Next, we will look at the width of tornadoes versus their intensity. We find that the same conclusion is applicable when comparing width of tornadoes to their intensity (Fig.7 and Fig.8). 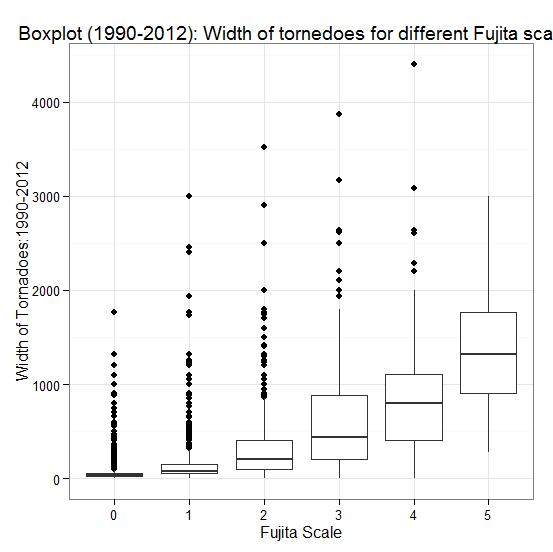 | Figure 7. Comparison of width and intensity of tornadoes, 1990-2012 |
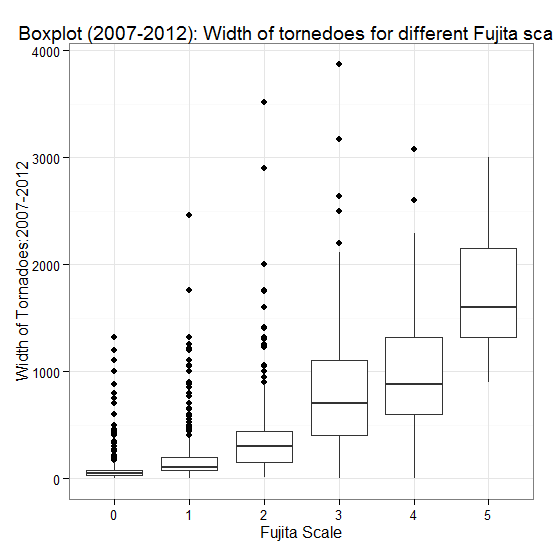 | Figure 8. Comparison of width and intensity of tornadoes, 2007-2012 |
From these figures, one can see the strong increasing relationship between the width and intensity; intensity increases with increasing of width.
3. Linear Regression Model
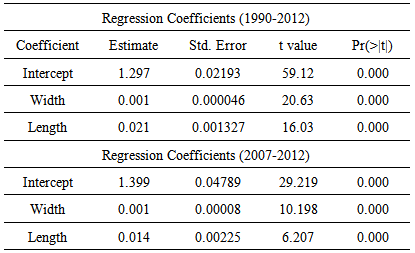
The summary statistics of our linear model for 1990-2012 are shown below:Table 1. Table of coefficients. The coefficients are from a linear model of intensity based on functions of path length and width
 |
| |
|
From the r-squared value, only about 35% of the variation in intensity can be accounted for by the width and path length of the tornado. Also, the intercept of our model indicates our planar model may not be appropriate because F0 and F1 tornadoes would require a negative length or width. Furthermore, we realize that the Fujita Scale is discreet, not continuous, so a more proper model would only allow whole number intensities.Again, we find the same problem with F0 and F1 tornadoes, and the r-squared value is only slightly higher at 38%. Thus, we decided to consider a probability model where, given certain conditions of path length and width, we could express the probability that any particular intensity tornado will occur with respect to other intensities.The model we chose to represent our data was a multinomial logistic regression model [1]. This model is designed for categorical variable outputs, which better fits the response variable for our data. The model also does not assume that the explanatory variables are independent, so it is acceptable that the width may affect the path length of a tornado. The model is also able to predict the likelihood of each Fujita scale ranking depending on the path length and width of a tornado, and it can handle multiple explanatory variables. Thus, the multinomial logistic regression model is a good fit for our dataset.
4. Mathematical Basis for the Multinomial Logistic Regression Model
We can represent the i-th tornado as a function FiJ that has probability PiJ. Thus, for a tornado i, we can say that Fi0is a function and Pi0 is the probability that tornado i has intensity 0 on the Fujita scale. Then, Pi5 is the probability that tornado i has intensity 5. For a tornado i, its covariates are xi, or for this model, path length (in miles) and width (in yards). We will define our variables as follows:We want to find the probability that a tornado i will have intensity with respect to a ground level (or intensity 0) by linearizing the system. This continues for each category 1-5 until we reach:
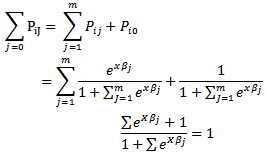
 Basically, the j-th log it model (for intensities 1-5) can be written as:
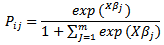
 Next, we want to find the probability that a tornado i has a certain intensity, so we find that:
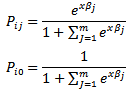 We will now explain how we arrived at that conclusion for the probability statements. We know that the sum of all the probabilities of the intensities F1-F5 must add to 1 (a tornado must have intensity in this range), so we write
 Noting that:
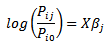 We can exponentiation both sides to find:
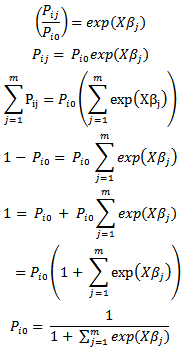 Remembering that:
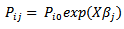
 Thus, we find that the odds ratio of having a tornado of strength jn versus jm can be portrayed as:
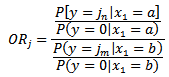 Thus, using this model, we can find an odds ratio and determine how many times more likely a category n tornado is than a category m tornado given the initial conditionsx1.
5. Model Outputs
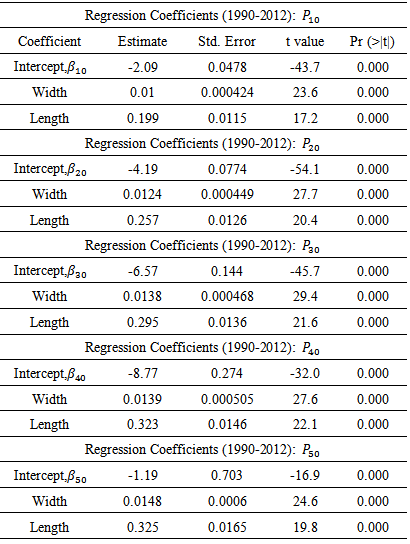
Following the multinomial logistic regression model, the following equations were calculated to find the relationship between the length and width of a tornado with the intensity, measured with the Fujita Scale. Each equation represents xβj that can be used in the probability equation to find the probability or odds ratio of Fujita Scale values for given initial conditions. Table 2. Table of coefficients. The coefficients are from a multinomial logistic model of intensity category onto functions of path length and path width
 |
| |
|
Table 2 shows the model coefficient statistics. The coefficients indicate that tornado path length and path width are significant in explaining damage category. Thus, based on these five equations, we can calculate the probability that a tornado with width w and length l has a Fujita scale ranking of F1, F2, F3, F4, or F5.
6. Conclusions
With our modeling, we have demonstrated that there is not a strong linear relationship between the path length and width of a tornado versus its intensity. In fact, there seem to be many errors and other factors that influence the outcome of a tornado’s intensity. One such error is an inconsistency in the Fujita scale itself. The Fujita scale is retrospective, meaning that it assesses the intensity of a tornado based on the damage it was able to cause, and this damage is assessed after the tornado has already passed (for obvious safety reasons). For this reason, the Fujita scale does not always accurately reflect the strength of a tornado. A strong tornado that passes through a corn field will do little or no damage, and according to the Fujita Scale, it may be labeled as a low-intensity tornado. Harold Brooks, in his study, also noted that a slow-moving but weak tornado can do a significant amount of damage because it affects a small area for a longer time, which might cause a weak tornado to be considered a strong tornado by the Fujita Scale.Weather instruments have improved, and the width and path length of tornadoes can be more accurately measured by Doppler systems nowadays. Other researchers have found that the systems indeed are consistent, so it is acceptable to say that the width and path length of recent tornadoes are accurate if they were measured with Doppler systems. However, an error with these values is that the width of a tornado is not constant; as the tornado moves, it can gain width, lose width, grow weaker, or grow stronger, so even if the measurement was accurate at one point in time, at some other point in the tornado’s life span, it may be inaccurate.Some other factors that affect the intensity of tornadoes include the temperature, terrain, humidity, and the strength and size of the supercell that created the tornado. We suspect that all of these may play a role in determining a tornado’s strength, and if given the opportunity to continue our research, we might address and investigate these factors in future analyses.Overall, our model does not definitively predict the intensity of a tornado if its width and path length are known, but it a useful tool in describing the chances that the tornado will be weak (F1 or F2) or strong (F4 or F5). This will hopefully give some indication of the strength of a tornado. A problem with our model is that the path length can only be determined after the tornado has ended. For future models, we would like to consider models that involve other factors that will be more predictive in nature (such as humidity during and before tornadoes). Maybe, by considering more factors, we will get a better picture of the factors that affect tornadoes and we will be able to investigate a more accurate model.
References
| [1] | Agresti, A., 2010: Analysis of Ordinal Categorical Data. Wiley Series in Probability and Statistics, Wiley. |
| [2] | Brooks, H. E. (2004, April). On the Relationship of Tornado Path Length and Width to Intensity. Weather and Forecasting, 19(2), 310-319. |
| [3] | Fujita, T. (1965, April 11-12). |
| [4] | Grazulis, Thomas P (July 1993). Significant Tornadoes 1680–1991. St. Johnsbury, VT: The Tornado Project of Environmental Films. ISBN 1-879362-03-1. |
| [5] | National Oceanographic and Atmospheric Administration. (n.d.):http://www.spc.noaa.gov/wcm/data/1950-2012_torn.csv. |
| [6] | Radar Observations of the 3 May 1999 Oklahoma City Tornado. (2002, June). 17(3), 456 471. Weather and Forecasting. |
| [7] | Wurman, J. a. (2000-2004). |
 Abstract
 Reference
 Full-Text PDF
 Full-text HTML