Alsharifa Hind Mohammad
Water, energy and environment center, The University of Jordan, Amman, 00962, Jordan
Correspondence to: Alsharifa Hind Mohammad, Water, energy and environment center, The University of Jordan, Amman, 00962, Jordan.
| Email: |  |
Copyright © 2012 Scientific & Academic Publishing. All Rights Reserved.
Abstract
The main issue which faced and is still facing Jordan during the last decades is the urgent need to protect the groundwater resources in quality and quantity. Vulnerability studies represent the most important protection actions to sustain these resources for present and future generations. This work dealt with the vulnerability of the water resources of Wadi Kafrain catchment area and its surroundings. The concept of groundwater vulnerability can hereby defined as the ability of groundwater to be polluted. Wadi Kafrain basin represents one of the drainage systems from which drain high lands region around Amman westward down to the Jordan Valley. The basin land is built up of a series of aquifers and aquitards. A new vulnerability index was built up to better suit the area with dry to semi dry climate. This index shows wide variation in the vulnerability classes. Validation by NO3 concentration mapping was done for the aquifers and it was found that all the vulnerability indices fit the validation map which reflects the accuracy of the work. The area is divided into zones according to the vulnerability rates to help as an efficient tool in planning and decision-making processes to protect water quality for use by present and future generations. The result shows that the groundwater in the present aquifers are with very low, low, moderate, high and very high vulnerability rates the higher rates are posited in the areas with shallow water table, presence of structures and lineaments, permeable vadose zone and high recharge areas.
Keywords:
Groundwater, Vulbnerability, Aquifer, Aquitard, Vadose zone
Cite this paper: Alsharifa Hind Mohammad, New Groundwater Vulnerability Index for the Main Aquifers in Central Catchment Area in Jordan and Validation of the Results Using NO3 Concentrations Maps, World Environment, Vol. 4 No. 1, 2014, pp. 22-32. doi: 10.5923/j.env.20140401.03.
1. Introduction
Water is one of the most important environmental components, and Jordan suffers of serious water problems due to water shortage. In addition, the increasing demand on the limited resources and water quality degradation put additional pressure on these resources.Due to the high population growth rate, industrialization and the general development of the country, water demand has been and is still growing sharply. As a result, water has become an issue of national concern.Groundwater vulnerability maps are important tools to draw the attention of land use planners to existing problems. It is also used to anticipate the movement of pollutants in the soil, allowing planners to modify the potential occurrence of harmful conditions, such as groundwater contamination, before serious impacts occur (Murray and Rogers, 1999)[1].Assessing the vulnerability of the environment requires the consideration of a large number of parameters, which may vary spatially and temporally across the landscape; soil, water and land use for a specific area. Many vulnerability indices were found to describe the groundwater intensity for different aquifers in different climatic conditions, but none of them describes the situation in the dry and poor water resources areas such as Jordan, so a new groundwater vulnerability mapping was built to deal with the water and climate conditions in such areas in order to evaluate the recharge as an important factor in the determination of the groundwater vulnerability using a new recharge approach which calculates the recharge as the final water percentage while is left after evaporation, runoff and soil retention took their part shares from the rainfall amounts. The existing landuse is a new factor to be considered in this index. This factor gives different rates for different human activities that may affect the groundwater quantity. The importance of the landuse factor which doesn't exist in other vulnerability indices will help in predicting the quality situation of the groundwater and the degree to which this water may be polluted in the future.
1.1. Study Area
 | Figure 1. Location map of Wadi Kafrain Catchment Area in Jordan |
The study area is located west of Amman and extends westwards to the Jordan Valley (Figure 1). It comprises Kafrain catchment area until the wadi confluence with the Jordan River. The land cover in the study area shows a wide range of plants and activities; such as natural forests, grazing, irrigated and rain fed areas, urban centers and some industrial activities.Kafrain catchment represents one of the small drainage systems of the Jordan Valley side wadis. It extends from the highlands around Amman westward to the Jordan Valley. The catchment area is drained by a small perennial stream dammed at its confluence into the Jordan Valley by the Kafrain Dam. Wadi Kafrain drains an area of 189 km2 with an average natural discharge of around 6.4 MCM/yr during the pre-developmental era, consisting of 1.6 MCM/yr flood flow and 4.8 MCM/yr base flow (Salameh and Bannayan, 1993)[2]. This amount of water is very important for the local development of the area. The flow regime has been changing since about 3 decades with water being imported into the basin to satisfy the growing demand for domestic and industrial water, the effluents of which flow then treated and untreated along the wadi into Kafrain dam. Na'ur and Wadi Sir are the main towns located within the drainage basin of Wadi Kafrain. The area also includes the most important medical center in Jordan (Al Hussein Medical City), with its effluents being discharged into the main wastewater treatment plant of Wadi Sir, lying in the downstream area of wadi Kafrain and treating also the wastewater of Wadi Sir and Na'ur areas.
2. Methedology
Fuzzy multi-objective programming is based on the choice of appropriate MSFs for the objective functions[7]. In fuzzy linear programming, the Considering the special conditions in semi arid areas such as aridity, strong fluctuations in precipitation amounts and distribution, soil properties and thin soil thicknesses, barren rocks, etc, a new vulnerability index was modified based mainly on the recharge amount and the ability of rocks to permit pollutants to reach the groundwater. This index is supposed to be suitable for different aquifer rock types.The main factors in this index are:Recharge amounts: (depends on the weather records, evaporation amounts, runoff amounts, soil retention and topographic setting of the area).Depth to water table: This is important to describe the distance that the pollutants have to pass to reach the groundwater.Landuse: landuse is an important factor that must be included in the groundwater vulnerability maps because it may strongly affect the groundwater quality.Structural setting: existing fissures, faults and joints in the rocks form a very important factor in vulnerability prediction.Aquifer media: this describes the ability of pollutants to move within the aquifer according to the type of that aquifer.The above factors have their weights according to Table 1, these weights are given according to the predictable effects of each factor on the groundwater, the higher predictable effect is the higher weight and so on, the rates of each factor are presented in Tables (2 – 7), and the final vulnerability rates are given in Table 8. | Table 1. Vulnerability index factors and their weights |
| | Factor | Weight | | Depth to water table | 9 | | Recharge amount | 8 | | Landuse | 7 | | Lineaments | 7 | | Aquifer media | 5 | | Vadose zone | 5 |
|
|
| Table 2. Rates of depth to groundwater table |
| | Depth to water (m) | Rate | | 0-2 | 10 | | 2-10 | 8 | | 10-20 | 6 | | 20-40 | 4 | | 40-60 | 2 | | > 60 | 1 |
|
|
| Table 3. Rates of recharge factor |
| | Recharge amount (mm) | Rate | | > 500 | 10 | | 450-500 | 9 | | 400-450 | 8 | | 350-400 | 7 | | 300-350 | 6 | | 250-300 | 5 | | 200-250 | 4 | | 150-200 | 3 | | 100-150 | 2 | | < 100 | 1 |
|
|
| Table 4. Rate of landuse factor |
| | Landuse | Rate | | Agriculture (rain fed) | 1 | | Agriculture (man) | 3 | | Urban areas | 2 | | Barred rocks | 1 | | WWTP | 4 | | Streams (related to wwtp) | 6 | | Streams (not related to wwtp) | 3 | | Dams | 5 |
|
|
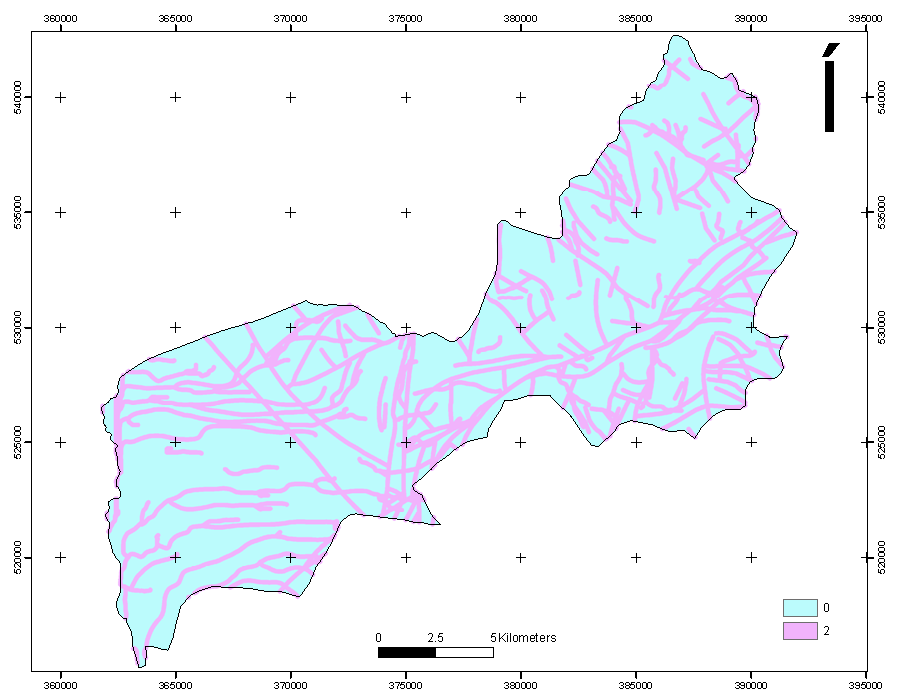
| Table 5. Rate of lineaments factor |
| | Structures | Rate | | Fissures, joints and faults and dry wadis | 2 |
|
|
| Table 6. Rate of vadose zone factor |
| | Vadose zone | Rate | | Not covered | 4 | | Soil | 3 | | Unconfined unit | 2 | | Confining unit | 1 |
|
|
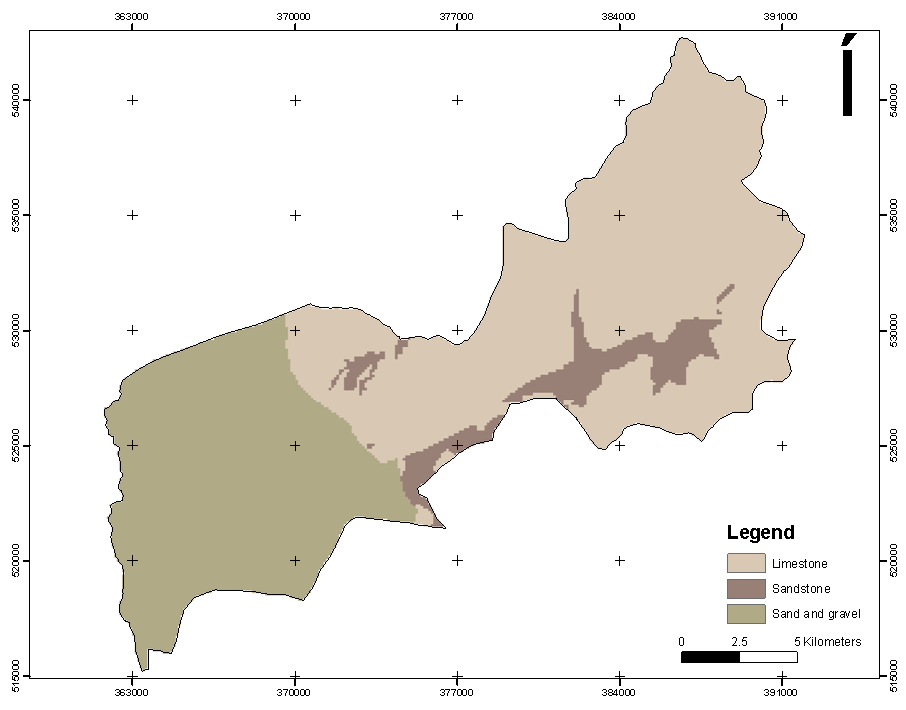
| Table 7. Rate of aquifer media factors |
| | Aquifer media | Rate | | Limestone | 1 | | Bedded sandstone | 2 | | Sands and gravels | 3 |
|
|
| Table 8. Final rates of vulnerability factors |
| | Value | class | | < 50 | Very low | | 51 – 100 | Low | | 101 – 150 | Moderate | | 151 -200 | High | | > 201 | Extremely high |
|
|
3. Data Processing
Recharge amounts were determine using the fact that recharge equals to the amounts of water losses subtracted from the amount of rainfall precipitated on a certain area. This factor is calculated using a new approach where recharge and evaporation can only take place in the wet period of the year which in Jordan extends from November to March and when soil moisture is still available in April. Water losses include evaporation in the months Nov. to March; the surface runoff of the study area and a new factor which is the soil retention which includes the water that evaporates in the dry months of the year. The thematic layer produced for this factor is given in figure 2.The second factor "the depth to water table" was considered by the difference between the land surface elevations "Digital elevation model (DEM)" and the static water level (SWL), the thematic layer produced for this factor and given in Figure 3 for the Na'ur aquifer and in Figure 4 for the Alluvium aquifer.The landuse factor describes the activities that exist in the area and may affect the groundwater quality. This factor is determined by using the landuse maps for the area. The thematic layer produced for this factor is given in Figure 5.Structural settings of the study area combined with the soil covers enhance the water percolation down to the groundwater. Geologic maps and aerial photography are used to determine the weight of the area according to this factor. The thematic layer produced for this factor is given in Figure 6.The aquifer media is the factor that affects this index and it describes the properties of the geologic beds that contain the water. Geologic maps, well logs and field studies are used to determine this factor. The thematic layer produced for this factor is given in Figure 7.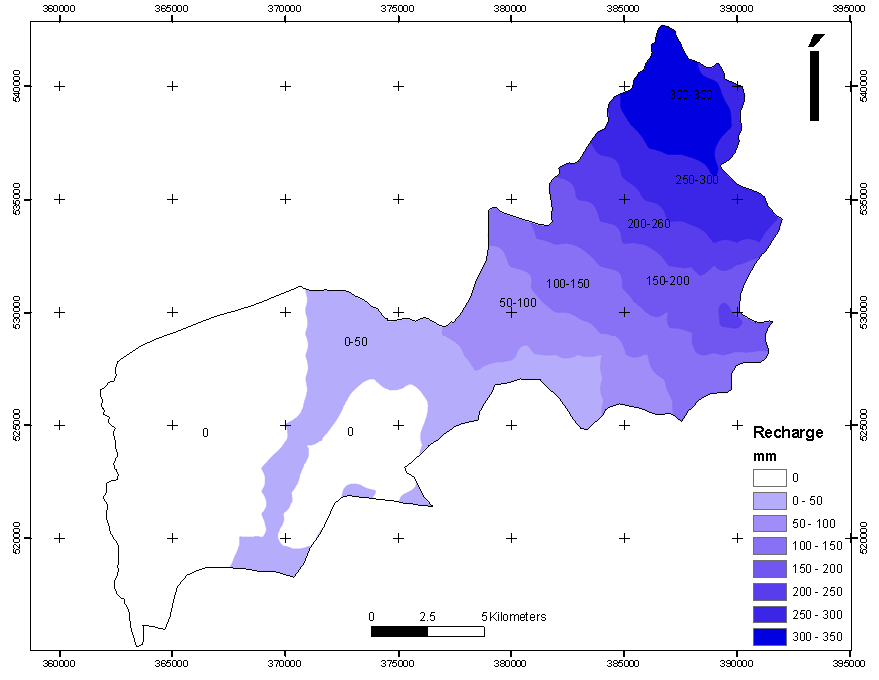 | Figure 2. Recharge amounts in the study area in a normal year |
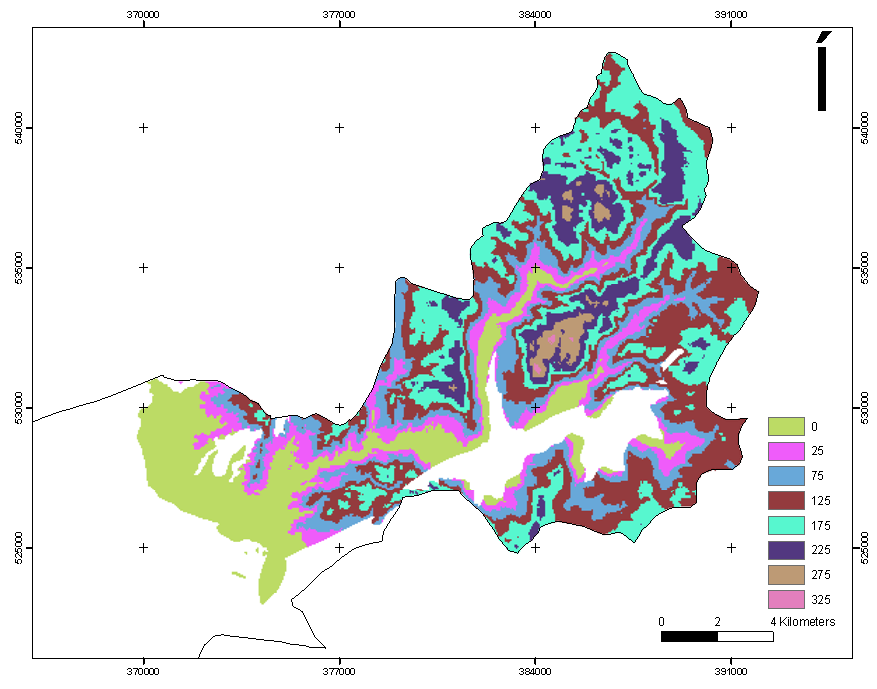 | Figure 3. Depth to water table factor in Na'ur aquifer |
 | Figure 4. Depth to water table factor in Alluvium aquifer |
 | Figure 5. Landuse factor map in the study area |
 | Figure 6. Lineaments and structure factor map in the study area |
 | Figure 7. Aquifer media factor map in the study area |
 | Figure 8. Vadose zone factor for the Na'ur aquifer |
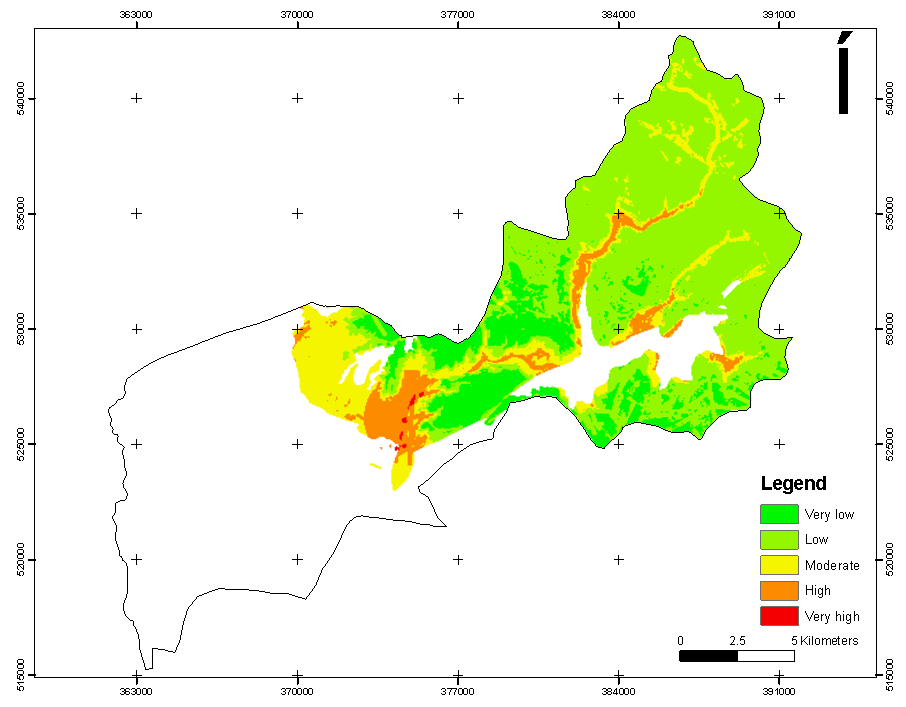 | Figure 9. Vulnerability map for the Na'ur aquifer |
The vadose zone factor describes the types of rocks that overlie the aquifer. The properties of this zone provide protection to the groundwater. Figure 8 shows the vadose zone of the Na'ur aquifer.After quantifying each factor parameters in the form of maps, these factors were multiplied in the environment of Arc GIS 9.2 by their weights (Table 1) and then the resulting maps added to each others to get the final vulnerability map for each aquifer. The areas are classified according to the rates given in Table 8.The resulting maps are produced in Figure 9 for Na'ur aquifer and Figure 10 for the Alluvium aquifer.The validation of results was performed with measuring the concentration of nitrate in the groundwater and comparing the NO3 concentration maps by the vulnerability maps. From the fitting of these two maps the validity of the index could be judge. Figure 11 shows the NO3 concentration and the groundwater vulnerability maps in Na'ur aquifer area and Figure 12 for the Alluvium aquifer.In the Na'ur aquifer the western areas show the higher NO3 concentration which classifies it as a high vulnerability area. The high concentrations of NO3 reflect that this area is actually high polluted area. Accordingly, it can be state that and then the produced vulnerability map is valid.For the alluvium aquifer, the western area shows higher NO3 concentrations. The groundwater vulnerability map reflects this fact and is accordingly considered as a valid map.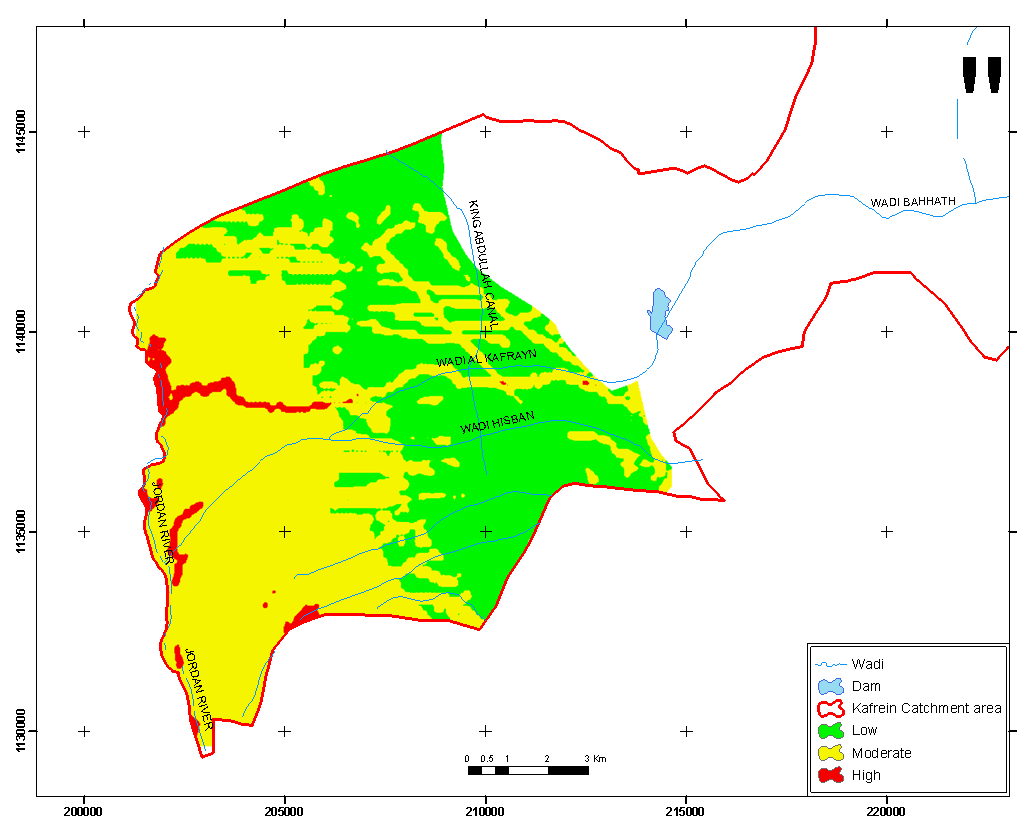 | Figure 10. Vulnerability map for the Alluvium aquifer |
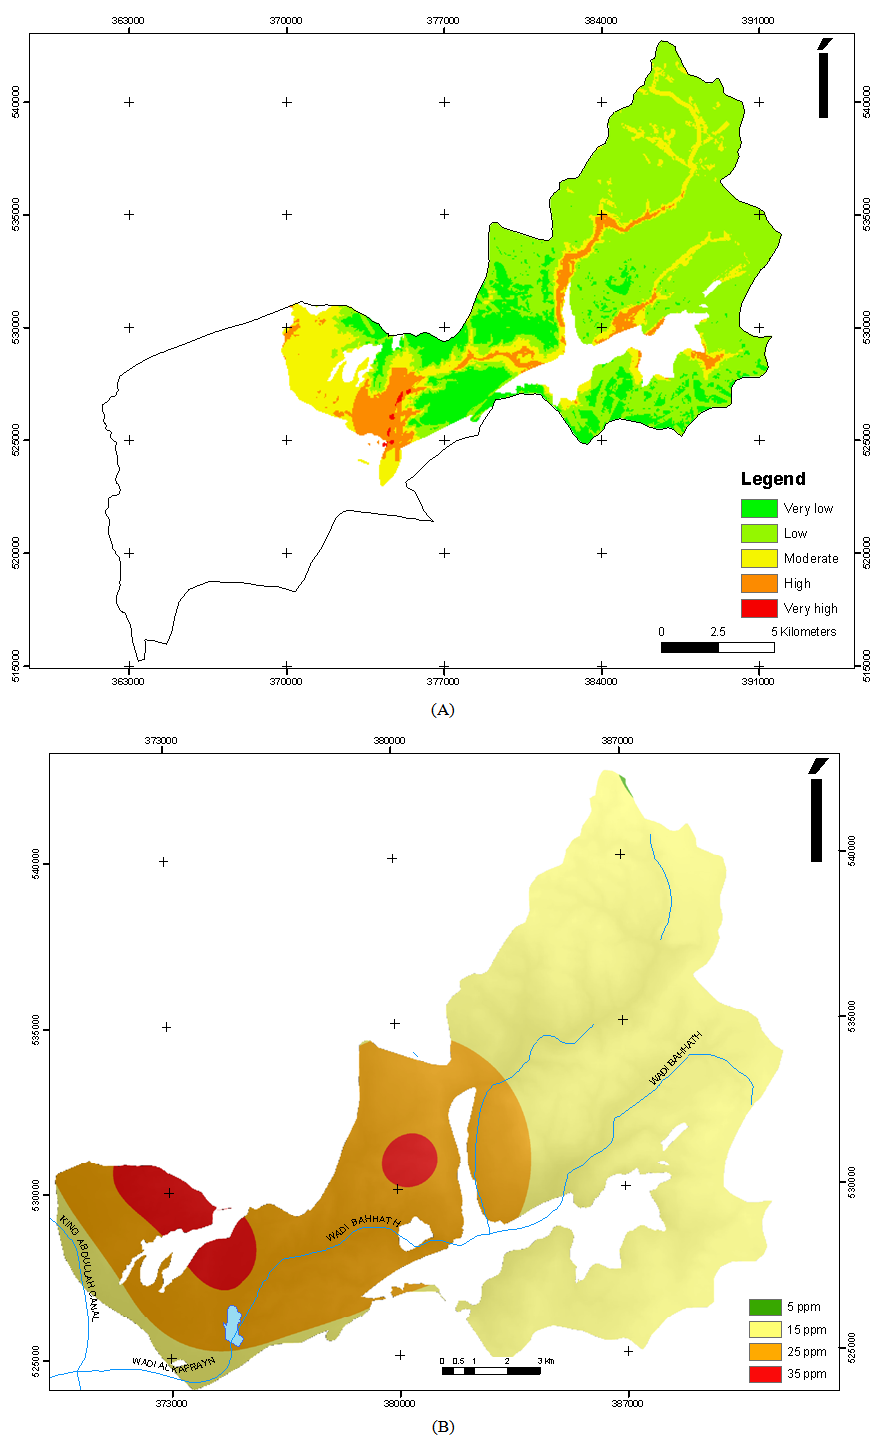 | Figure 11. (A) NO3 concentrations distribution map, (B) vulnerability map in the Na'ur aquifer |
 | Figure 12. (A) NO3 concentrations distribution map, (B) vulnerability map in the Alluvium aquifer |
4. Results
A modified groundwater vulnerability index was applied for the most important aquifers in the area; namely the Na'ur and the Alluvium aquifers.Na'ur aquifer shows that the study area classifies into five classes, ranging from a very low vulnerability class in the eastern parts of the aquifer where the depth to the groundwater is higher and the recharge factor is lower, to a very high vulnerability class in the western parts where the depth to water table is lower than in the eastern parts.The alluvium aquifer shows that the area classifies into three classes, ranging from a low class to a high class. The low vulnerability class of this aquifer lies in the eastern part of the aquifer where the depth to the groundwater is higher and the recharge factor is lower than in the western areas, to a high vulnerability class lies in the western parts where the depth to water table is lower than along the western parts.The validation process shows that the Na'ur aquifer reflects higher NO3 concentration in the higher vulnerability areas which sounds very good in such types of limestone aquifers. Also the alluvium aquifer gives the same validation result for the NO3 concentration validating herewith the modified index. Many factors affect the groundwater vulnerability in the dry area. The main factors include the recharge amounts that reach the groundwater and the depth to the groundwater. A new recharge approach was used to determine the vulnerability of this index, this approach calculate the recharge as the last remains after evaporation, runoff and soil retention took whatever they can from the rain water in addition to the fact that the groundwater recharge occurs in the wet period of the year.The new factors of landuse and lineaments are included in this index because they negatively affect the groundwater quality because the lineaments present weakness zones in the rocks permitting herewith the pollutants to reach the groundwater. Taking determination of the existing landuse into account will help in expecting the quality situation of the groundwater and the degree of pollution this water may exposed to in the future.Such studies must be expended to include other areas as pre development step to evaluate the water situation in an area and if it is suitable to the intended landuse and to restrict the types of activities that could cause harm to the groundwater in that area.Higher vulnerability areas must be considered as protection zones to prevent groundwater pollution and protect the groundwater resources.
References
| [1] | Murray, K., S., and Rogers, D, T (1999). Groundwater vulnerability, Brownfield Redevelopment and Land Use Planning. Journal of Environmental Planning and Management. Vol. (42), No. (6), pp. 801-810. |
| [2] | Salameh, E. & Bannayan, H., (1993): Water Resources of Jordan Present Status & Future Potentials. First edition, Fridrich Ebert Stiftung, Amman-Jordan. |
| [3] | NWMP: National Water Master Plan of Jordan (1977). Surface water resources, Natural resources Authority/Jordan and Bundesanstalt fuer Geowissenschaften und Rohstoffe / Germany. |
| [4] | Linsley, F. (1979). Water resources engineering, third edition. McGraw-hill. |
| [5] | Salameh, E. 2009. Effects of climatic changes on surface and groundwater resources in the northwestern parts of Jordan (SMART Project final report University of Karlsruhe/ Germany. |
| [6] | Salameh, E. 2009. Personal communication. |
| [7] | DOM: Department of Meteorology/ Jordan (Open files). |
| [8] | WAJ: Water Authority of Jordan (Open files). |
 Abstract
 Reference
 Full-Text PDF
 Full-text HTML