-
Paper Information
- Next Paper
- Paper Submission
-
Journal Information
- About This Journal
- Editorial Board
- Current Issue
- Archive
- Author Guidelines
- Contact Us
World Environment
p-ISSN: 2163-1573 e-ISSN: 2163-1581
2014; 4(1): 1-13
doi:10.5923/j.env.20140401.01
Long Range Transport Contribution to PM10 Concentrations in a Subtropical City (Qena/Egypt)
 Abstract
 Reference
 Full-Text PDF
 Full-text HTML
Kassem Kh. O.
Physics Department, Faculty of Science, South Valley University, 83523 Qena, Egypt
Correspondence to: Kassem Kh. O., Physics Department, Faculty of Science, South Valley University, 83523 Qena, Egypt.
| Email: |  |
Copyright © 2012 Scientific & Academic Publishing. All Rights Reserved.
Particulate matter (PM10) concentrations have been measured during the period (May-2006 to April-2012) in forecasting and research center, south valley university in Qena-Egypt. The data have been matched with backward air mass trajectories calculated by HYSPLIT4 for assessing long range transport influence in PM10 concentrations. In this regard, Effect of different air masses has been studied using clustering technique of backward air mass trajectories during the whole period as well as during different seasons. Statistical analysis techniques have been used for assessing significance of inter- cluster variation in PM10 concentration and explained variance of PM10 by different clusters as well as for defining the significant differences in PM10 concentration associated with different clusters. In addition, probable source regions of PM10 have been determined. Results show that seasonal average PM10 concentrations characterized with maximum value 103 ± 7% µg/m^3 in spring and minimum values 89 ± 6% µg/m^3 and 89 ± 5% µg/m^3 in winter and autumn, respectively. Northern clusters comprised68%, 52%,88%and71% of the total number of trajectories during all the period, spring, summer and autumn, respectively. One of these clusters in each period is associated with the maximum concentration of PM10, 105 µg/m^3, 124 µg/m^3, 139 µg/m^3 and 97 µg/m^3, respectively. The situation is changed during winter, where, air masses are originated mostly from northwest direction with 44% of the trajectories, with maximum concentration 100 µg/m^3associated with one of these clusters. North of Africa and south-west of Turkey are found to be the most probable sources of PM10 during spring and all the period, respectively.
Keywords: PM10, Trajectory clustering, Long range transport, Qena, Egypt
Cite this paper: Kassem Kh. O., Long Range Transport Contribution to PM10 Concentrations in a Subtropical City (Qena/Egypt), World Environment, Vol. 4 No. 1, 2014, pp. 1-13. doi: 10.5923/j.env.20140401.01.
Article Outline
1. Introduction
- Particulate matter (PM) is an air pollutant consisting of a mixture of solid and liquid particles suspended in the air. It can either be directly emitted into the air, primary PM, or be formed secondarily in the atmosphere from gaseous precursors. Primary PM can have anthropogenic and non anthropogenic sources (for primary PM, both biogenic and geogenic sources may contribute to PM levels[1].PM10 is a particulate matter with aerodynamic diameters smaller than 10µm. PM10 has negative effects on human health[2-9]. About 8% of deaths from lung cancer, 5% of deaths from cardiopulmonary disease and about 3% of deaths from respiratory infections are caused by Particulate matter[10-12]. It may have an effect on climate change and visibility[13,14]. Also, it can play an important role in deterioration of atmospheric chemistry[15,16]. Egypt realized early the problem of air pollution through authorization of the environmental act no. 4 for the year 1994. Accordingly, the maximum permissible level of PM10 is 70 µg m-3 (24 hrs)[17,18]. In Egypt, PM10 and other air pollutants have been treated using surface meteorological parameters, for instance[19-21]. All these studies were on the atmosphere of Cairo; the most populated and polluted city in Egypt. Qena ( 26 17' N, 32 43' E, 97 m asl) is a subtropical province in south of Egypt, located in upper Egypt about 600 Km south of Cairo. It is surrounded by industrial sources of PM10; Aluminum and Sugar factories located about 60 km south west, one sugar factory, 30 km west. At about 20 km south of Qena, there are two factories, one of them is for cement and the other is for paper in addition to one sugar factory at about 30 km and an industrial city located at about 5 km. In spite of this, there is significant shortfall in PM10 concentrations study in Qena and its affect by local and regional transportation.[22] studied the number concentration and size distribution of the suspended dust particles in the atmosphere of Qena. He found that the concentration of the suspended particles decrease with increasing size according to Junge power law size distribution. He also found positive correlation coefficient between total suspended dust and both of temperature and wind speed, and negative correlation coefficient with relative humidity. Also,[23] studied the effect of some weather parameters and stability classes on PM10 concentrations in Qena. He stated that there are insignificant multiple correlations between PM10 concentrations and the weather parameters (temperature, relative humidity and wind speed), the multiple correlations increased when he used monthly averaged values of the data. He also found that the PM10 concentrations decrease with decreasing instability of the atmosphere. Air mass trajectories were defined as the paths of infinitesimally small particles of air[24]. There are two kinds of trajectories, forward and backward, forward trajectories can be used to study the influence and area affected by pollutant transport from point or area sources[25, 26], while, backward trajectories may be used to analyze the source region and impact of pollution sources at the measuring site[27, 28].Air mass trajectories were widely used for studying the effect of long range transport of PM10 and other pollutants. For instance,[29] were the first to consider trajectory coordinates as the clustering variables.[30] used the air mass clustering for interpreting the influence of synoptic-scale atmospheric transport patterns on observed levels of sulfate, nitrate and PM10 at Belfast and Harwell, UK.[31] calculated daily back-trajectories to analyze 7 years of precipitation and PM2.5 data from three National Park sites in the Western US. [32] used trajectory clustering methodology for interpreting 5-yr time-series data of ozone concentrations at Whiteface Mountain, United States. This work aims at studying the effect of long range transport patterns on measured surface PM10 in Qena by using clustering algorithm of air mass trajectories. As well as identifying different air mass origins affecting PM10 levels during the period, May-2006 to April-2012, and during different seasons of the same period.
2. Materials and Methods
2.1. Site and Data Collection of PM10
- The climate of Egypt found in North Africa is determined mainly by its position in tropical latitudes and the vast area occupied by the Sahara Desert. In winter, the atmospheric circulation over North Africa develops in connection with the Saharan Anticyclone, centered over an area south of the Atlas Mountains, wedges of the Azores High, the Arabian and Balkan Highs, the Mediterranean depressions, and the equatorial lows over central Africa. Except in the Mediterranean zone, where the prevailing winds are westerly, the rest of North Africa has northerly and north-easterly trade winds. Egypt may be affected by Khamasin dust storms which appear in the middle of March and blow from 2-3 days, 4-6 times during the 50 days following the vernal equinox. The relatively warm Mediterranean Sea area attracts cool masses of maritime polar air and sometimes maritime Arctic air from the Atlantic, and continental air from Europe. In the summer, the atmospheric circulation and weather are determined by the continental depressions over Mesopotamia and the Arabian Gulf, over southern Sahara and southern Sudan, and by the high pressure areas lying over central Africa.The northerly and north-easterly winds in Lower Egypt are an extension of the etesian winds that blow across the eastern Mediterranean[33]. The climate of Qena ( 26 17' N, 32 43' E, 97 m asl) is characterized by very hot and dry summer season with average daily maximum temperature T = 40℃ and average daily minimum RH = 17%, cold winter with average daily maximum temperature T = 25 and average daily minimum RH = 26%[34]. It rarely rains. Seasonal average maximum mixing height varied from 1418 m to 2481 m during winter and summer, respectively[35]. It receives large quantity of solar radiation, especially in summer. During spring season, it may suffer from dust storms due to khamasin depression.
2.2. Data Collection
- The data of PM10 have been monitored in South valley university forecasting and research center at Qena / Upper Egypt during the period from May-2006 to April-2012. One sample each day after day at 9 AM (7 MGT) has been measured using high volume PM10 sampler (GRASEBY GMW) INLET Serial No. 715. Glass Microfiber filters GF/A (20.3x25.4 cm) CAT No. 1820-866 Whatman instrumental Lid have been used for collecting the PM10 particles. The filter has been waited before and after sampling by Sartorius balance, TE 214S, max. 210 g, d = 0.1 mg. Sampling started at 9 AM and ended at 11 AM. This period for sampling is selected to coincide with the morning maximum peak of PM10. This increase at morning hours may be related to the small height of mixing layer, or to traffic and local sources, or may be attributed to the vertical mixing of pollutants found in the upper layers of the atmosphere after the nocturnal inversion disappears[23, 34].
2.3. Trajectory Analysis
- Air mass back trajectories were calculated for clarifying the origin of the air masses affecting Qena city. We used the Hybrid Single-Particle Lagrangian Integrated Trajectory (HYSPLIT4) model for calculating backward air trajectories arriving at the observation site. HYSPLIT4 is a complete system for computing air mass trajectories and complex dispersion and deposition simulations[36, 37]. Meteorological data fields to run the model are available from Global NOAA-NCEP/NCAR pressure level reanalysis data archives. It is available on ARL's (Air Resources Laboratory) web site from 1948 through the end of the previous year. The global data are on a latitude longitude grid (2.5 degrees) and 17 vertical pressure levels. The accuracy and limitations of trajectory calculations have been investigated by several authors. The accuracy of an individual trajectory limited by temporal and spatial resolution of meteorological observations, measurement errors, analysis errors and by any simplifying assumptions used in the trajectory model[38-40]. In order to allow for the uncertainty in the trajectory analysis, 3-day isentropic backward trajectories at 200 m above ground level (agl), were calculated at ( 8 AM), 6 Greenwich Mean Time (GMT). An isentropic trajectory was used since it thought to reflect more realistic motion of air parcels by taking into account the vertical motions of an adiabatic atmosphere[41]. The trajectories were matched with PM10 data measurements. For each 3-day (72 h) back trajectory, 72 x-y coordinates (i.e. end points of the trajectory location at every hour) are utilized as input variables for the Clustering Algorithm.
2.4. Clustering Algorithm
- Trajectory Cluster Analysis is a process of grouping similar trajectories together whereby differences among individual trajectories in a cluster are minimized and differences among clusters are maximized. The cluster process is explained in details by[37]. In general, the result of application of the cluster analysis technique to air trajectories is similar to a flow climatology in which trajectories are classified into groups according to certain criteria, but cluster analysis is more objective, and it accounts for variation in transport speed and direction simultaneously, yielding clusters of trajectories which have similar length and curvature[41, 42].The number of discussed trajectories in Qena during the period of study was 781 trajectories, distributed to 184, 208, 211 and 192 trajectories in winter, spring, summer and autumn, respectively. The Kruskal-Wallis test[43] has been applied to investigate the existence of significant differences between means of PM10 concentrations associated with different clusters. Single-classification analysis of variance ANOVA has been used to estimate the explained variance of PM10 concentrations by different clusters, also, Tukey-Kramer minimum significant difference for each pair of means has been calculated using spreadsheet to do one-way anova (URL: udel.edu/~mcdonald/anova.xls.).
3. Results and Discussion
3.1. Seasonal Variation of PM10
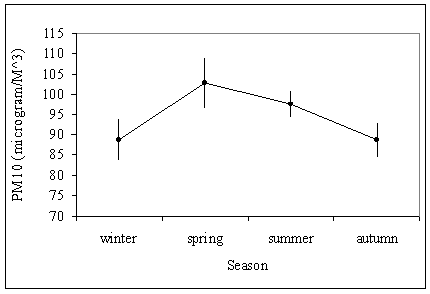 | Figure (1). Mean seasonal variation of PM10 concentrations in Qena during the period of study |
3.2. Cluster Analysis
3.2.1. All the Period
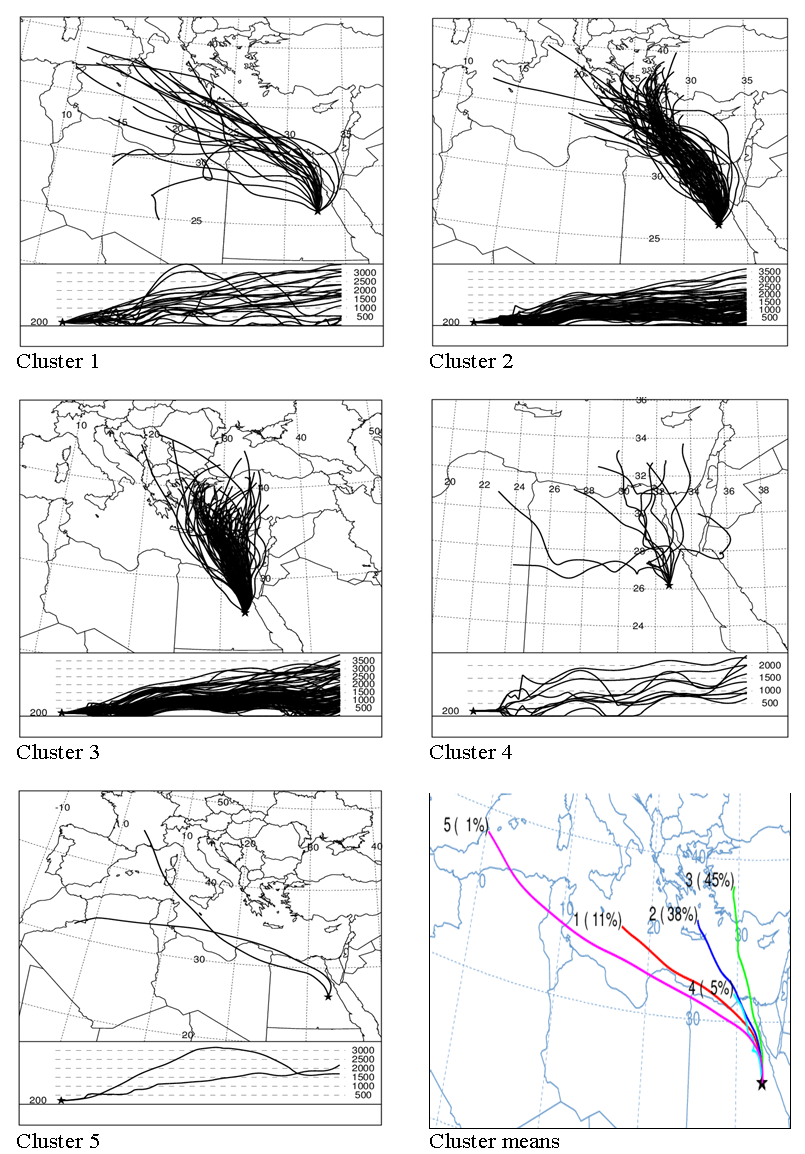
- Backward air mass trajectories during all the period have been classified to five clusters as shown in figure (2) which illustrates the five clusters and the cluster means. Investigating the clusters revealed that two clusters were in the northern direction, Cl2 and Cl3. Two clusters were in the north-western direction, Cl1 and Cl4. One cluster was in the eastern direction, Cl5. Cl2 is originated in south-west of Turkey. Cl3 is originated in north of Egypt and south of Mediterranean Sea. Cl1 is originated in south of Europe. Cl4 is originated in north of Africa. The eastern cluster, Cl5, is originated in middle of the Arabian Peninsula. The northern clusters represented 68% of the total trajectories. The north western clusters 27% and the eastern cluster 5%, see cluster means in figure (2). PM10 mean values associated with the five clusters during all the period are presented in figure (3). PM10 mean values varied from relatively low value 77 µg/m^3 associated with Cl1 to relatively high value 105 µg/m^3 associated with Cl3.
3.2.2. Winter Season
- The five clusters in winter season are originated from north, north-west and east directions as shown in figure (4). One cluster was in the northern direction, Cl3, and three clusters were in the north-west direction, CL2, Cl4 and Cl5. Also, one cluster was in the eastern direction, Cl1. The origin of Cl3 is the west of turkey. The two clusters Cl2 and Cl4 are originated from north of Africa and south of Mediterranean Sea. Cl5 is originated from the north of Mediterranean Sea and south of Europe. Cl1 is originated from north of Arabian Peninsula. The northern cluster, Cl3, is composed of 33% of the total number of trajectories in winter season. The three north-western clusters comprised of 44% of the total trajectories. The eastern cluster, CL1, included only 27% of the total trajectories as shown in cluster means in figure (4). PM10 mean values in winter ranged from 88 µg/m^3 associated with Cl3 to 100 µg/m^3 associated with Cl5 as seen in figure (3).
3.2.3. Spring Season
- In spring, the number of clusters in the northern direction increased from that in winter to be two clusters, Cl2 and Cl3. In the same time, the number of clusters in the north-western direction decreased to be two clusters, Cl1 and Cl5. The eastern direction retained one cluster, Cl4, as shown in figure (5). Cl2 is originated in the middle of Europe. Cl3 is originated in south of Turkey. Cl1 is originated in the Mediterranean Sea. Cl5 is originated in north of Africa. Cl4 is originated in west of Arabian Peninsula. Figure of cluster means in Figure (5) illustrates that (52%) of the total trajectories in spring are found in the northern clusters and (28%) in the north-western clusters. While, only (12%) are found in the eastern cluster. Figure (3) reveals that PM10 concentrations varied from 89 µg/m^3 associated with Cl1 to 124 µg/m^3 associated with Cl2.
3.2.4. Summer Season
- The situation differed in summer, where, the eastern cluster found in winter and spring disappeared and the number of clusters in the northern direction increased to be three clusters, Cl2, Cl3 and Cl4. The north-western direction is still including two clusters, Cl1 and Cl5, as shown in figure (6). The northern clusters are originated from west of Turkey (Cl3), and south of Greece (Cl2), Cl4 is relatively short and originated in north of Egypt and south of Mediterranean Sea. The north-western clusters are originated in middle of Mediterranean Sea (Cl1) and south of Spain (Cl5). The northern clusters included (88%) of the total trajectories, while the north-western clusters represented only (12%) as shown in cluster means in figure (6). PM10 varied from 68 µg/m^3 associated with Cl1 to 139 µg/m^3 associated with Cl4 as seen in figure (3).
3.2.5. Autumn Season
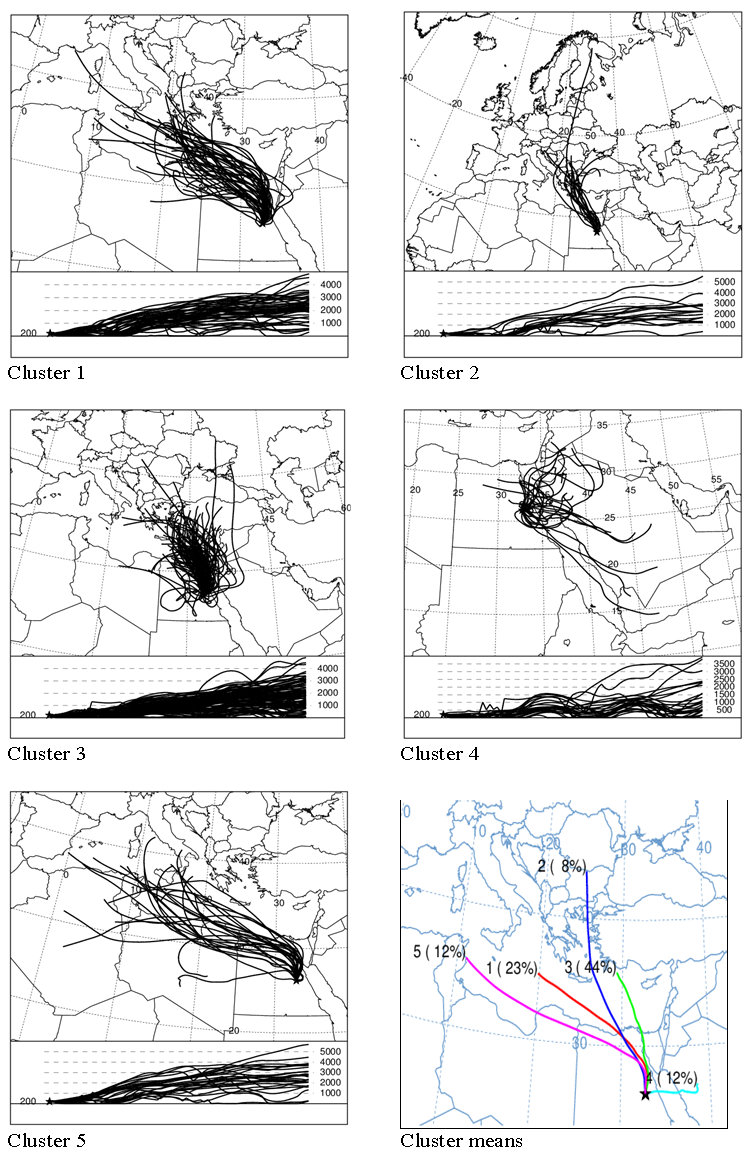
- In autumn there were three clusters in the northern direction, Cl2, Cl3 and Cl4. The number of clusters in the north-western direction decreased to one cluster, Cl1. The eastern cluster came back again, Cl5 as illustrated in figure (7). Cl2 originated from west of Turkey, Cl3 originated from south of Mediterranean Sea and north of Egypt, Cl4 originated from south of Turkey and north of Mediterranean Sea. Cl1 is originated from middle of the Mediterranean Sea, and Cl5 is originated from the Arabian Peninsula. The northern clusters represent 71% of the total trajectories. The north-western cluster represents 19% and the eastern cluster represents 10%, see cluster means in figure (7). PM10 concentration varied from 68 µg/m^3 associated with Cl1 to 97 µg/m^3 associated with Cl3 as seen in figure (3).As stated in section (2.1), the resulted directions of the air mass trajectory clusters are determined by the formation of Saharan Anticyclone centered over an area south of the Atlas Mountains, wedges of the Azores High, the Arabian and Balkan Highs, the Mediterranean depressions, the equatorial lows over central Africa during winter. It is determined also by the continental depressions over Mesopotamia and the Arabian Gulf, over southern Sahara and southern Sudan, and by the high pressure areas lying over central Africa in summer season. Spring and autumn seasons are transitional periods between winter and summer seasons.
3.2.6. Monthly Distribution of Cluster Trajectories
- Monthly distribution of cluster trajectories during all the period and during each season is illustrated in figure (8). Within the five clusters of all the period, Cl2 comprises the greatest number of trajectories (403 trajectories), these trajectories are found, in most, in the months from July to October. In winter, there are two clusters including the greatest number of trajectories, Cl1 includes 52 trajectories and Cl3 includes 53 trajectories. Most of Cl1 trajectories are found in December (28 trajectories), while, the greatest number of Cl3 trajectories are found in February (22 trajectories). In spring, most of trajectories are found in Cl1 (48 trajectories) and Cl3 (92 trajectories). The two cluster trajectories distributed semi equally through spring months. Most summer trajectories are found in Cl2 (80 trajectories) and Cl3 (96 trajectories). Most trajectories of Cl2 are found in July and Augustus, While, most trajectories of Cl3 are found in June and July. In autumn, the greatest number of trajectories are found in Cl2 (58 trajectories), most of them, 28 trajectories, are found in December.
3.2.7. Statistical Analysis
- Kruskal Walles test is applied on the whole period as well as in each season clusters to investigate the existence of significant differences between means of PM10 concentrations associated with different clusters. It is found that there was significant difference at α=0.05 between means of PM10 concentrations associated with different clusters in spring and summer as well as in the whole period. While in winter and autumn, there was not. Applying ANOVA and Tukey-Kramer minimum significant difference for each pair of means revealed that during the whole period, Cl3 and Cl2 are significantly increased on Cl1, the explained variance was only 2%. In summer, Cl4 is significantly increased on Cl1, the explained variance of PM10 by different clusters was 6%. This result indicates the weak effect of long range transportation on PM10 concentration in Qena. This may be due to the huge west and east deserts surrounding it and controlling its climate.
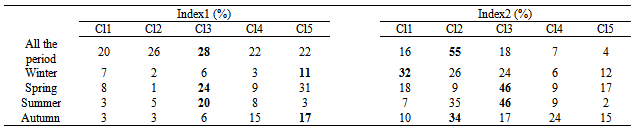
3.2.8. Source Regions of PM10
- For assessing the probable source region of PM10, the value of 75th percentile (137 µg/m^3) calculated from the hourly data during all the study period has been considered as a threshold value. Two indices, Index(1)% and Index(2)% corresponding to the probability and frequency, respectively, of hourly PM10 concentration associated with different clusters of trajectory positions were calculated using the same manner as[45, 46]. Table (1) illustrates the values of Index1 (%) and Index2 (%) for PM10 concentration values during all the period and during different seasons, maximum values during each period are written in bold. The values of index1(%) characterized with lowest probability (1%) associated with Cl2 during spring season which is originated in the middle of Europe, and most probability (31%) associated with Cl5 in the same season which is originated in north of Africa. The values of index2 (%) varied from the lowest value (2%) associated with Cl5 during summer season which is originated in south of Spain to the maximum value (55%) associated with Cl2 during the whole period which is originated in south-west of Turkey.
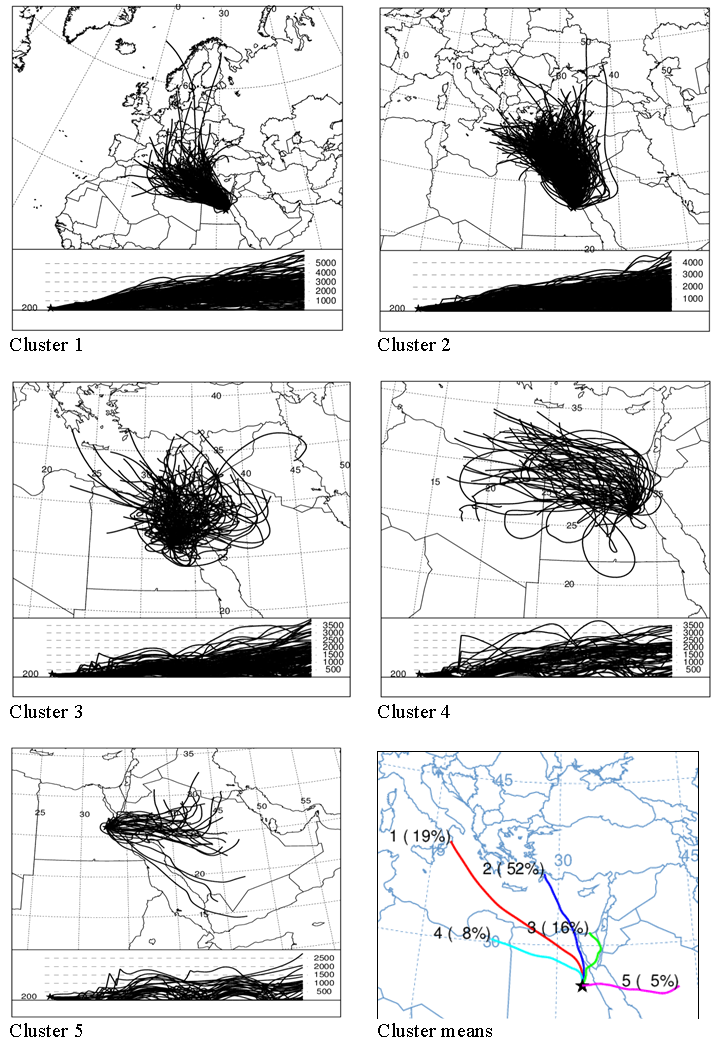 | Figure (2). Five clusters of backward air mass trajectories during all the period of study (2006-2012): The upper panel illustrates the horizontal motion and the lower one represents the vertical coordinate. The lower-right figure represents the cluster means. In cluster means figure, the numbers 1, 2, .., 5 represent the cluster numbers, and number in prickets represents the percentage |
 | Figure (3). PM10 mean values associated with the five clusters during all the period and during different seasons. The solid circle refers to the mean concentrations. The upper and lower lines of the box represent the 75th and 25th percentiles, respectively. The upper and lower triangles represent the 99th and 1th percentiles, respectively |
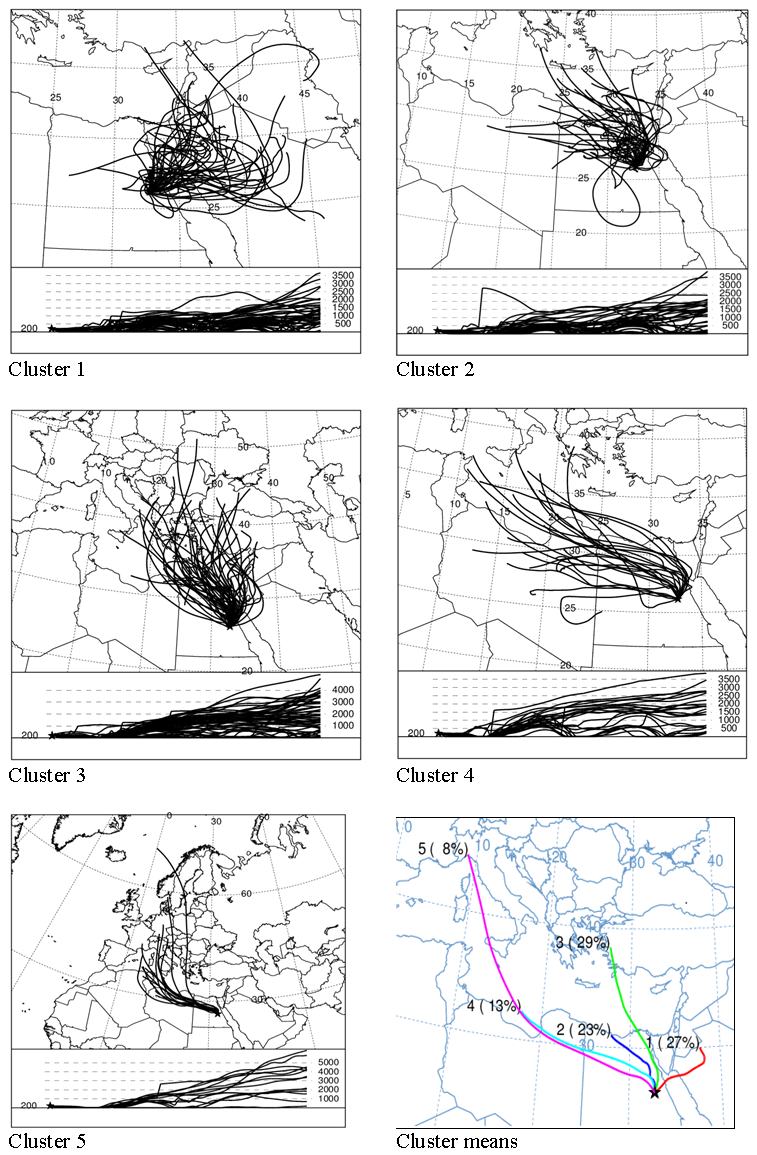 | Figure (4). The same as figure (2) but for winter seasons |
 | Figure (5). The same as figure (2) but for spring seasons |
 | Figure (6). The same as figure (2) but for summer seasons |
 | Figure (7). The same as figure (2) but for autumn seasons |
 | Figure (8). Distribution of cluster trajectories on months during all the period and during different seasons |
|
4. Conclusions
- The aim of this study was to investigate the role played by different air masses on PM10 concentration in Qena as a sub tropical region. The study revealed that most air mass trajectories are found in the northern clusters during the whole period analysis as well as during spring, summer and autumn seasonal analysis. One of these clusters in each period was associated with the maximum concentration of PM10, 105 µg/m^3, 124 µg/m^3, 139 µg/m^3 and 97 µg/m^3, respectively. While, during winter season, most of trajectories are found in north western clusters, with maximum concentration 100 µg/m^3 found to be associated with one of these clusters. North of Africa and south-west of Turkey were found to be the most probable sources of PM10 during spring and all the period, respectively. Statistical analysis revealed that there was significant difference at α=0.05 between means of PM10 concentrations associated with different clusters in spring and summer as well as in the whole period. While in winter and autumn, there was no significant difference. During the whole period, Cl3 and Cl2 are significantly increased on Cl1, the explained variance of PM10 by different clusters was only 2%. In summer, Cl4 is significantly increased on Cl1, the explained variance was 6%. The small value of explained variance indicates the strong effect of vast Sahara Desert and local factors on PM10 concentrations in Qena.