-
Paper Information
- Next Paper
- Previous Paper
- Paper Submission
-
Journal Information
- About This Journal
- Editorial Board
- Current Issue
- Archive
- Author Guidelines
- Contact Us
World Environment
p-ISSN: 2163-1573 e-ISSN: 2163-1581
2013; 3(4): 133-137
doi:10.5923/j.env.20130304.02
Determination of Carbon Monoxide Concentration in Industrial and Commercial Areas of Kano Metropolis, Kano State, Nigeria
 Abstract
 Reference
 Full-Text PDF
 Full-text HTML
Bernard Emmanuel
Department of Chemistry, Federal College of Education (Technical) Bichi P.M.B 3473, Kano, Nigeria
Correspondence to: Bernard Emmanuel, Department of Chemistry, Federal College of Education (Technical) Bichi P.M.B 3473, Kano, Nigeria.
| Email: |  |
Copyright © 2012 Scientific & Academic Publishing. All Rights Reserved.
The incomplete combustion of organic fossil fuels such as oil, gas or coal is a common source of carbon monoxide (CO) pollution in the environment and when inhaled into the body it combines with the blood, preventing it from absorbing oxygen, causing illness and even death at high concentration. A mean value of 14.13 parts per million ( ppm) was observed for the Metropolis, while the highest mean value of 18.00 ppm for Bata a highly crowded commercial area followed by a mean value of 16.92ppm for Sharada industrial layout with Sabon Gari having a mean of 9.67 ppm, the least mean value of 8.52 ppm was detected at Challawa. The study indicated that Kano Metropolis dwellers were generally exposed to higher levels of CO which is above the World Health Organisation (WHO) permitted value of less than 9ppm over an 8 hour period. It is recommended that the government should make urgent efforts to improve power generation, since this will reduce dependence on generators for power supply and increase awareness of health risks from exposure amongst others.
Keywords: Determination, Carbon Monoxide, Concentration, Industrial, Commercial, Metropolis
Cite this paper: Bernard Emmanuel, Determination of Carbon Monoxide Concentration in Industrial and Commercial Areas of Kano Metropolis, Kano State, Nigeria, World Environment, Vol. 3 No. 4, 2013, pp. 133-137. doi: 10.5923/j.env.20130304.02.
Article Outline
1. Introduction
- Carbon monoxide (CO) is a colorless, odorless, tasteless, nonirritating and toxic gas that is slightly lighter than air. It is present in small amounts in the atmosphere, chiefly as a product of volcanic activity, industrial processes, human and animal respiration, cigarette smoke, natural and man-made fires (such as forest and bushfires). The burning of fossil fuels is the principal source of CO pollution in most industrial, commercial and large urban areas. Incomplete oxidation during combustion of fuels like wood, coal, oil, paraffin, natural gas, trash and unvented gas or kerosene heaters may cause high concentrations of CO in air. Auto truck or bus exhaust from attached garages, nearby roads, or parking areas can also be a source. Because natural sources of carbon monoxide are so variable from year to year, it is extremely difficult to accurately measure natural emissions of the gas. In the atmosphere it is spatially variable, short lived, having an indirect radiative forcing effect by the formation of methane and ground-level ozone[1][2][3][4]. Through natural processes in the atmosphere, it is eventually oxidized to carbon dioxide. At lower levels of exposure, CO causes mild effects that are often mistaken for the flu. They include fatigue, dizziness, irregular breathing, disorientation, cherry red lips, nausea, headache, paleness, and coughing. The effects of CO exposure can vary greatly from person to person depending on age, overall health condition, the concentration of the gas and length of exposure. Because it is impossible to see, taste or smell the toxic fumes, CO can kill one before one is aware of its existence. In human CO is naturally produced by the action of heme oxygenase 1 and 2 on the heme from hemoglobin breakdown. This process produces a certain amount of carboxyhemoglobin (COHb) in normal persons, even if they do not breathe any carbon monoxide[5][6][7]. In the United States and other parts of the world CO is noted as the leading cause of poisoning mortality and may be responsible for more than half of all fatal poisonings worldwide. It is the most common type of fatal air poisoning in many countries. It combines with hemoglobin to produce COHb, which is ineffective for delivering oxygen to bodily tissues. The percentage of hemoglobin inactivated by CO depends on the amount of air breathed, the concentration of CO in air, and length of exposure.[8][9][10][11][12]The USA Centers for Disease Control and Prevention reported that from 1968 to 1998, non–fire-related CO poisoning caused or contributed to 116,703 deaths, 70.6% of which were due to motor vehicle exhaust, and 29% of which were unintentional. An estimated 5000 to 6000 people die in the United States each year as a result of CO exposure. The rate of accidental deaths seems to have declined from 1513 per year in 1979 to approximately 500 to 600 per year in the 1990s, likely owing to the widespread use of catalytic converters on automobiles and improved emissions policies. The Clean Air Act gives state and local government primary responsibility for regulating pollution from power plants, factories, and other “stationary sources.” The Environmental Protection Agency (EPA) has primary responsibility for “mobile source” pollution control. The EPA motor vehicle program has achieved considerable success in reducing carbon monoxide emissions. EPA standards in the early 1970’s prompted automakers to improve basic engine design. By 1975, most new cars were equipped with catalytic converters designed to convert carbon monoxide to carbon dioxide. Catalysts typically reduce CO emissions by about of 80 percent. In the early 1980’s, automakers introduced more sophisticated converters, plus onboard computers and oxygen sensors to help optimize the efficiency of the catalytic converter.While ambient carbon monoxide levels have dropped, despite large increases in the number of vehicles on the road and the number of miles they travel in developed nations the reverse is the case of developing world like Nigeria. It is argued that this is an important current source of health inequality between the developed and developing nations created partly by the massive importation of used automobiles.[9][13][14][15]The World Health Organization’s (WHO) guidelines values and periods of time-weighted average for carbon monoxide exposure are expressed at four averaging times, determined in such a way that the COHb. level of 2.5% is not exceeded, even when a normal subject engages in light or moderate exercise as follows: 87ppm for 15 min, 52ppm for 30 min, 26ppm for 1 h, 9ppm for 8 h[16][17]In Kano Metropolis there has been several cases of death recorded in connection with CO poisoning especially when people find themselves sleeping in same room with or close to a power generating set and in the event of fire outbreak. This has made it very relevant to ascertain the level of CO present in the industrial and commercial areas in Kano metropolis and to enlighten the populaces of the danger of high concentration of CO.
2. Materials and Method
2.1. Study Area
- The study was carried out at different industrial and commercial areas where some of the most heavily populated and industrialized areas of Kano Metropolis, Kano State of Nigeria. Samples of Carbon Monoxide were measured. A total of one hundred and ninety seven (197) samples were taken between September, 2012 and January, 2013 on a continuous basis throughout the sampling period. The sample sites are: Bata (the east of the City) surrounded by Sabon-Gari to the North. Sabon-Gari is located west of Mallam Aminu Kano International airport, while the industrial areas Sharada is outside the City walls, and Challawa industrial area is bounded by rail line south-west of the City walls.
2.2. Instrumentation
- The Crowcon-Gasman “TO” detection instrument was used. The Gasman “TO” is designed to monitor for the presence of specific toxic gases, and is certified to EEx ia IIC T3/T4. Temperature classification T3 applies if the unit is fitted with the Crowcon rechargeable battery pack, while the T4 applies if the unit is fitted with disposable batteries. To adjust the span of the “TO” version gas of known concentration and reliable delivery systems to the sensor are required. The calibration gas test kits, comprising gas mixtures, either in disposable cylinders, regulator, and tube and calibration adaptors were used. The calibration adaptor was fitted into the top of the sensor housing and the gas cylinder valve was opened. The gas flow rate was set to sensor 0.5l/min and the reading on the display was allowed to stabilize. The CAL preset was adjusted so that the display indicated the concentration shown on the cylinder. With the units
3. Results and Discussion
- The present study shows the ambient carbon monoxide (CO) inputs in the industrial and commercial areas of Kano State. With the exception of Challawa with a mean of 8.93ppm, it was observed that the concentration of CO is higher than the internationally permitted standard of below 9ppm over an 8 hour average period.[18]. The monitored zones were divided into four having Sharada and Challawa industrial layouts as industrial area because of the high concentration of industries and industrial activities, while Bata and Sabon Gari were designated commercial areas due to the high concentration of commercial/business activities. The mean, standard deviation and coefficient of variation for CO gas in the metropolis are shown in Table 1.
|

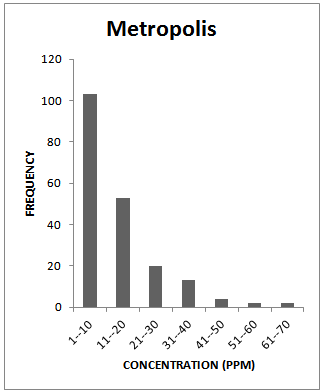 | Figure 1a. Frequency Distribution Pattern for Metropolis |
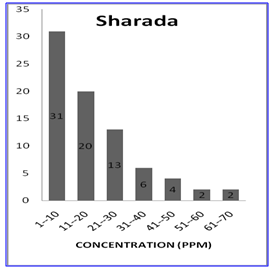 | Figure 1b. Frequency Distribution Pattern for Sharada |
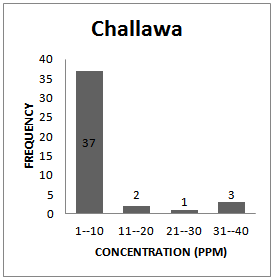 | Figure 1c. Frequency Distribution Pattern for Challawa |
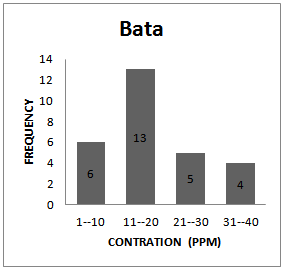 | Figure 1d. Frequency Distribution Pattern for Bata |
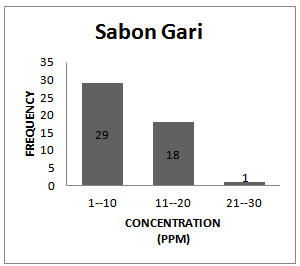 | Figure 1e. Frequency Distribution Pattern Sabon Gari |
4. Conclusions
- In Nigeria, with a developing economy fuel combustion in cars and by the numerous electric power generating sets which serve as more reliable source of power due to the epileptic power supply from the national power company - Power Holding Company of Nigeria (PHCN) the massive importation of electric power generating sets for both industrial and domestic use and importation of used automobiles that are poorly maintained / serviced will most certainly increase the CO emissions. It is responsible for a large percentage of the accidental poisonings and deaths reported throughout the world each year. Certain conditions exist in both the indoor and outdoor environments that cause a small percentage of the population to become exposed to dangerous levels of carbon monoxide. Outdoors, concentrations of carbon monoxide are highest near street intersections, in congested traffic, near exhaust gases from internal combustion engines and from industrial sources, and in poorly ventilated areas.[19]Preventive measures to be taken include avoiding running of any internal combustion engine equipment in an enclosed space such as a closed garage. Also noisy engine often indicate a faulty exhaust system. Check the system and have it repaired if there is a blown-out gasket, loose exhaust manifold, leaking exhaust pipe connections or holes in the muffler, Make sure that fuel-burning equipment is installed by qualified, licensed or trained persons. Such installation should conform to all local codes and standards. Prompt automakers to improve basic engine design and equip automobile with catalytic converters designed to convert carbon monoxide to carbon dioxide. Introduction of more sophisticated converters, plus onboard computers and oxygen sensors to help optimize the efficiency of the catalytic converter and the addition of oxygen-containing compounds to gasoline which has the effect of “leaning out” the air-to-fuel ratio, thereby promoting complete fuel combustion. In the US this typically reduced carbon monoxide emissions upwards of 80 percent,[1][9][19] and it is attainable here in Kano.To manage the effect of CO havocs, educating the general population, especially those with cardiovascular and respiratory diseases, about the risk of CO exposure, improving monitoring of CO in the workplace and in public places (streets, shops, restaurants, car parks) and government making urgent efforts to improve power generation, since this will reduce people’s dependence on generators for power supply, encouraging the development of better methods for carbon monoxide detection and promotion of the use of carbon monoxide detectors; catalytic converters on automobiles and improved emissions policies will go a long way to make the Kano Metropolis more pleasant to its inhabitants.[13]